
ES Weekly Plan | September 8-12, 2025
Recap, Market Context & Key Levels for the Week Ahead

Welcome to this week’s plan. Inside, you’ll find a quick review of last week’s price action, key economic events, market structure, context for the week ahead, and the levels I’ll be focusing on. Let’s get prepared.
Contents
Last Week in Review & Bonus Chart
Economic & Earnings Calendar
Market Structure
Contextual Analysis & Plan
Key Levels of Interest
Last Week in Review & Bonus Chart
Last week’s plan: ES Weekly Plan | September 1-5, 2025
Heading into last week, the main focus was whether sellers could sustain downside momentum following the liquidation break on Friday the 29th, which rejected Thursday’s breakout attempt. That breakout session had cleaned up the unfinished business above, marked by the untested overnight ATH, adding extra weight to the case for weakness.
The market kicked off the week with a notable true gap down on Tuesday (Monday was a holiday session), adding immediate downside pressure. Sellers ended the weekly one-time framing up by breaking the prior week’s low at 6445, which then became a level they needed to defend to apply further downside pressure, as discussed. While Tuesday’s session opened weak, it reversed sharply after tagging the August value area low at 6375, closing at the highs.
The key levels heading into Wednesday’s session were the prior week’s low at 6445 and Tuesday’s unfilled gap at 6455.50. Reclaiming 6445 would signal a bullish response, while failure to do so would maintain downside pressure. The market reclaimed 6445 and closed the gap—something stronger sellers would not have allowed—highlighting their poor follow-through after Tuesday’s weakness. Note how well the Smashlevel at 6425 came into play.
On Thursday, sellers essentially had no choice—they needed to break 6445 again and push back within Tuesday’s range below 6425. Failing to do so opened the door for a traverse of the August value area toward 6502, after the market had tagged its VAL on Monday at 6375, as discussed in Thursday’s plan.
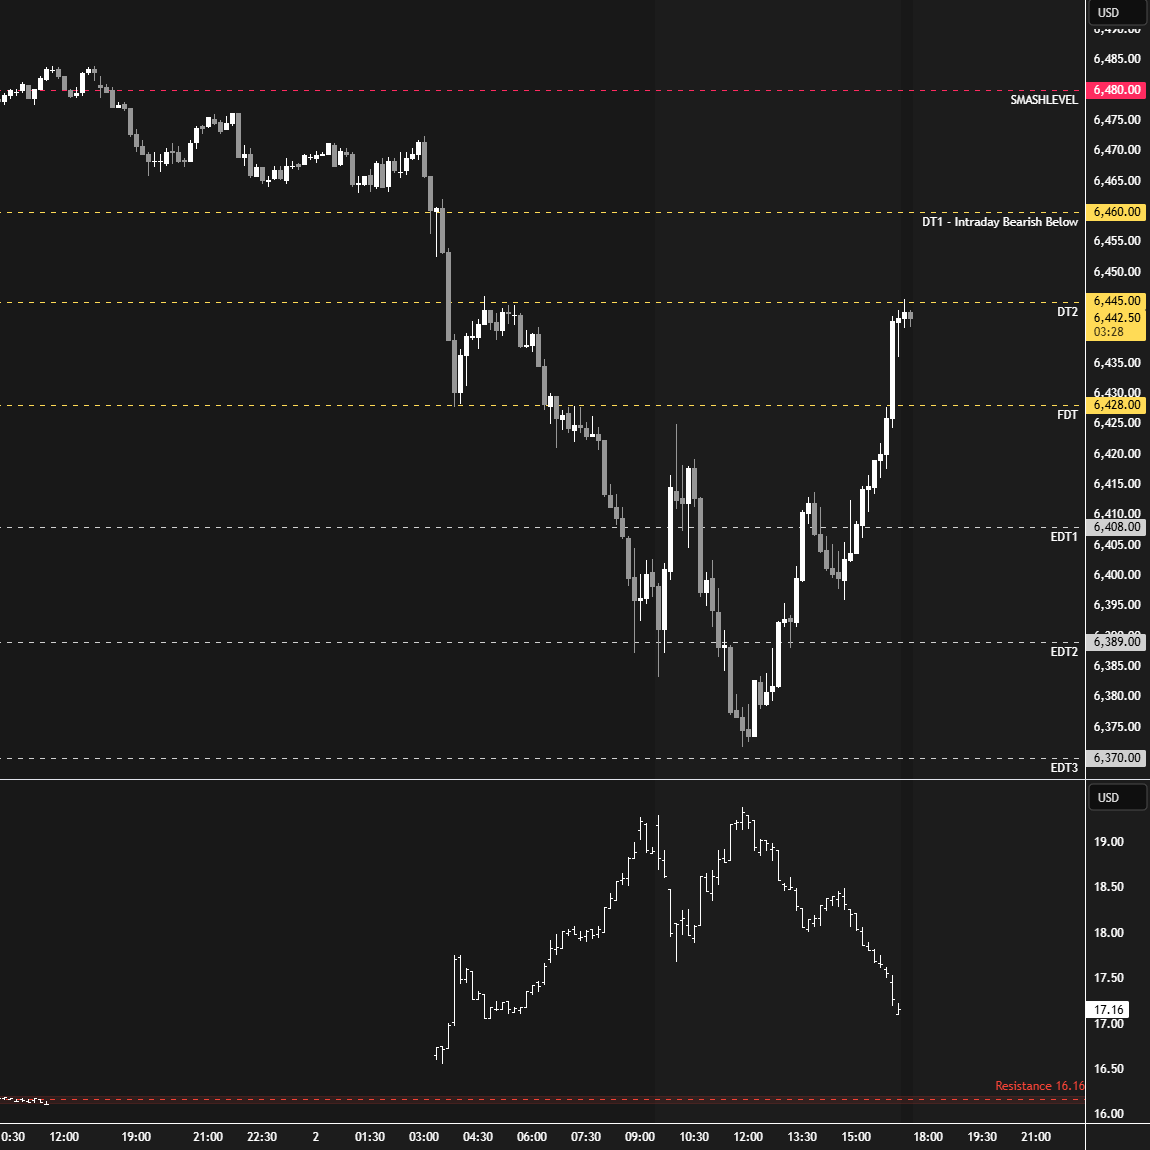
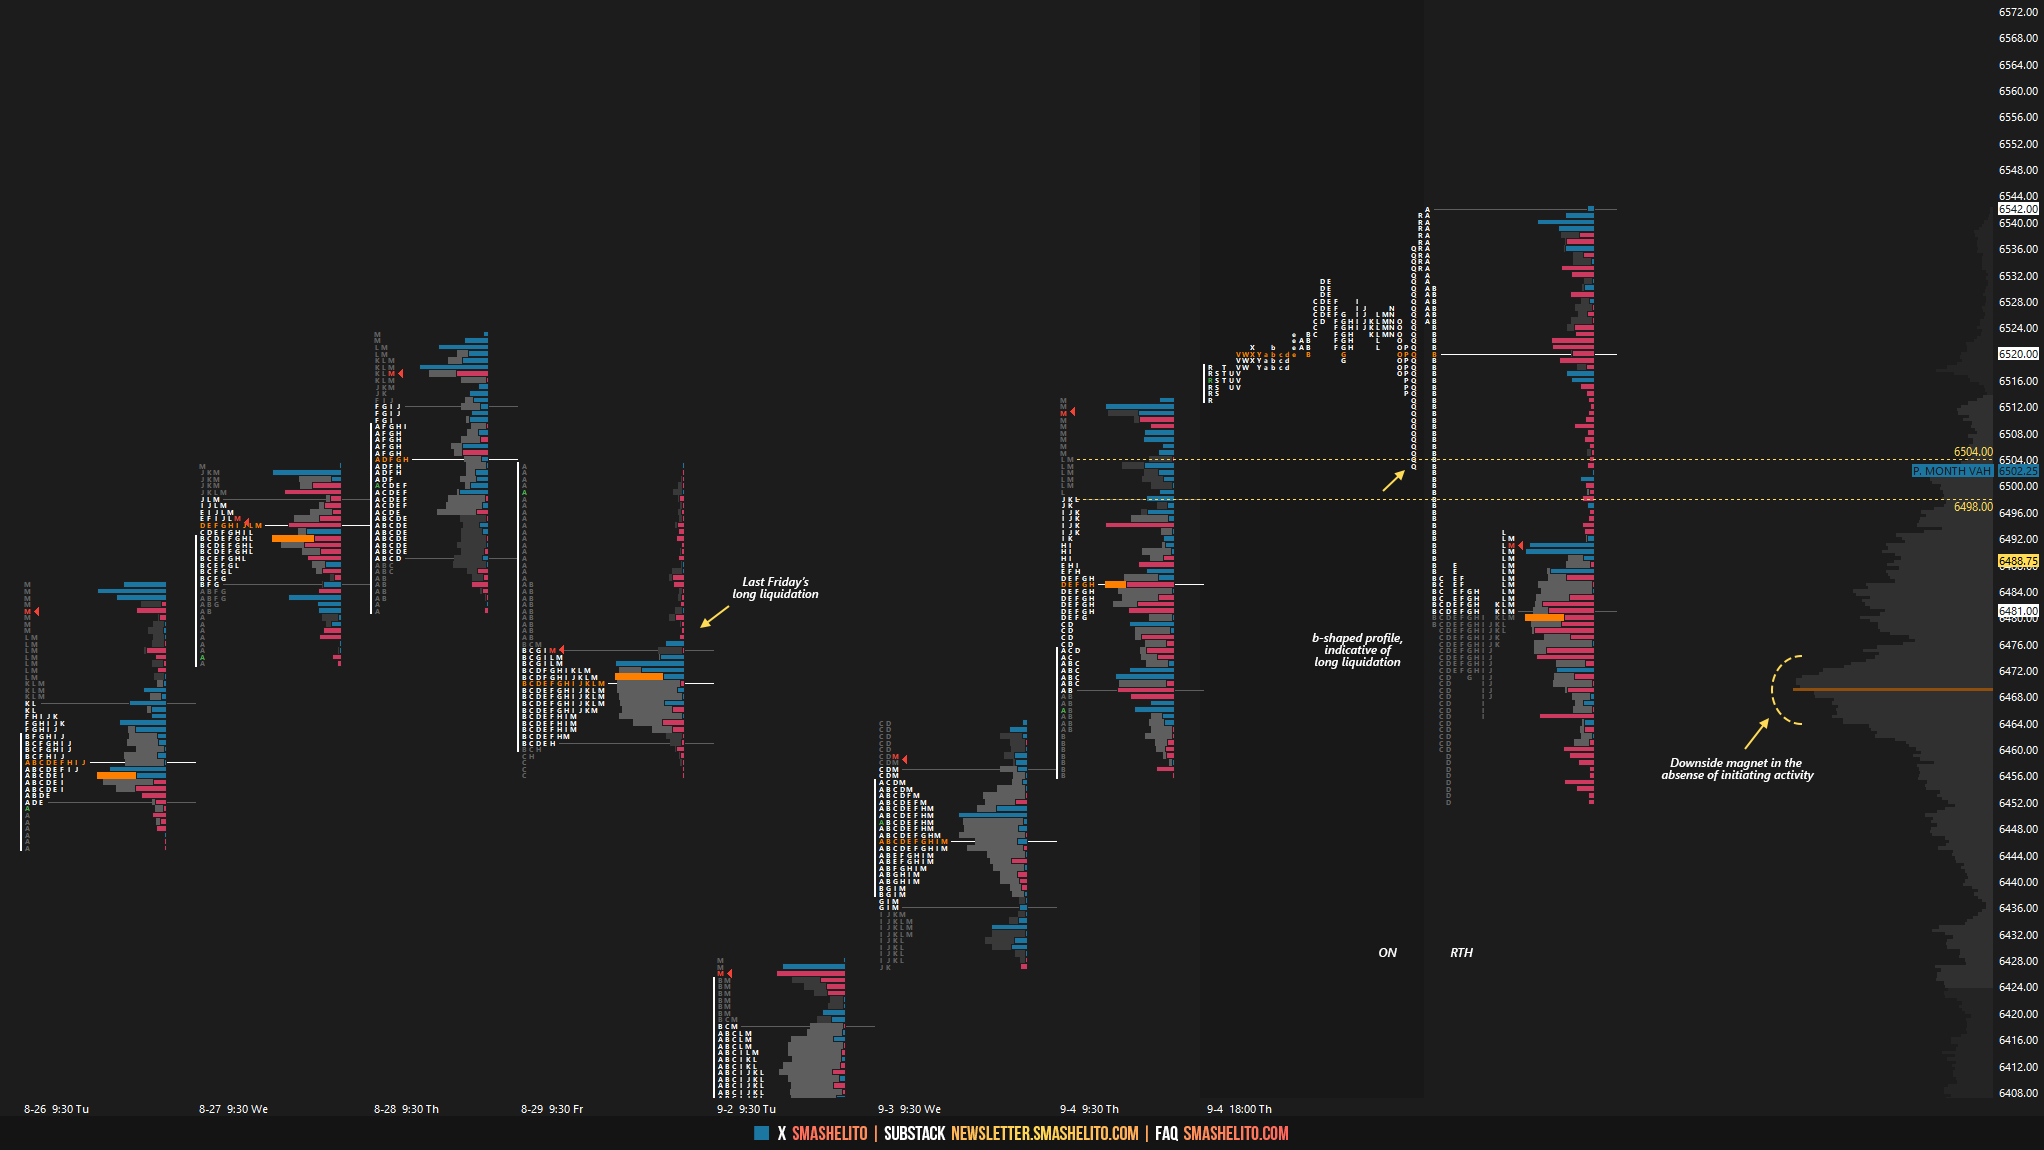
Thursday’s session ultimately established a multi-distribution trend day, completing a full traverse of the August value area after reclaiming 6480, one of the session’s upside targets. Note how aggressive sellers were absorbed by passive buyers after reclaiming 6480—good fuel for the push higher (see Figure 1).
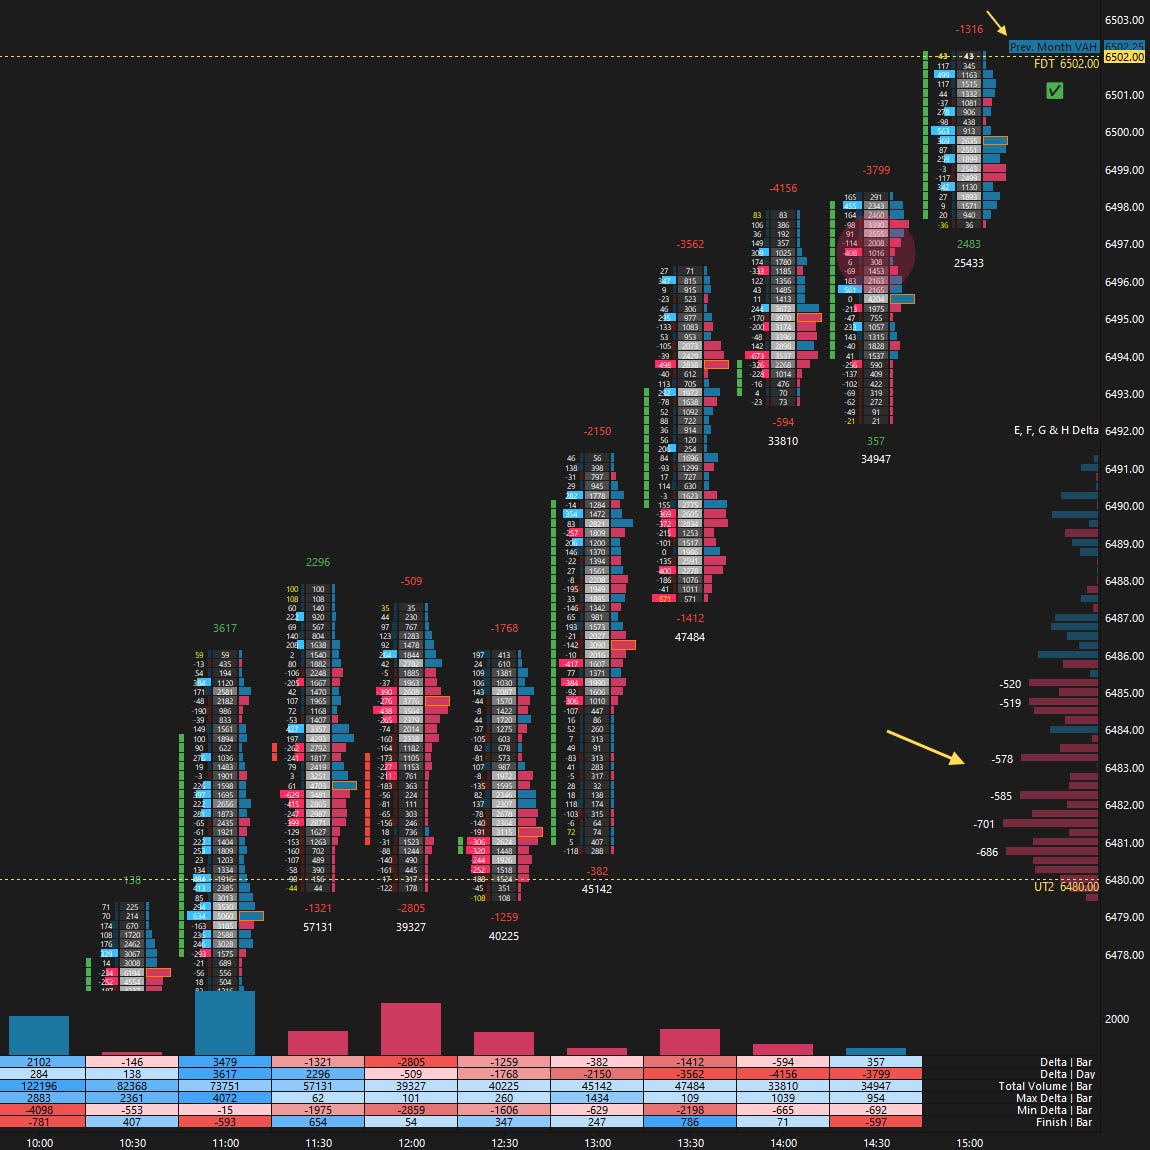
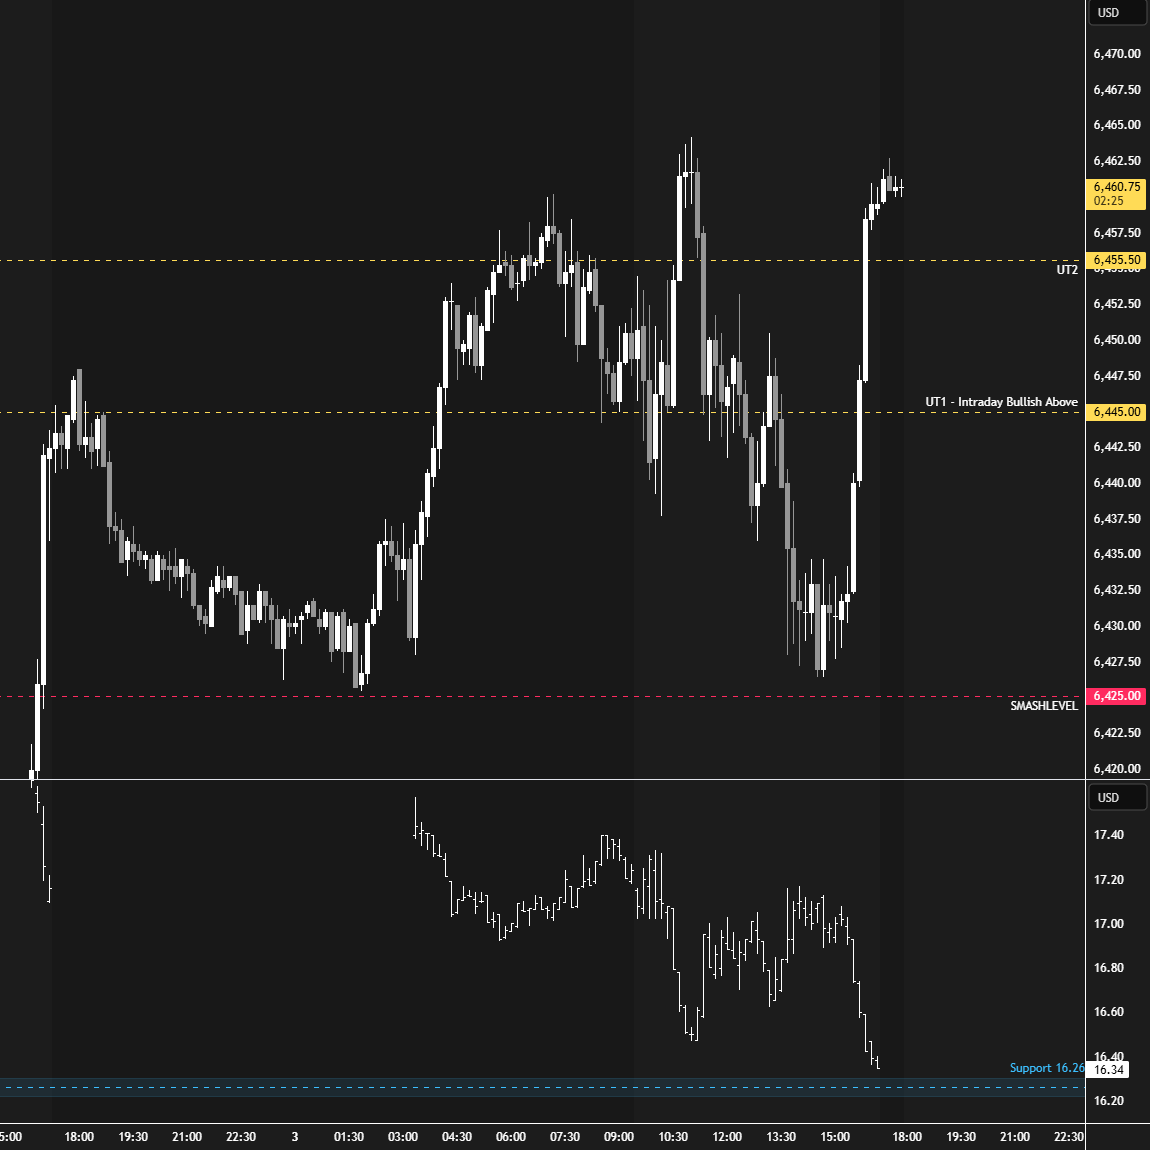
Since Thursday’s session closed above the August value area high at 6502, the key for buyers on Friday was to defend this level, closely aligned with Thursday’s spike base, signaling another potential attempt at an upside imbalance. Failure to hold would open the door for a return to the high volume node at 6471, considered fair value (see Figure 2).
Thursday's spike base attracted responsive buyers pre-open; however, the lack of initiating buyers in RTH ultimately triggered long liquidation, similar to last Friday. In the process, the market cleaned up Thursday's poor structure, returning to value.
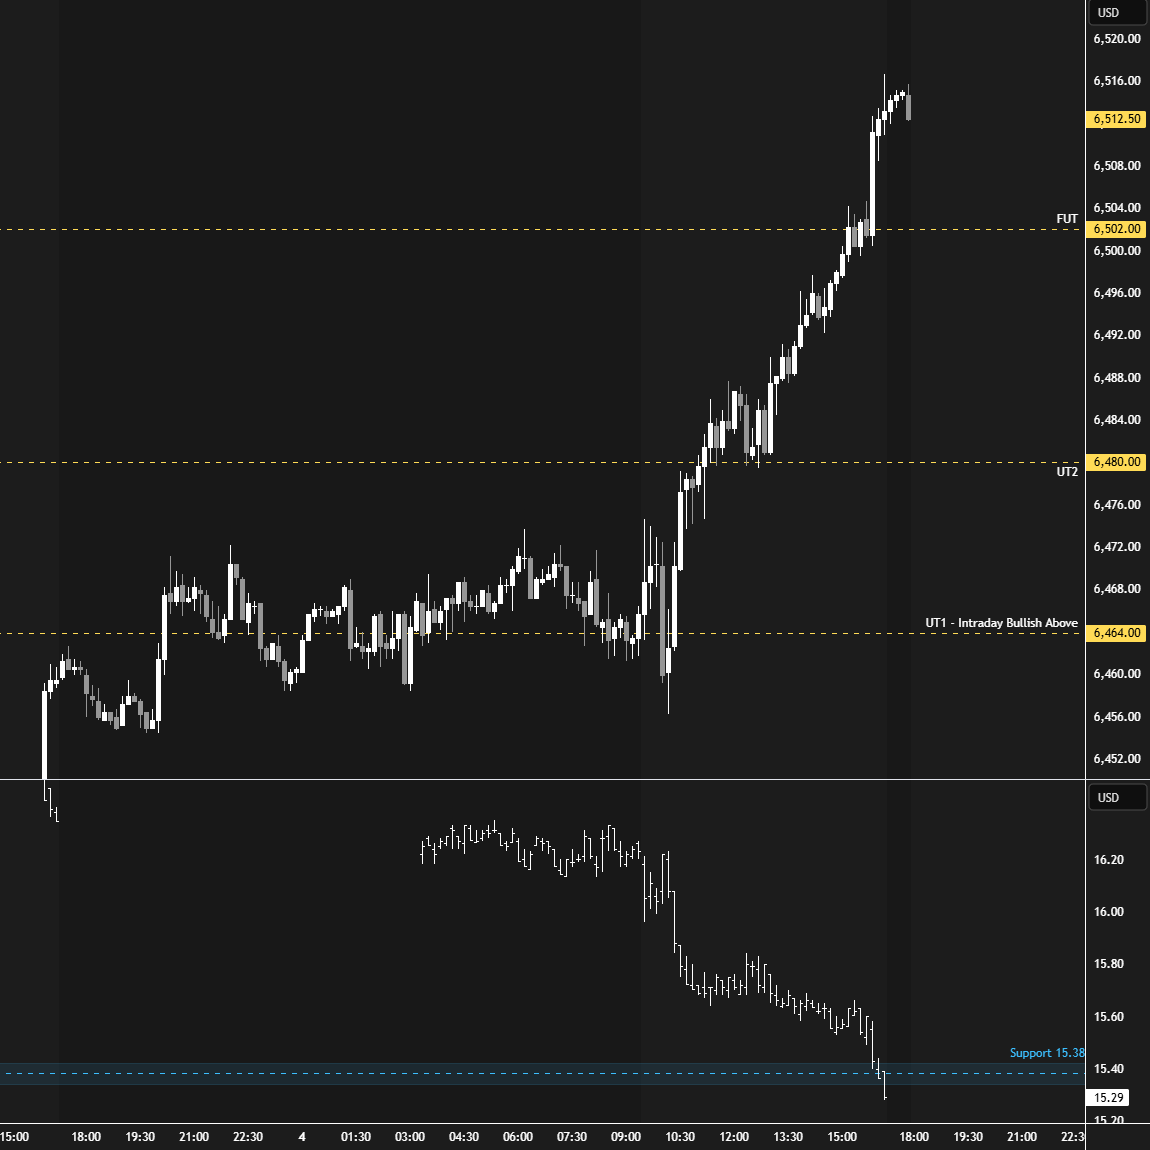
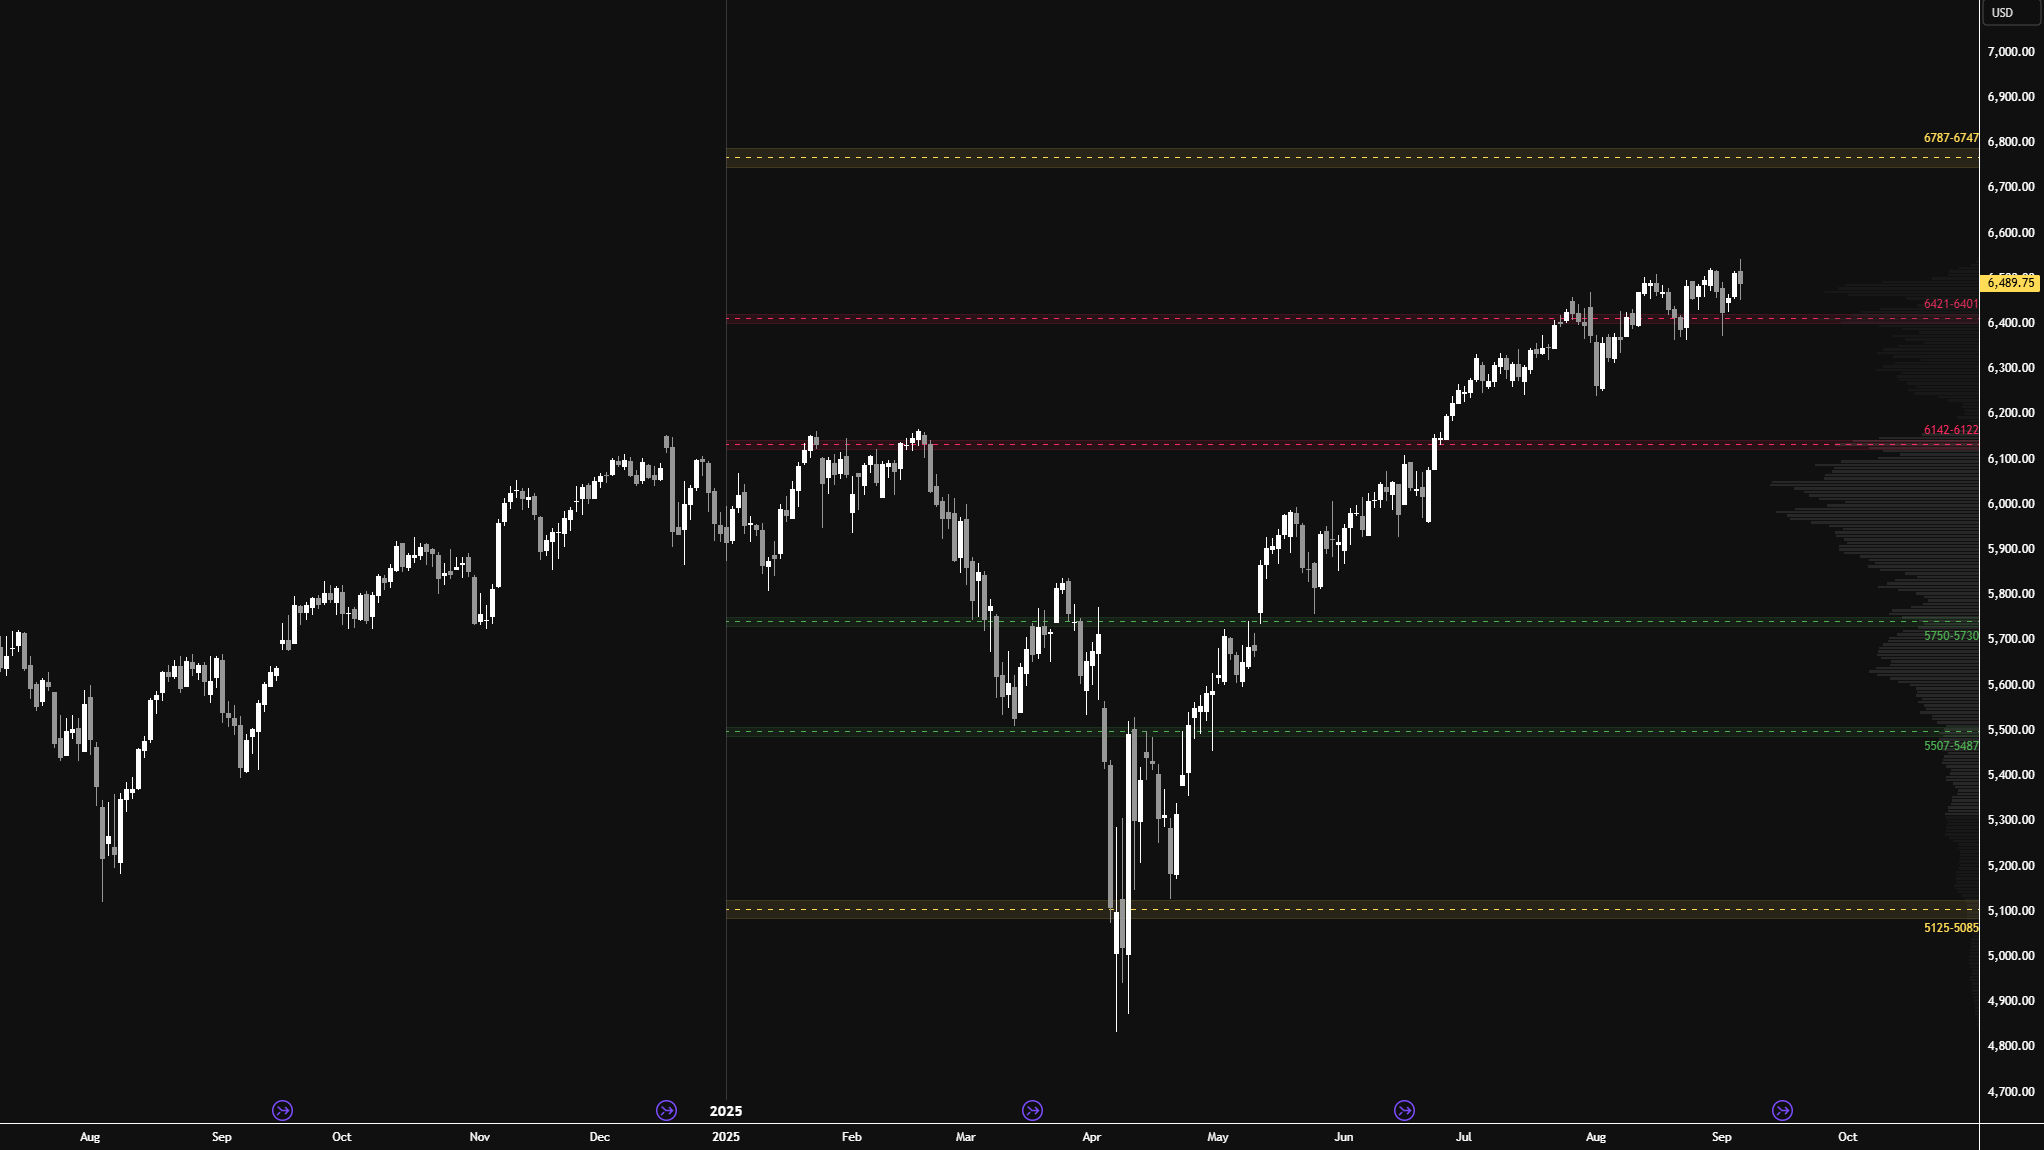
I will continue to include the HTF chart from a good friend of mine (see Figure 3), featuring levels generated by one of his models at the start of 2025. As you can see, this year’s price action has respected these levels remarkably well.
The key takeaway is that buyers continue to defend the 6421–6401 area of interest. As noted last week, unless acceptance is established below this area, maintaining a bearish bias remains difficult.
Only acceptance back below 6421–6401 has the potential to introduce short-term weakness. Such a scenario would open the door to testing the prior all-time high from earlier this year, which roughly aligns with the 6142–6122 area and also marks the year’s value area high.
Economic & Earnings Calendar
Market Structure
🟨 Daily: BALANCE → 2-Day → High: 6541.75 / Low: 6452
🟨 Weekly: BALANCE → 4-Week → high: 6541.75 / Low: 6362.75
🟩 Monthly: OTFU → Ends at: 6239.50
Balance: A market condition where price consolidates within a defined range, reflecting indecision as the market awaits more market-generated information. We apply balance guidelines—favoring fade trades at range extremes (highs/lows) and preparing for breakout setups if balance resolves.
One-Time Framing Up (OTFU): A market condition where each subsequent bar forms a higher low, signaling a strong upward trend.
One-Time Framing Down (OTFD): A market condition where each subsequent bar forms a lower high, signaling a strong downward trend.
Contextual Analysis & Plan
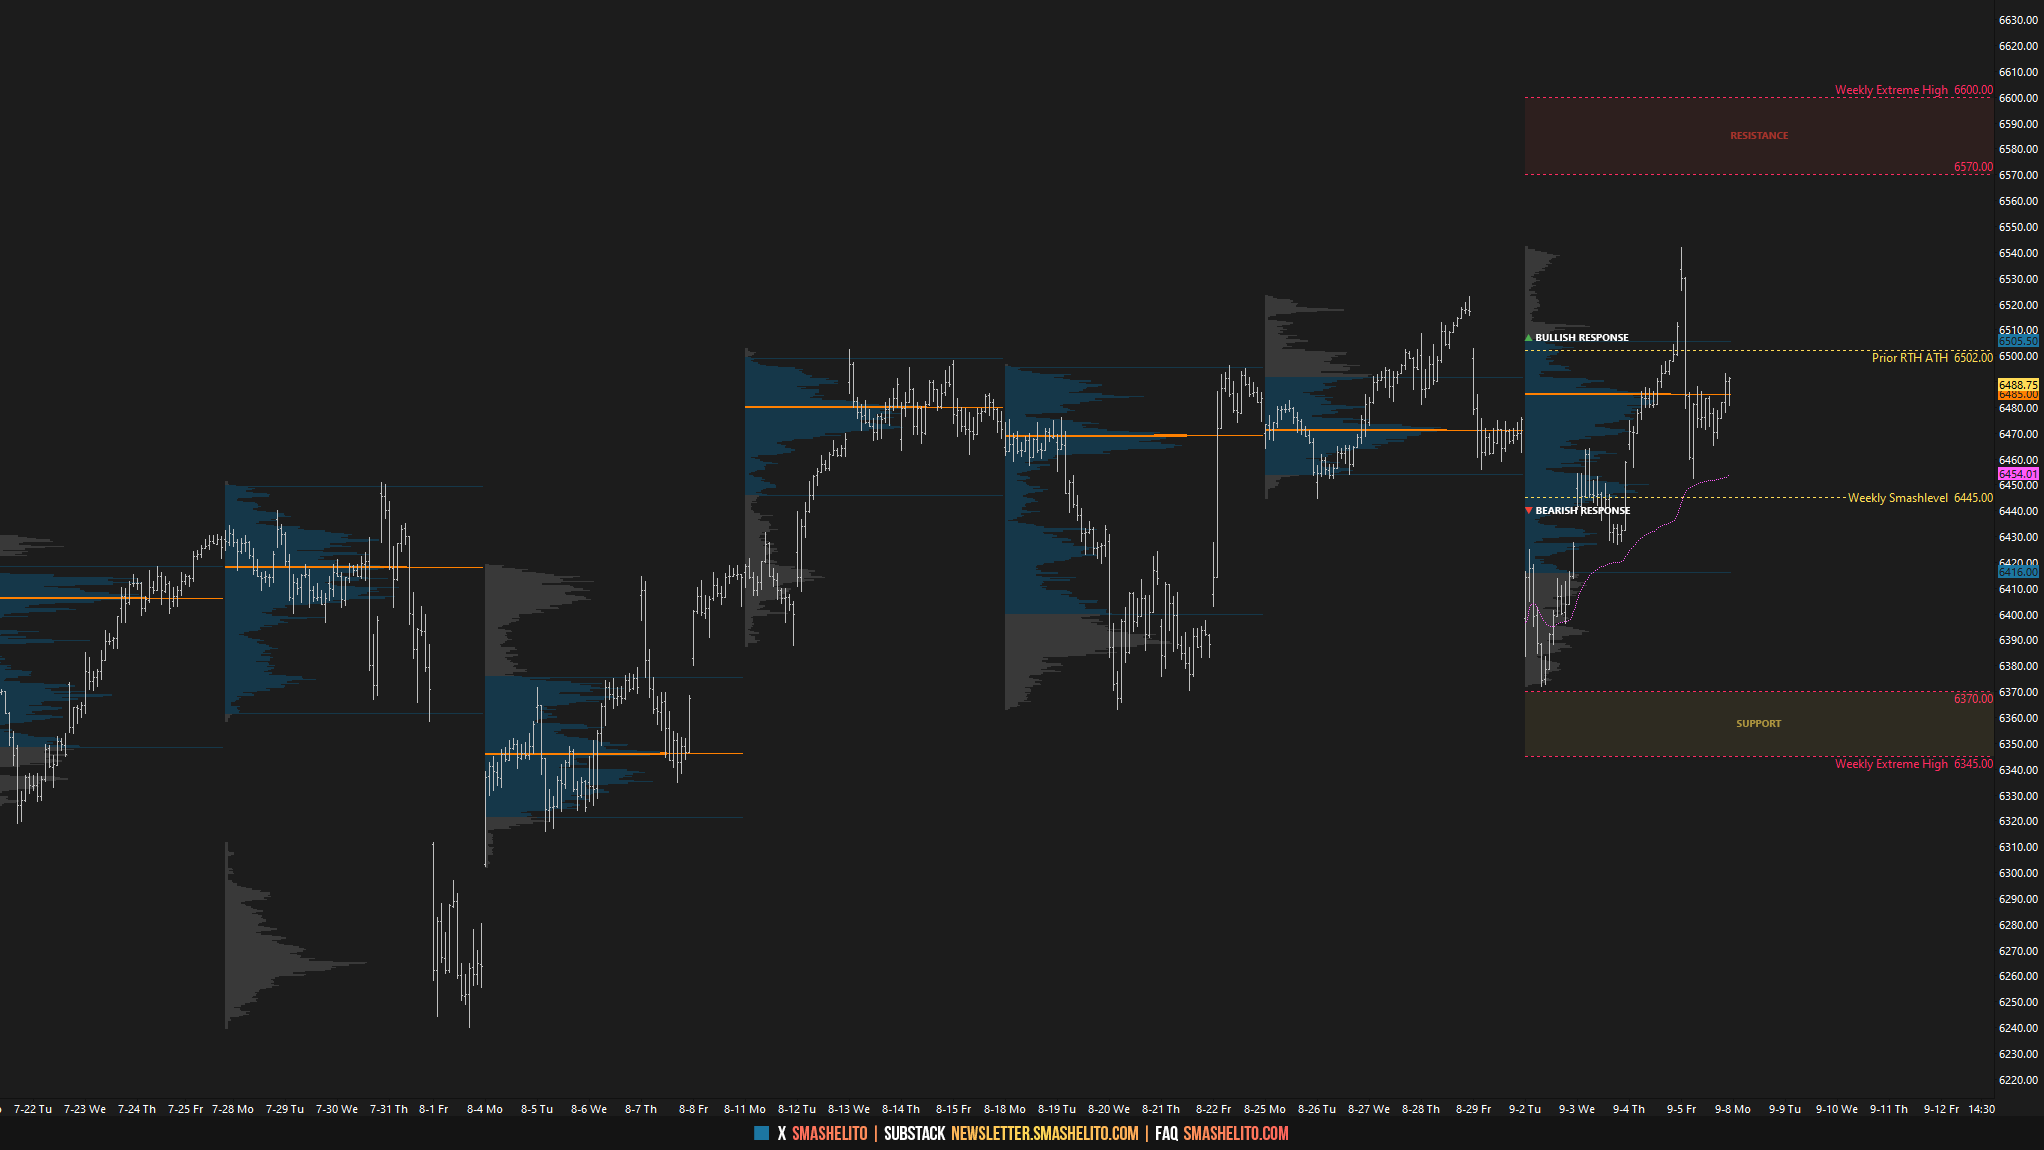
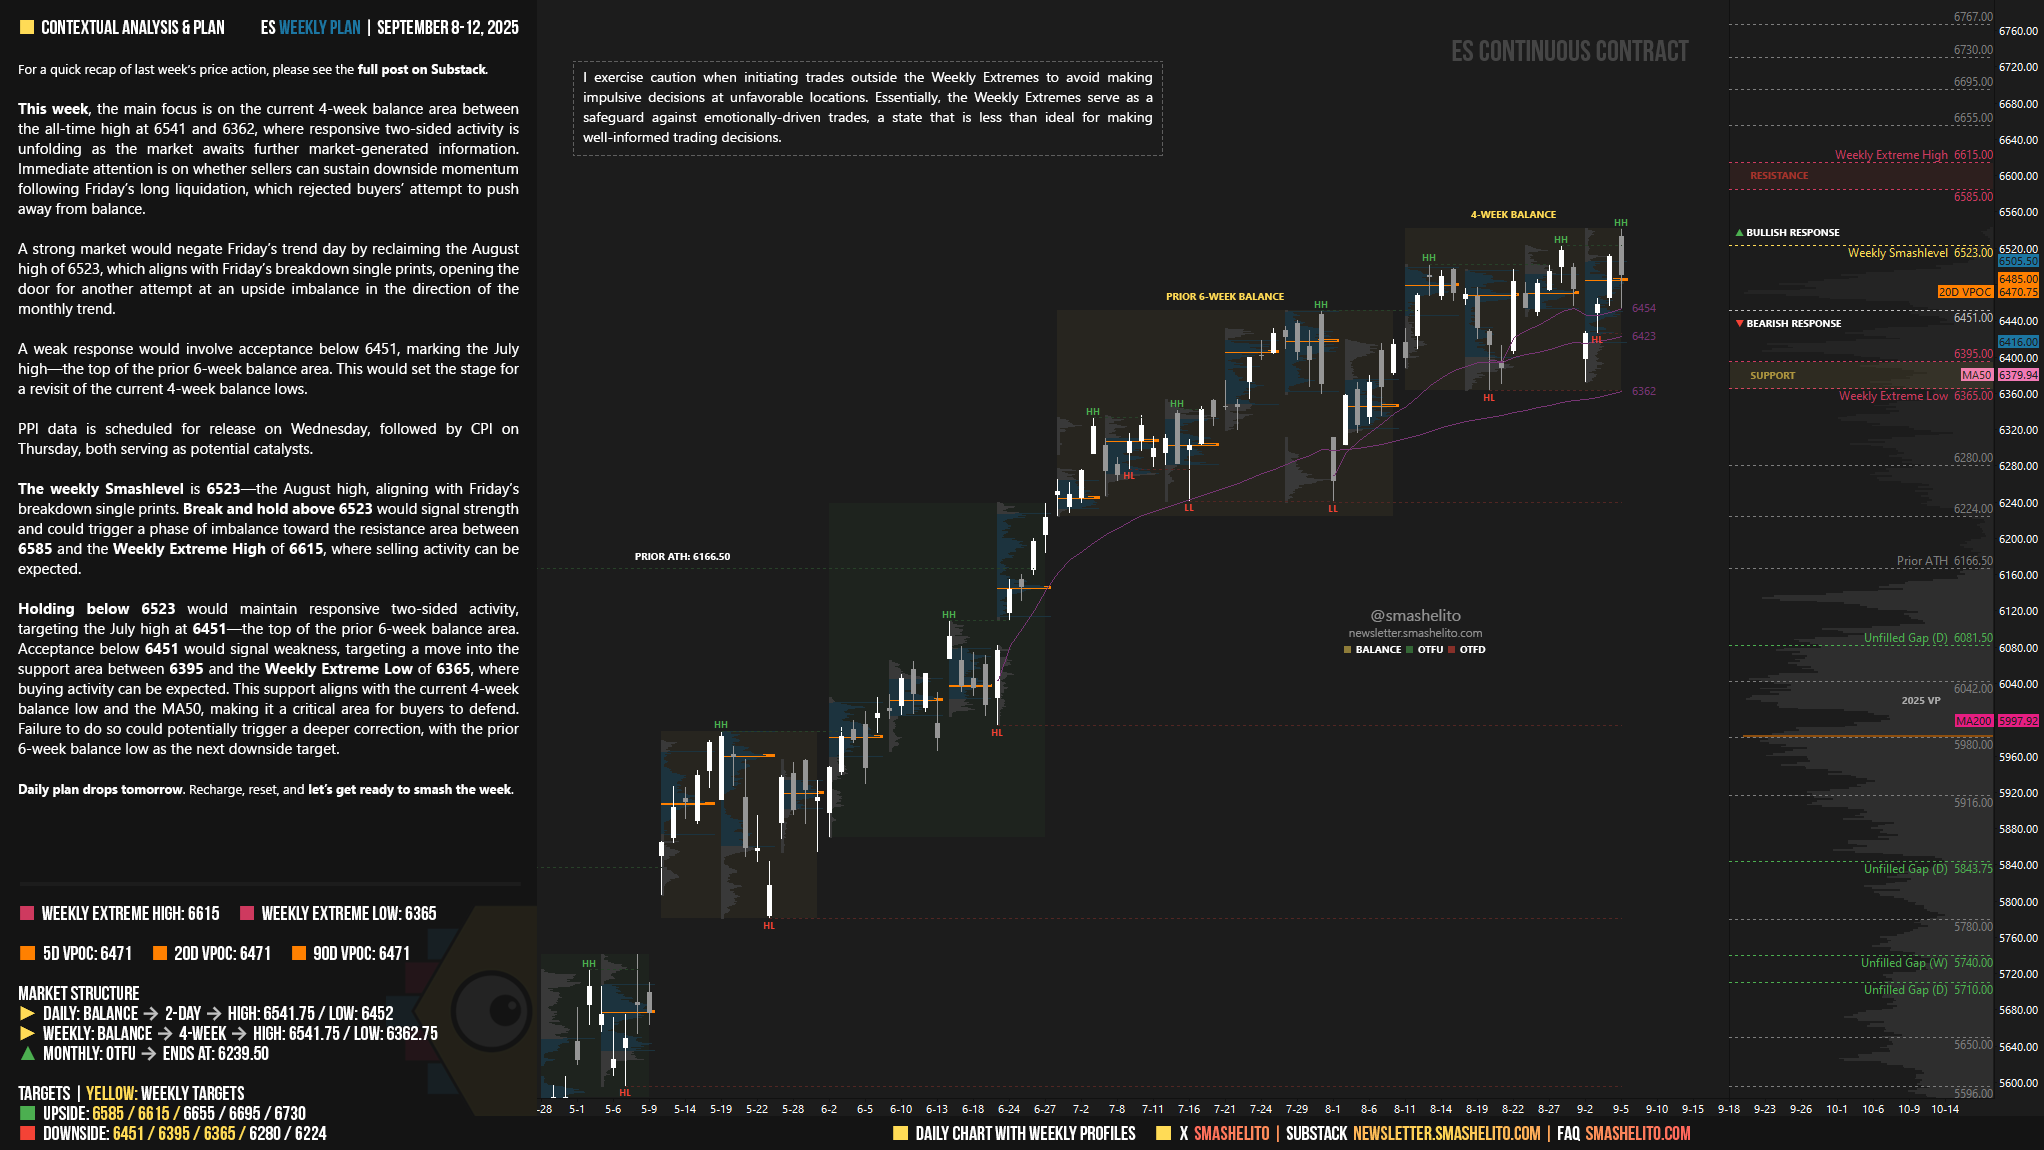
This week, the main focus is on the current 4-week balance area between the all-time high at 6541 and 6362, where responsive two-sided activity is unfolding as the market awaits further market-generated information. Immediate attention is on whether sellers can sustain downside momentum following Friday’s long liquidation, which rejected buyers’ attempt to push away from balance.
A strong market would negate Friday’s trend day by reclaiming the August high of 6523, which aligns with Friday’s breakdown single prints, opening the door for another attempt at an upside imbalance in the direction of the monthly trend.
A weak response would involve acceptance below 6451, marking the July high—the top of the prior 6-week balance area. This would set the stage for a revisit of the current 4-week balance lows.
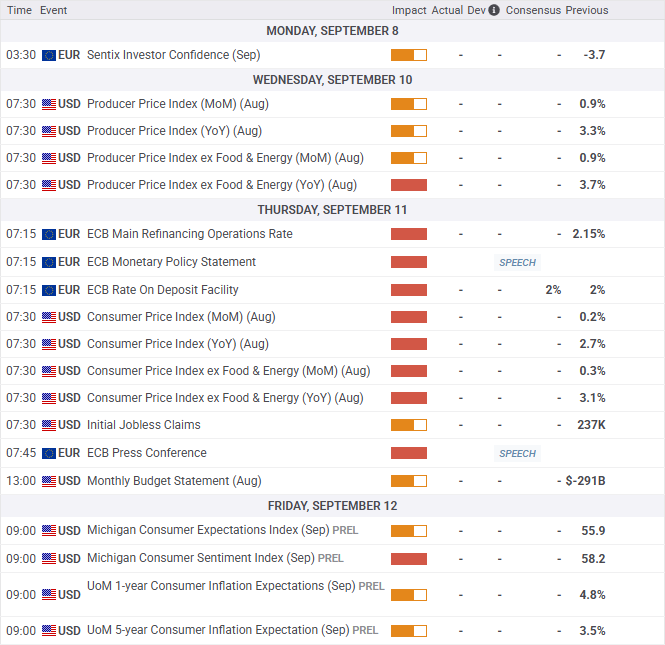
PPI data is scheduled for release on Wednesday, followed by CPI on Thursday, both serving as potential catalysts.
The weekly Smashlevel is 6523—the August high, aligning with Friday’s breakdown single prints. Break and hold above 6523 would signal strength and could trigger a phase of imbalance toward the resistance area between 6585 and the Weekly Extreme High of 6615, where selling activity can be expected.
Holding below 6523 would maintain responsive two-sided activity, targeting the July high at 6451—the top of the prior 6-week balance area. Acceptance below 6451 would signal weakness, targeting a move into the support area between 6395 and the Weekly Extreme Low of 6365, where buying activity can be expected. This support aligns with the current 4-week balance low and the MA50, making it a critical area for buyers to defend. Failure to do so could potentially trigger a deeper correction, with the prior 6-week balance low as the next downside target.
Key Levels of Interest
In the upcoming week, I will closely observe the behavior around 6523.
Break and hold above 6523 would target 6585 / 6615* / 6655 / 6695 / 6730
Holding below 6523 would target 6451 / 6395 / 6365* / 6280 / 6224
*Weekly Extremes. I exercise caution when initiating trades outside the Weekly Extremes to avoid making impulsive decisions at unfavorable locations. Essentially, the Weekly Extremes serve as a safeguard against emotionally-driven trades, a state that is less than ideal for making well-informed trading decisions.
Daily plan drops tomorrow. Recharge, reset, and let’s get ready to smash the week.
Thankyou.. waiting for tomorrow's level
Thanks Smash!