ES Weekly Plan | September 1-5, 2025
Recap, Market Context & Key Levels for the Week Ahead
Welcome to this week’s plan. Inside, you’ll find a quick review of last week’s price action, key economic events, market structure, context for the week ahead, and the levels I’ll be focusing on. Let’s get prepared.
Contents
Last Week in Review & Bonus Chart
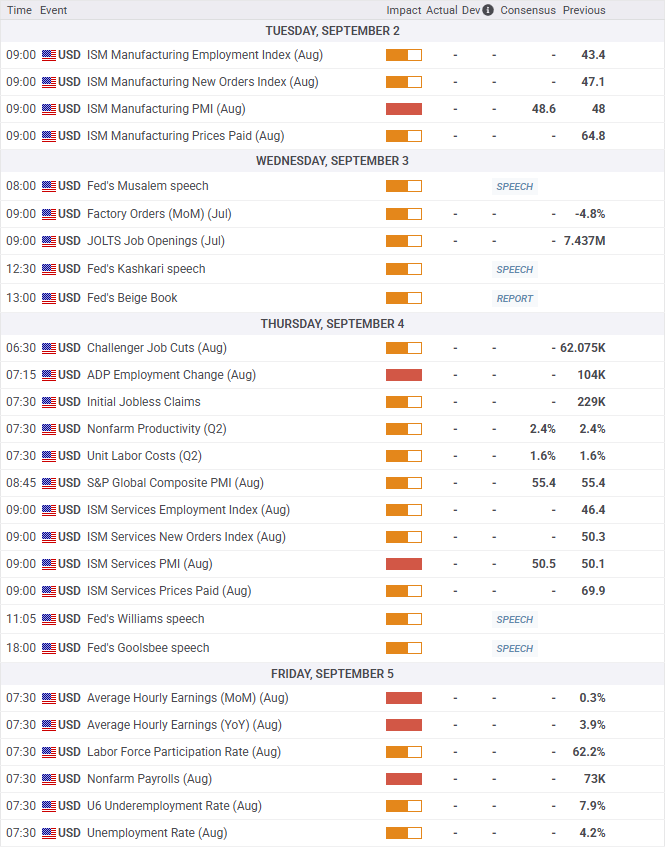
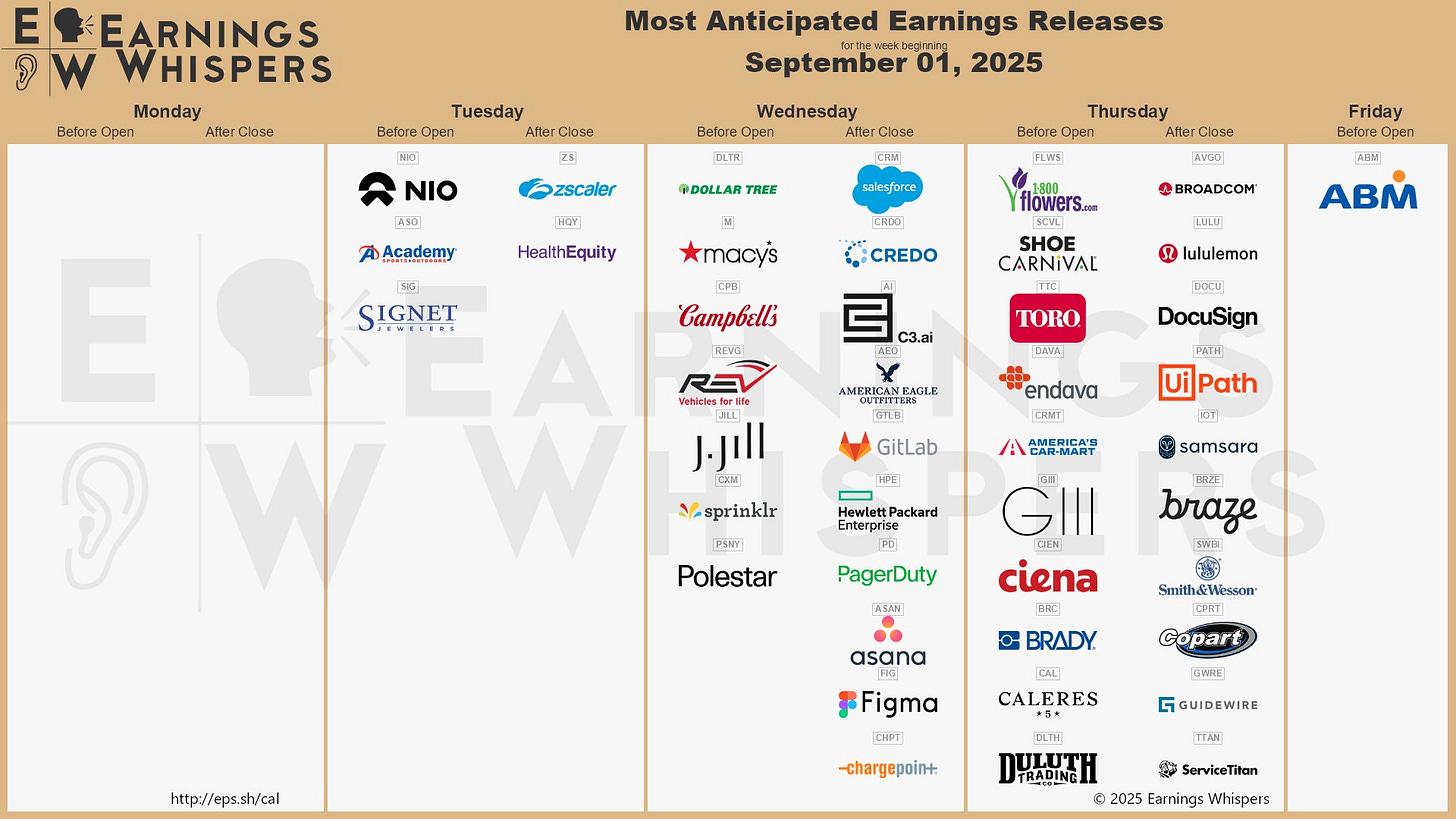
Economic & Earnings Calendar
Market Structure
Contextual Analysis & Plan
Key Levels of Interest
Last Week in Review & Bonus Chart
Last week’s plan: ES Weekly Plan | August 25-29, 2025
Heading into last week, the main focus was the 2-week balance area, ranging from 6362.75 to the RTH ATH at 6502.50. There was also unfinished business above, marked by the untested overnight ATH at 6508.75. Immediate attention was on whether the short-covering rally from August 22nd, which left behind a large set of single prints, would find acceptance or be rejected, making it crucial to monitor where value would develop early in the week.
A strong market would show little interest in filling those single prints, while a less bullish response would involve partially filling them, with buyers ideally defending the 6451 level. Failure to do so would signal weakness.
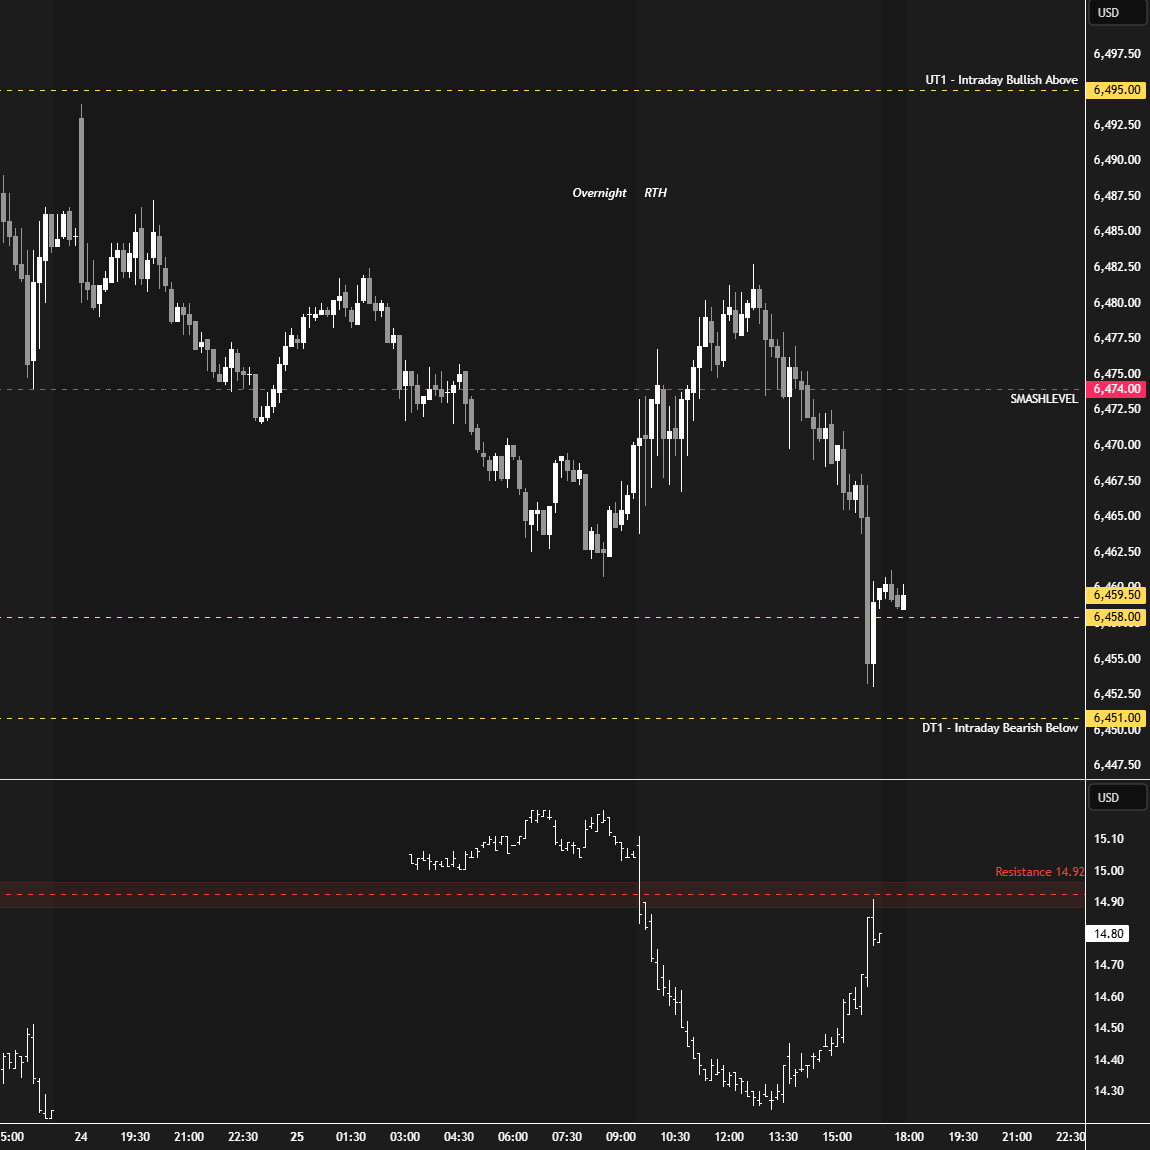
The market kicked off the week with an inside day on Monday: morning strength gave way to afternoon weakness, partially filling the August 22nd single prints. The session closed with a downward spike, which was a key area to monitor heading into Tuesday.
On Tuesday, the overnight session showed notable weakness, nearly completing the fill of the August 22nd single prints at 6428 (ON Low: 6430.75). Generally, only the RTH session counts toward structural repair, but an overnight fill can’t be ignored—it still carries some weight. That overnight weakness was rejected during RTH, as buyers held the 6451 level and ultimately rejected Monday’s downward spike, triggering a closing rally.
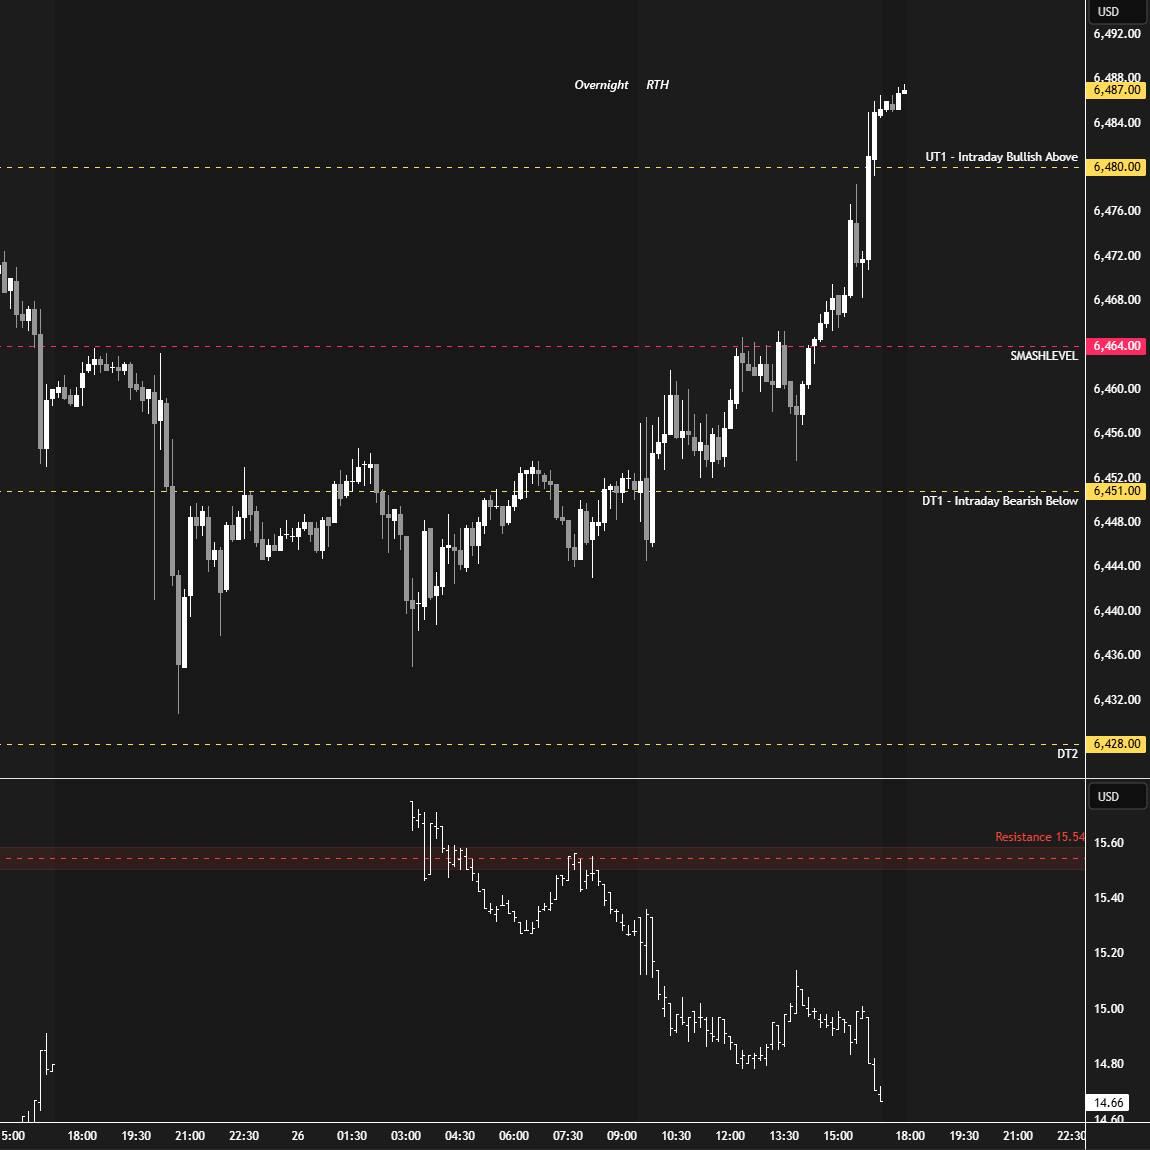
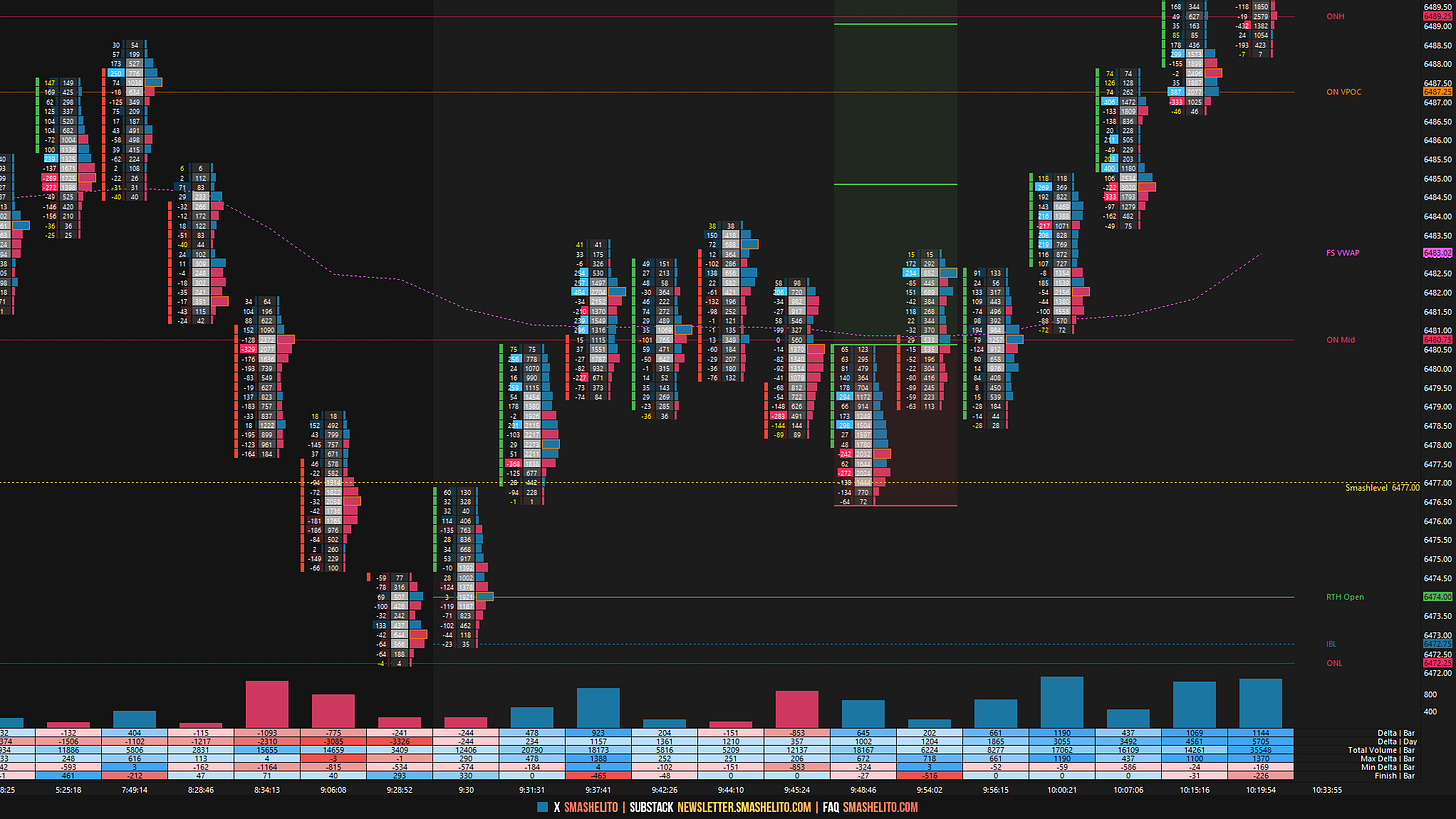
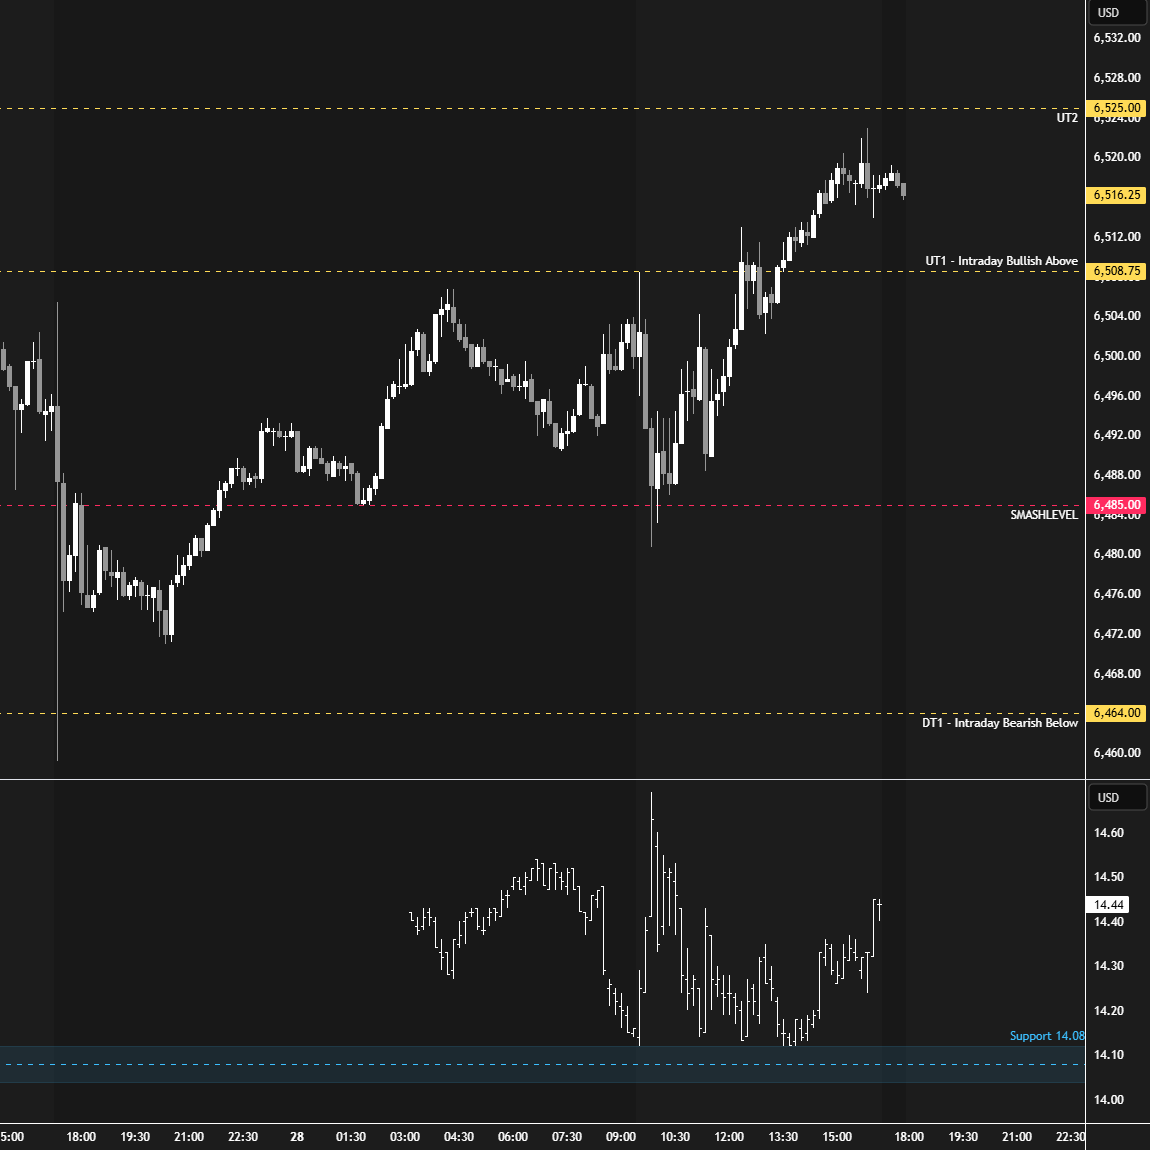
Heading into Wednesday’s session, the key was to monitor whether Tuesday’s closing strength would be accepted or rejected. Buyers immediately reclaimed the Smashlevel at 6477, and passive buyers defended it during the subsequent pullback, resulting in a continuation higher (see Figure 1). The main event, of course, was NVDA’s earnings after-hours, which triggered weakness.
On Thursday, the immediate focus was on whether buyers could regain acceptance within Wednesday’s value area, above the Smashlevel at 6485, following the weakness triggered by NVDA’s earnings. Buyers successfully achieved this overnight and defended a perfect retest, resulting in a continuation higher. In the process, the unfinished business at the overnight all-time high of 6508.75 was cleaned up, and the market broke out of balance.
The key heading into Friday’s session was to monitor for continuation or a lack thereof. As discussed in Friday’s Plan, a strong market would build value above 6502, while failure to do so would put Thursday’s breakout into question.
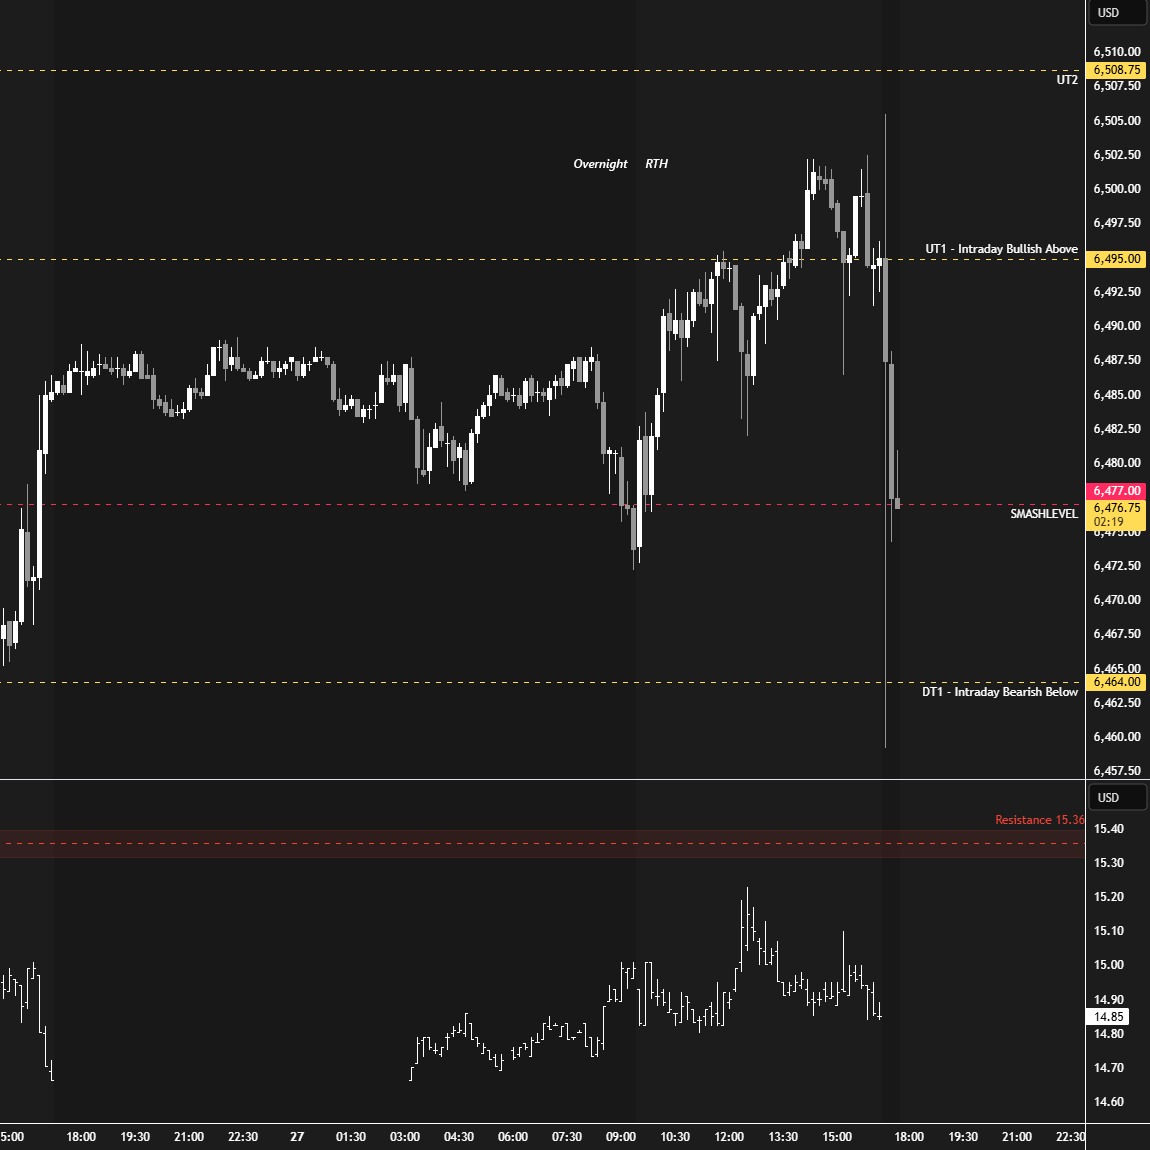
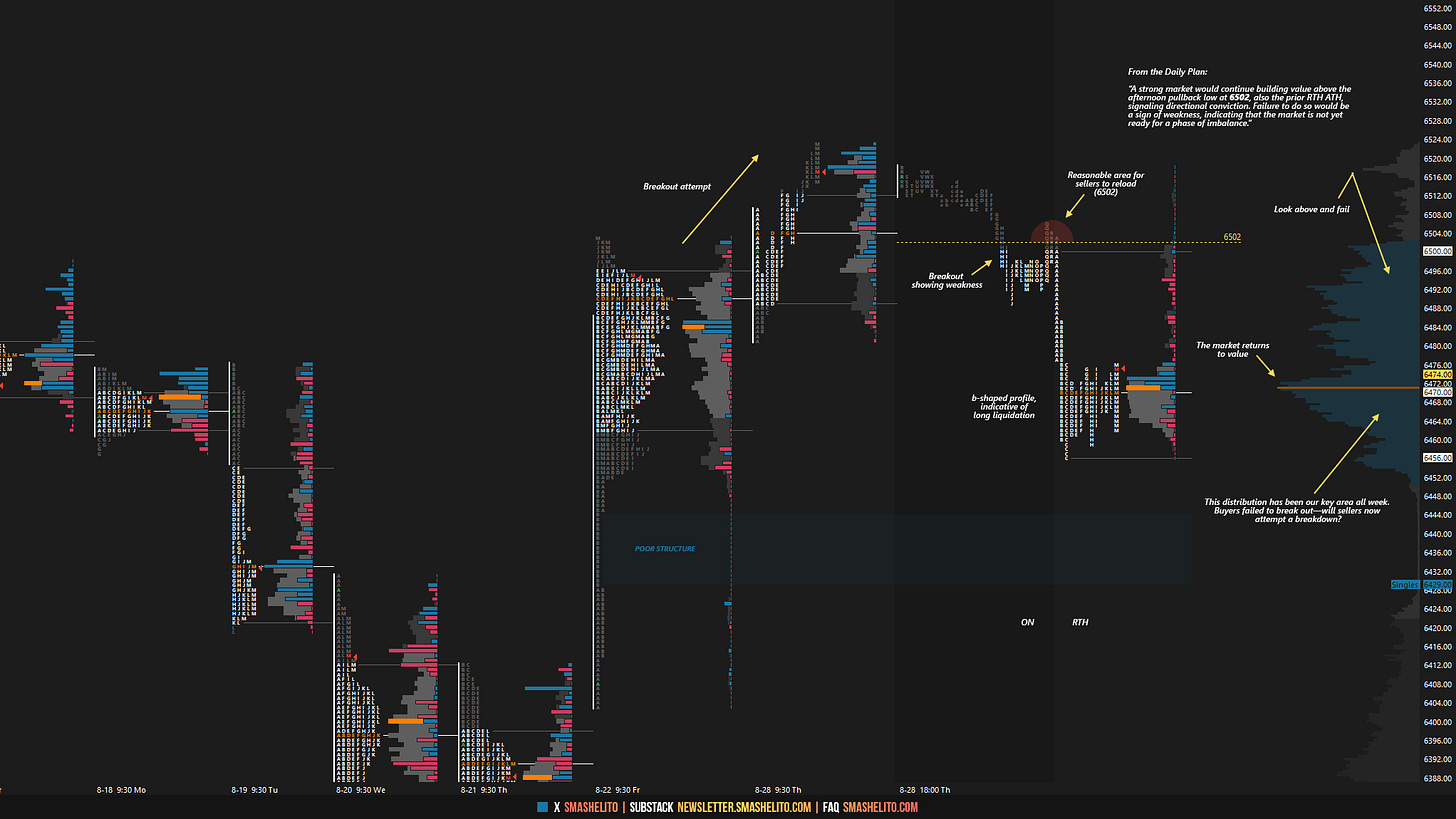
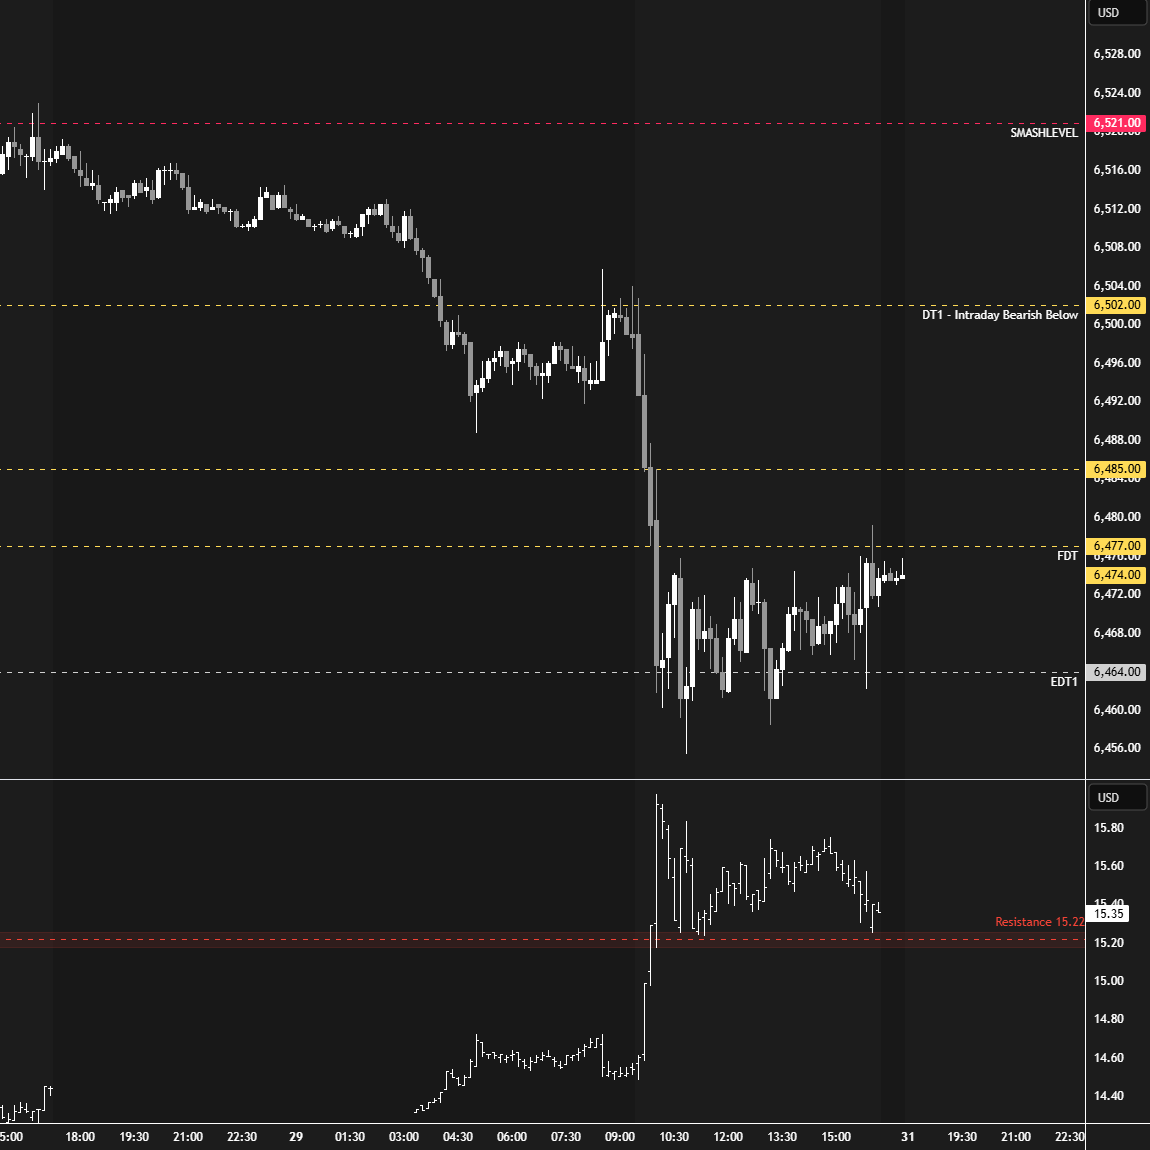
Thursday's breakout attempt ultimately resulted in a failure. The crucial 6502 level was taken out overnight and perfectly re-offered in the RTH session (HOD: 6502.75). Long liquidation followed, leaving behind a classic b-shaped profile (see Figure 2).
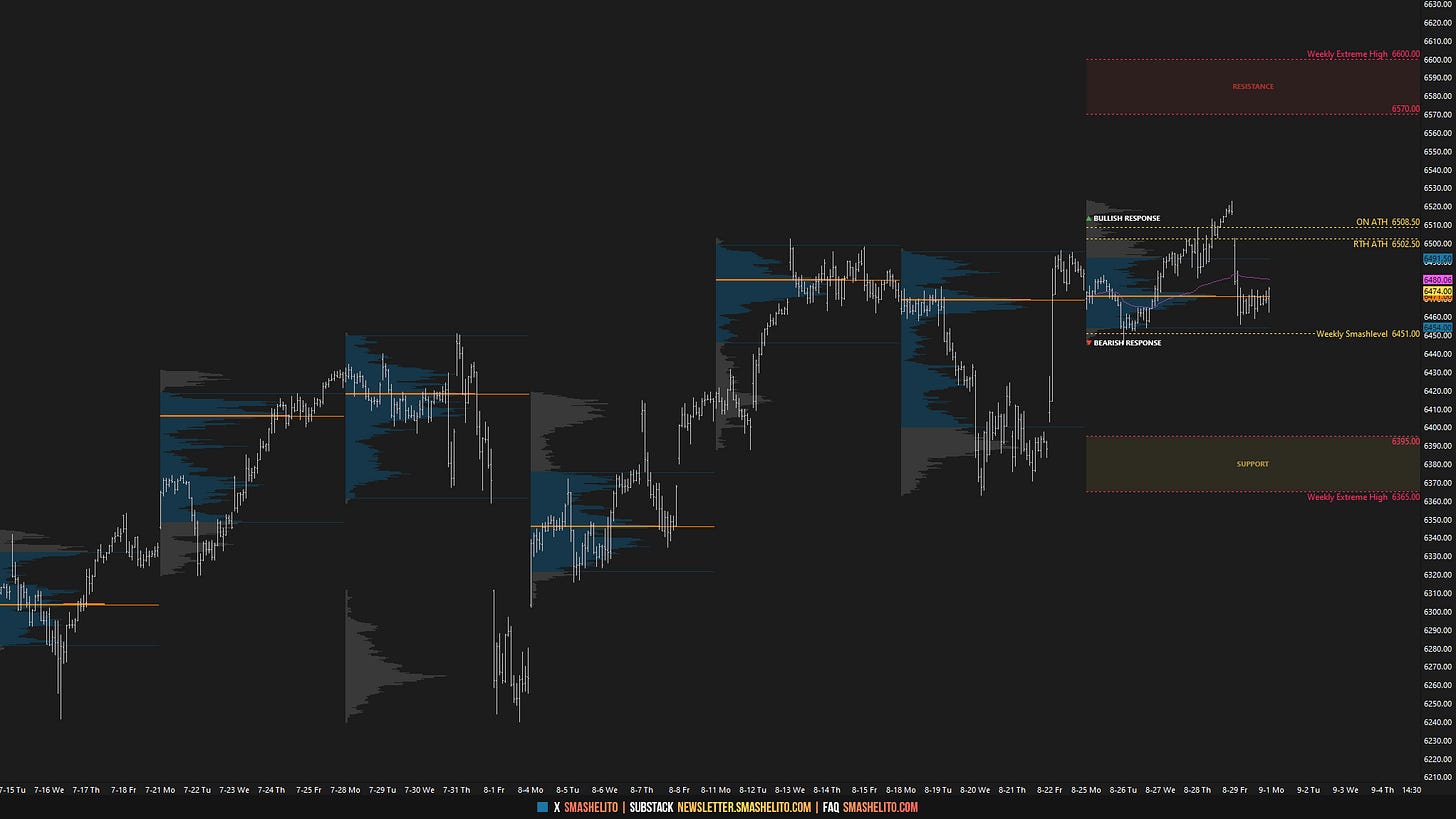
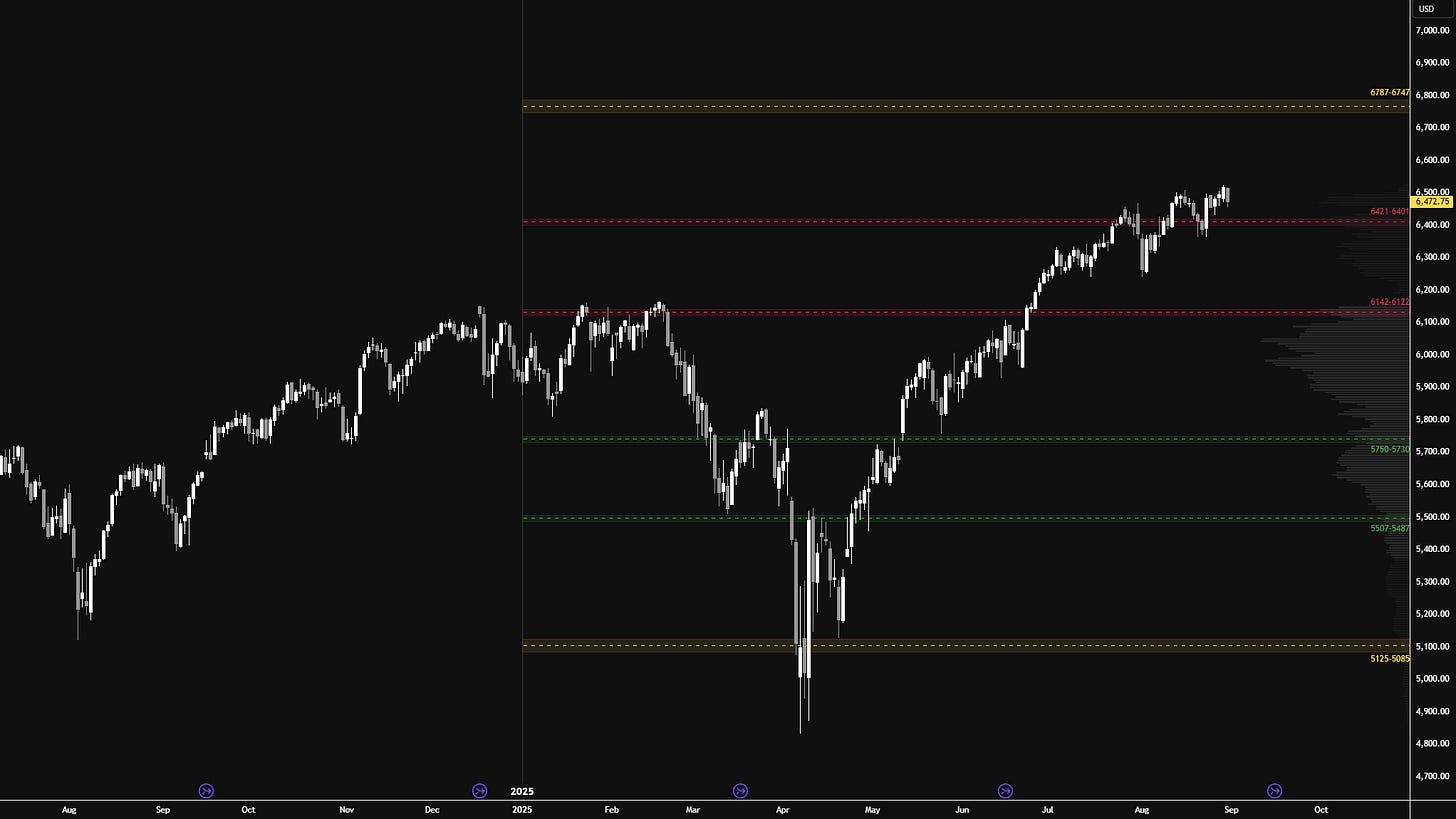
I will continue to include the HTF chart from a good friend of mine (see Figure 3), featuring levels generated by one of his models at the start of 2025. As you can see, price action this year has respected these levels remarkably well.
The market has been building value above the 6421–6401 area of interest, with three weekly VPOCs located above, but the pace to the upside has so far been lacking. One key nuance is that all unfinished business has been cleaned up and an ATH has been printed in regular trading hours, which at least gives sellers an opening to initiate a downward auction. However, as long as acceptance is not established below this area, maintaining a bearish bias is tricky.
Only acceptance back below the 6421–6401 area—which would also negate Friday’s upside move from August 22nd—has the potential to introduce short-term weakness. This scenario would open the door to testing the prior all-time high from earlier this year, roughly aligned with the 6142–6122 area, which also marks the year’s value area high.
Economic & Earnings Calendar
Market Structure
🟨 Daily: BALANCE → 5-Day → High: 6523 / Low: 6444.50
🟩 Weekly: OTFU → Ends at: 6444.50
🟩 Monthly: OTFU → Ends at: 6239.50
Balance: A market condition where price consolidates within a defined range, reflecting indecision as the market awaits more market-generated information. We apply balance guidelines—favoring fade trades at range extremes (highs/lows) and preparing for breakout setups if balance resolves.
One-Time Framing Up (OTFU): A market condition where each subsequent bar forms a higher low, signaling a strong upward trend.
One-Time Framing Down (OTFD): A market condition where each subsequent bar forms a lower high, signaling a strong downward trend.
Contextual Analysis & Plan
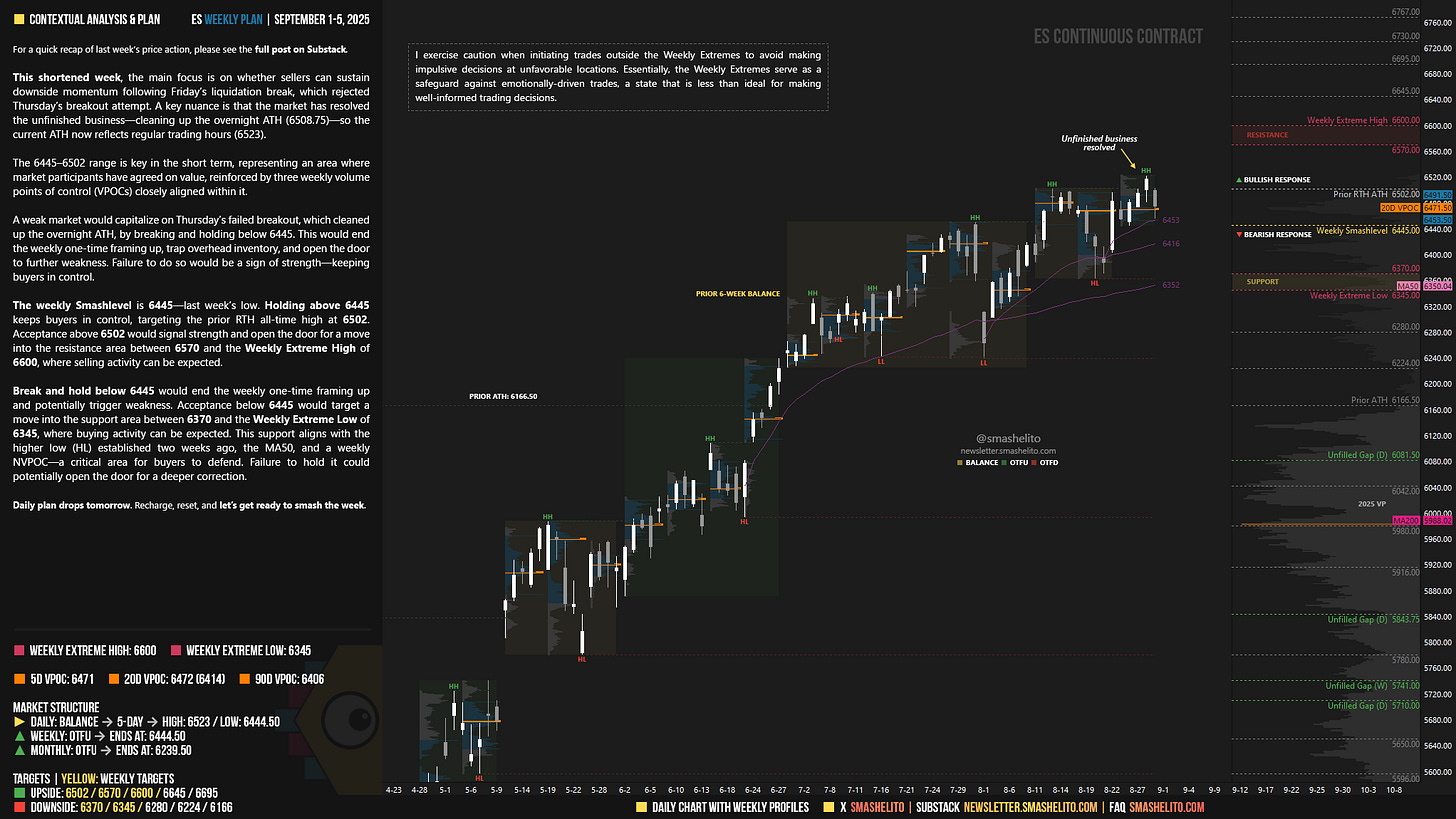
This shortened week, the main focus is on whether sellers can sustain downside momentum following Friday’s liquidation break, which rejected Thursday’s breakout attempt. A key nuance is that the market has resolved the unfinished business—cleaning up the overnight ATH (6508.75)—so the current ATH now reflects regular trading hours (6523).
The 6445–6502 range is key in the short term, representing an area where market participants have agreed on value, reinforced by three weekly volume points of control (VPOCs) closely aligned within it.
A weak market would capitalize on Thursday’s failed breakout, which cleaned up the overnight ATH, by breaking and holding below 6445. This would end the weekly one-time framing up, trap overhead inventory, and open the door to further weakness. Failure to do so would be a sign of strength—keeping buyers in control.
The weekly Smashlevel is 6445—last week’s low. Holding above 6445 keeps buyers in control, targeting the prior RTH all-time high at 6502. Acceptance above 6502 would signal strength and open the door for a move into the resistance area between 6570 and the Weekly Extreme High of 6600, where selling activity can be expected.
Break and hold below 6445 would end the weekly one-time framing up and potentially trigger weakness. Acceptance below 6445 would target a move into the support area between 6370 and the Weekly Extreme Low of 6345, where buying activity can be expected. This support aligns with the higher low (HL) established two weeks ago, the MA50, and a weekly NVPOC—a critical area for buyers to defend. Failure to hold it could potentially open the door for a deeper correction.
Key Levels of Interest
In the upcoming week, I will closely observe the behavior around 6445.
Holding above 6445 would target 6502 / 6570 / 6600* / 6645 / 6695
Break and hold below 6445 would target 6370 / 6345* / 6280 / 6224 / 6166
*Weekly Extremes. I exercise caution when initiating trades outside the Weekly Extremes to avoid making impulsive decisions at unfavorable locations. Essentially, the Weekly Extremes serve as a safeguard against emotionally-driven trades, a state that is less than ideal for making well-informed trading decisions.
Daily plan drops tomorrow. Recharge, reset, and let’s get ready to smash the week.


I love this. Learning everyday. Thank you.
These are great. Thank you! Do you provide any insights intra day?