
ES Weekly Plan | November 3-7, 2025
Recap, Market Context & Key Levels for the Week Ahead

Welcome to this week’s plan. Inside, you’ll find a quick review of last week’s price action, key economic events, market structure, context for the week ahead, and the levels I’ll be focusing on. Let’s get prepared.
Contents
Last Week in Review & Bonus Chart
Economic & Earnings Calendar
Market Structure
Contextual Analysis & Plan
Key Levels of Interest
Last Week in Review & Bonus Chart
Last week’s plan:

Heading into this week, the main focus was on whether buyers could sustain upside momentum following Friday’s true gap higher that broke out of the multi-week balance area. The market was one-time framing up across all time frames, signaling firm buyer control—until proven otherwise.
The key was to monitor for continuation—or lack thereof—as the auction attempted to transition from balance to imbalance. A strong response would involve maintaining acceptance above the prior balance area and supporting trending behavior in search of value, while a weak response—filling Friday’s gap and accepting back within last week’s value area—would have indicated a failed breakout, with the 6670 HVN serving as a potential downside magnet.
Monday kicked off the week with both the overnight and RTH sessions gapping higher—the former a rather rare occurrence. The shift from balance to imbalance was on full display, as the RTH session saw continued upside momentum. An upward spike was formed in the closing session, making its base at 6899 a level of interest heading into Tuesday.
Tuesday’s session continued the pattern of higher highs and higher lows on the daily time frame, finding buyers near Monday’s spike base at 6899 and accepting Monday’s closing strength. When the daily is one-time framing up, it is in a trending environment, so it’s generally best to wait for it to end before expecting rotational activity.
On Wednesday, we had the FOMC meeting, and sellers ended the daily one-time framing up, bringing the market back into a 3-day balance area. This balance was considered a bullish consolidation—until proven otherwise—because the market was building value above the prior multi-week balance area and Monday’s weekly gap, suggesting acceptance. Only filling Monday’s gap and accepting back within the previous week’s range could meaningfully shift the tone. The session also formed a poor high, which served as a reference to carry forward.
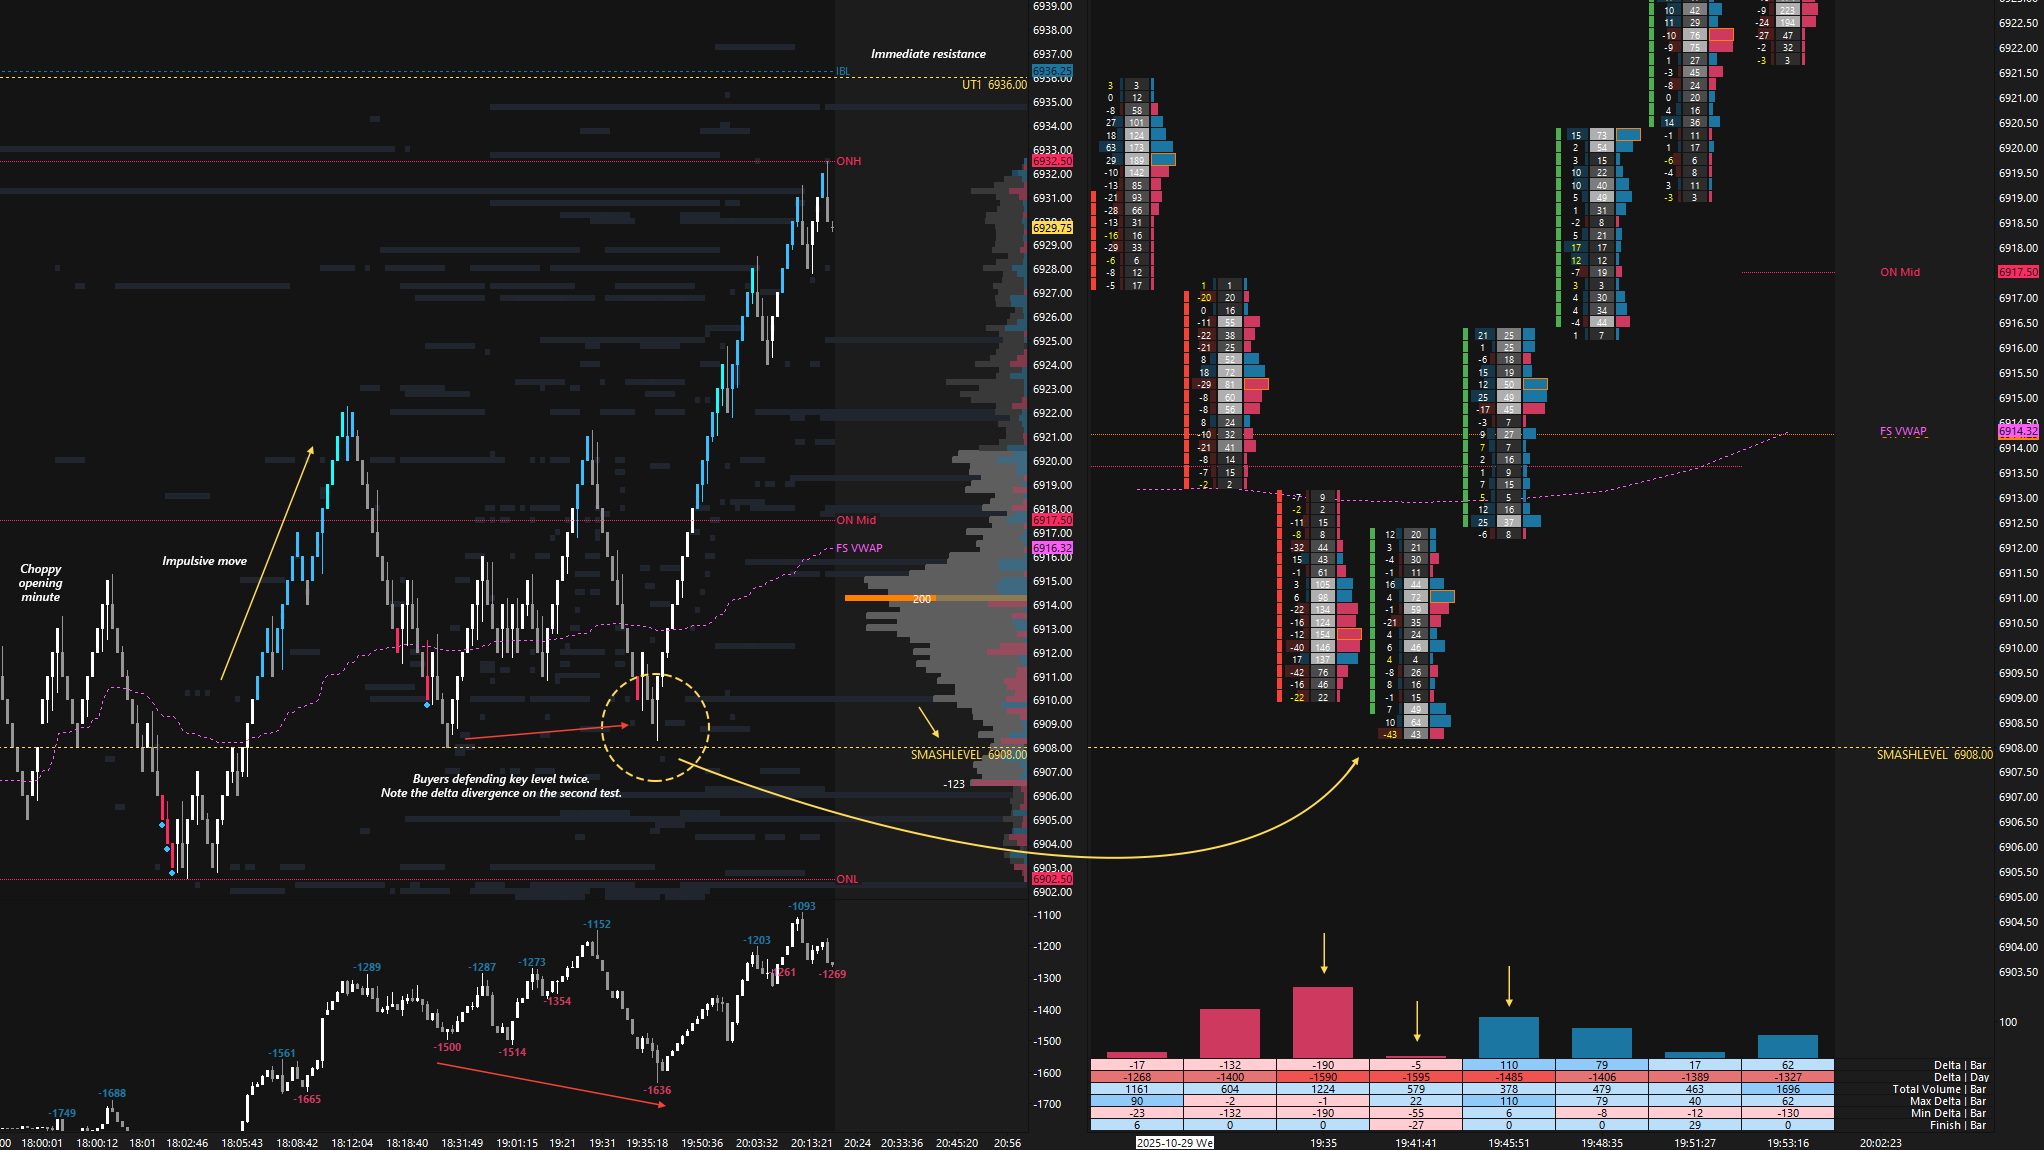
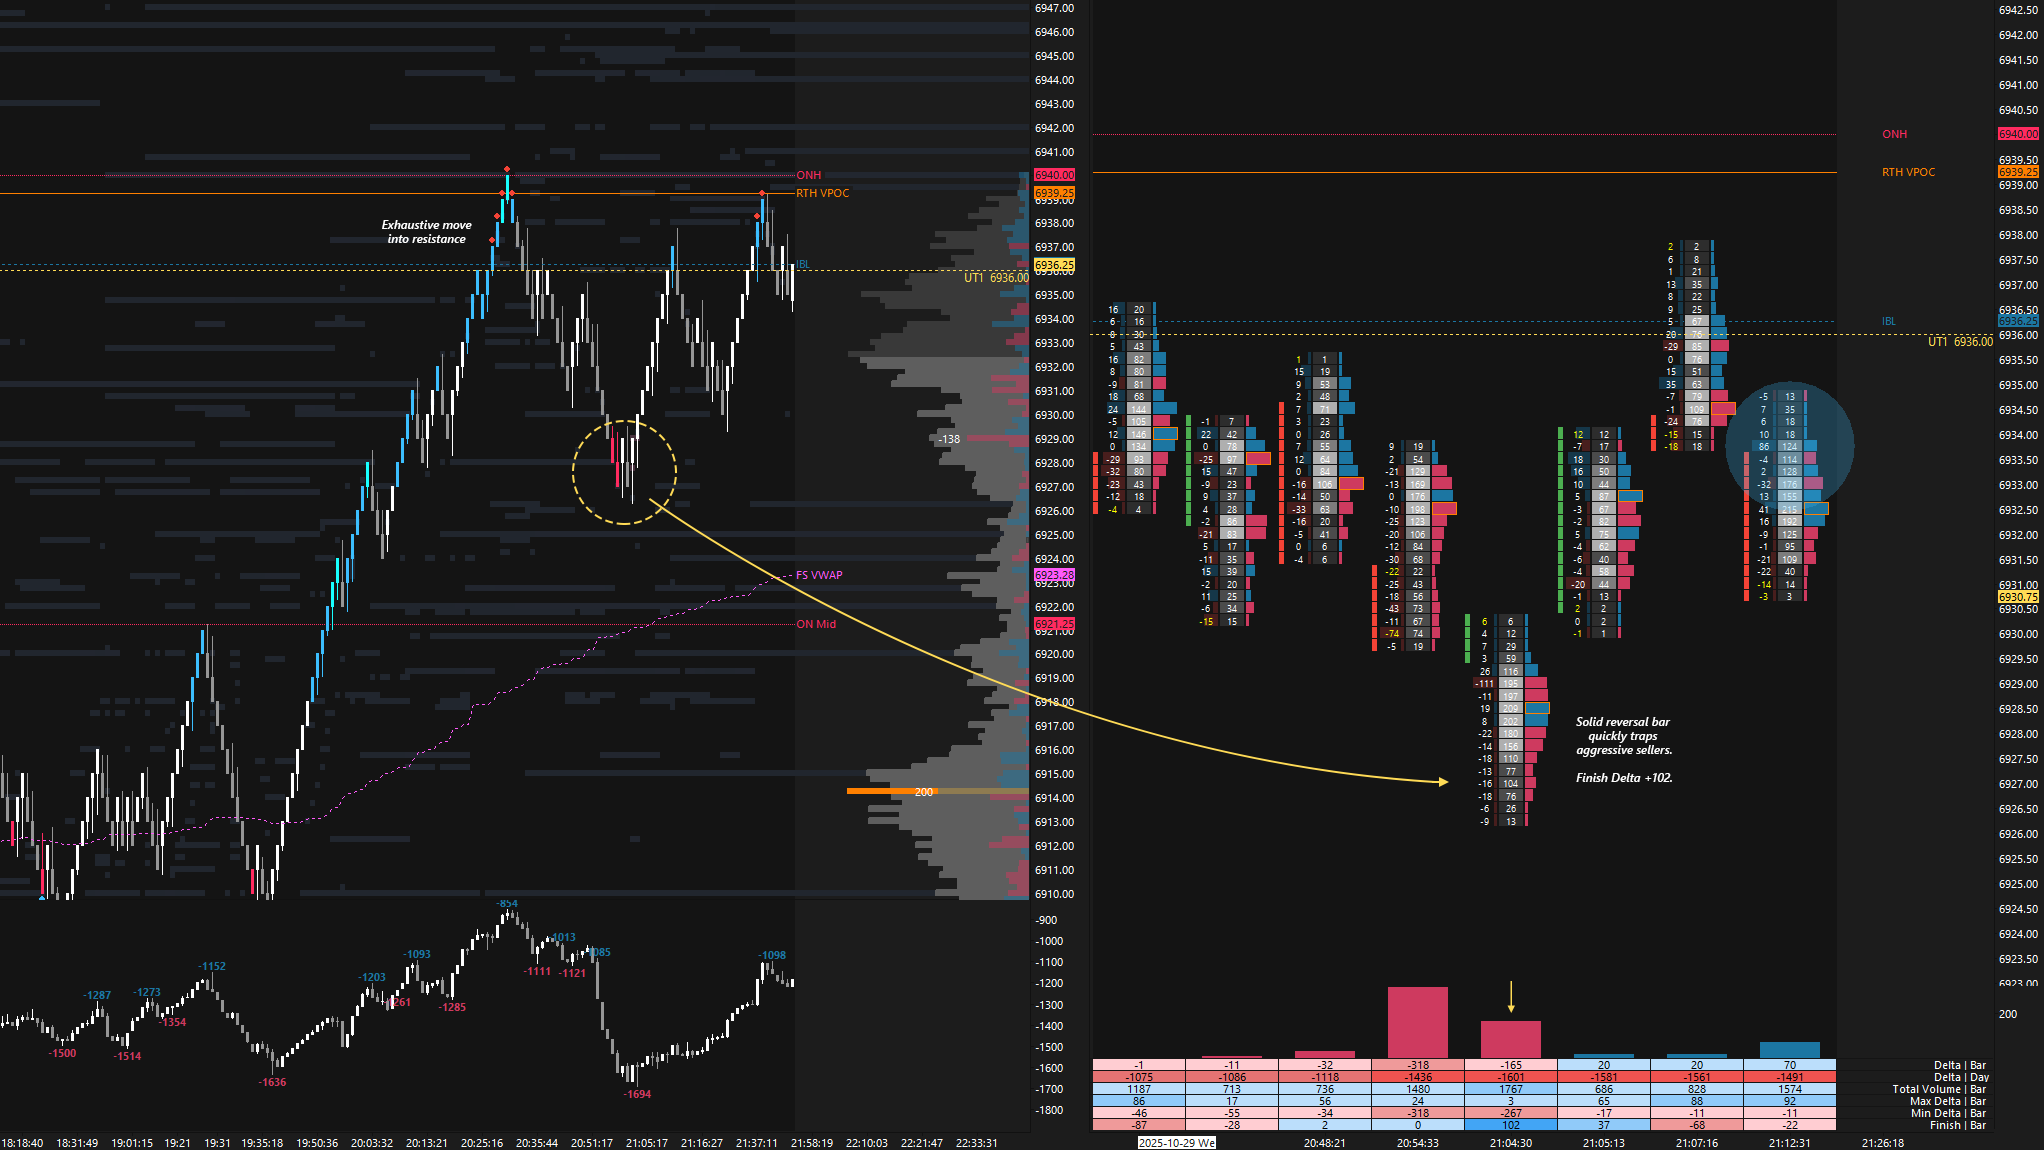
Thursday’s session provided countless opportunities, especially for those monitoring order flow around the key levels outlined in the daily plan. The Smashlevel at 6908, marking the pivot, offered an excellent long setup early overnight on a notable delta divergence (see Figure 1).
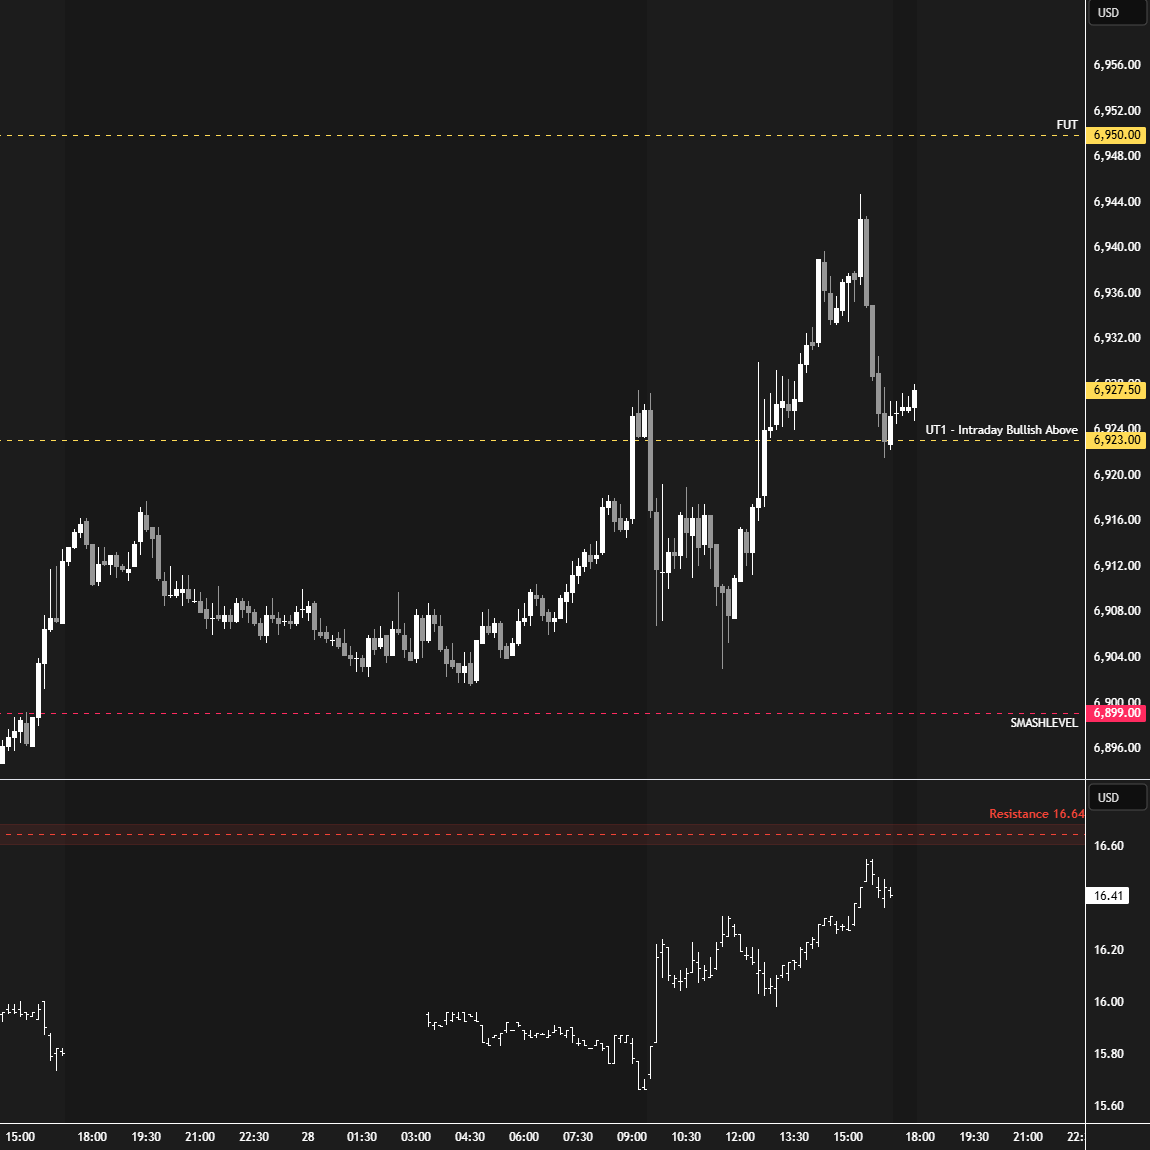
Holding 6908 quickly led to a test of UT1 at 6936, completing a 28-handle move. The move into 6936 was exhaustive, with no notable pullback, so the subsequent pullback was unsurprising. Buyers stepped in, forming a strong reversal bar (see Figure 2), which triggered a continuation higher, breaking 6936 and printing a new all-time high at 6953.75 in the process. Carry forward this overnight ATH as unfinished business as it remains untested in during RTH.
The 6908 level was breached pre-open, and sellers managed to defend it during the RTH session, resulting in a continuation lower that broke the 3-day balance low and partially filled Monday’s weekly gap, closing out the session at its lows.
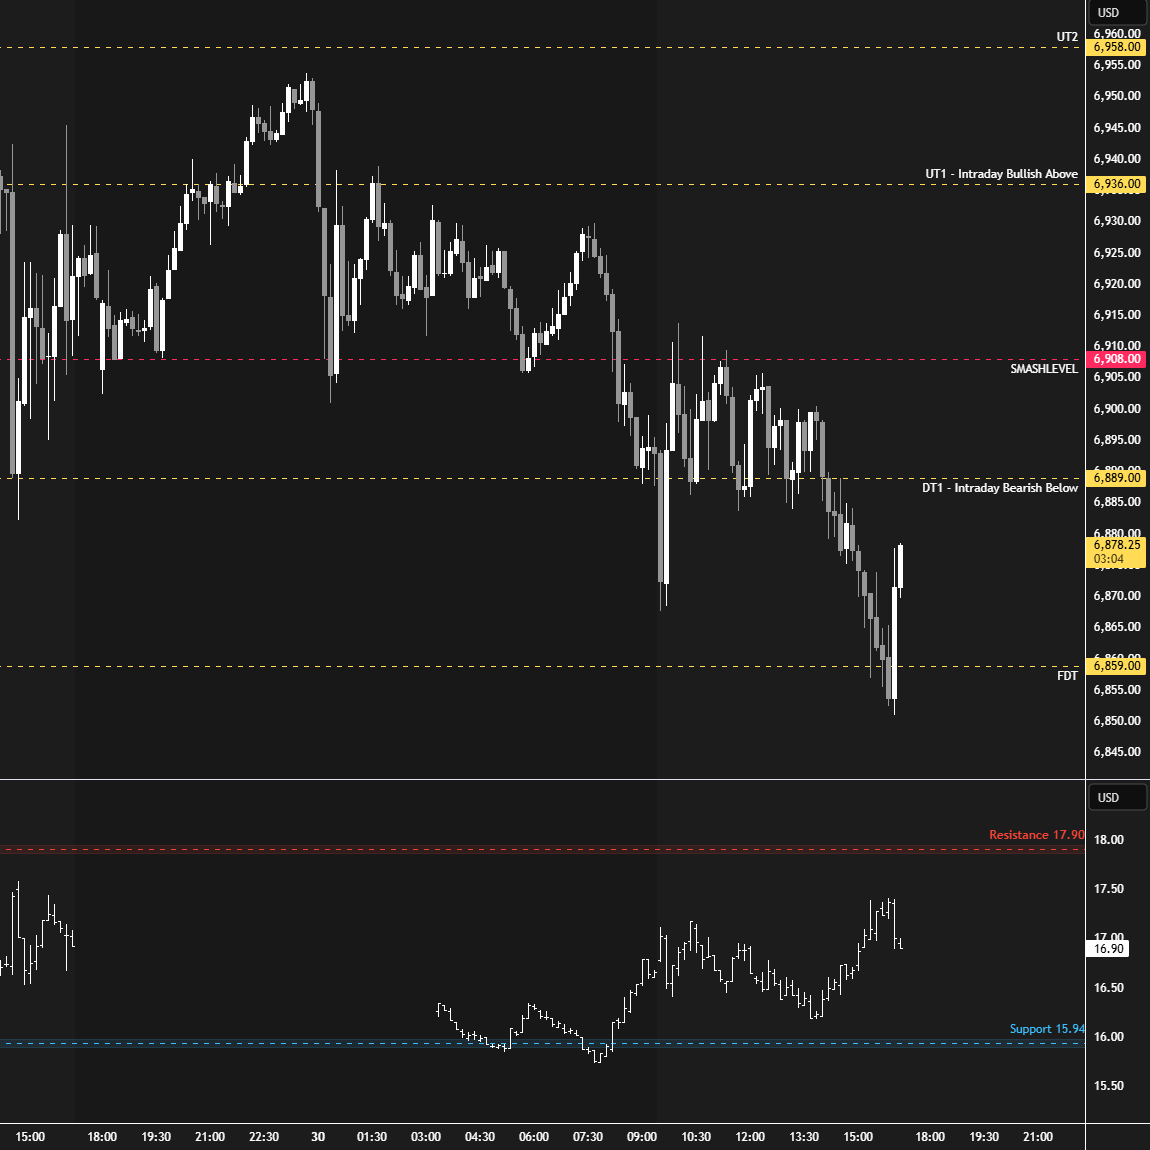
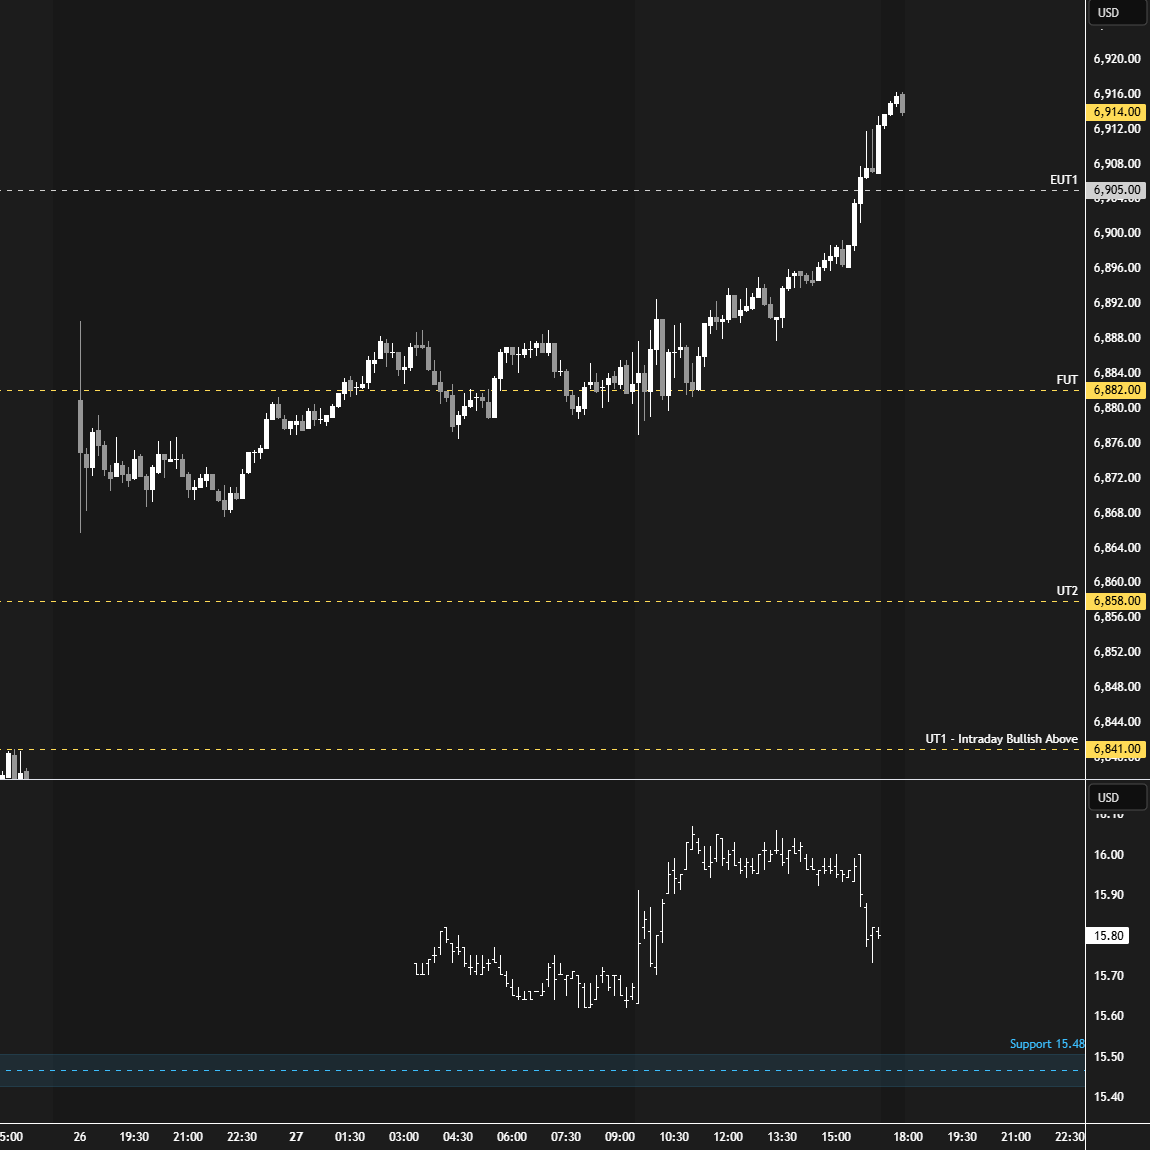
Thursday’s closing weakness was immediately retraced after-hours following the AAPL and AMZN earnings, resulting in Friday’s overnight session opening above its initial upside target at 6888 (UT1). The final upside target at 6908 (FUT) was already tagged pre-open. Note the confluence of sellers stepping in and the VIX tagging its support level at 15.98 (LOD: 15.96).
Sellers were in control of the auction during the RTH session, continuing to fill Monday’s gap. After coming a few ticks shy of completely filling the gap, buyers stepped in for a solid 50-handle rally.
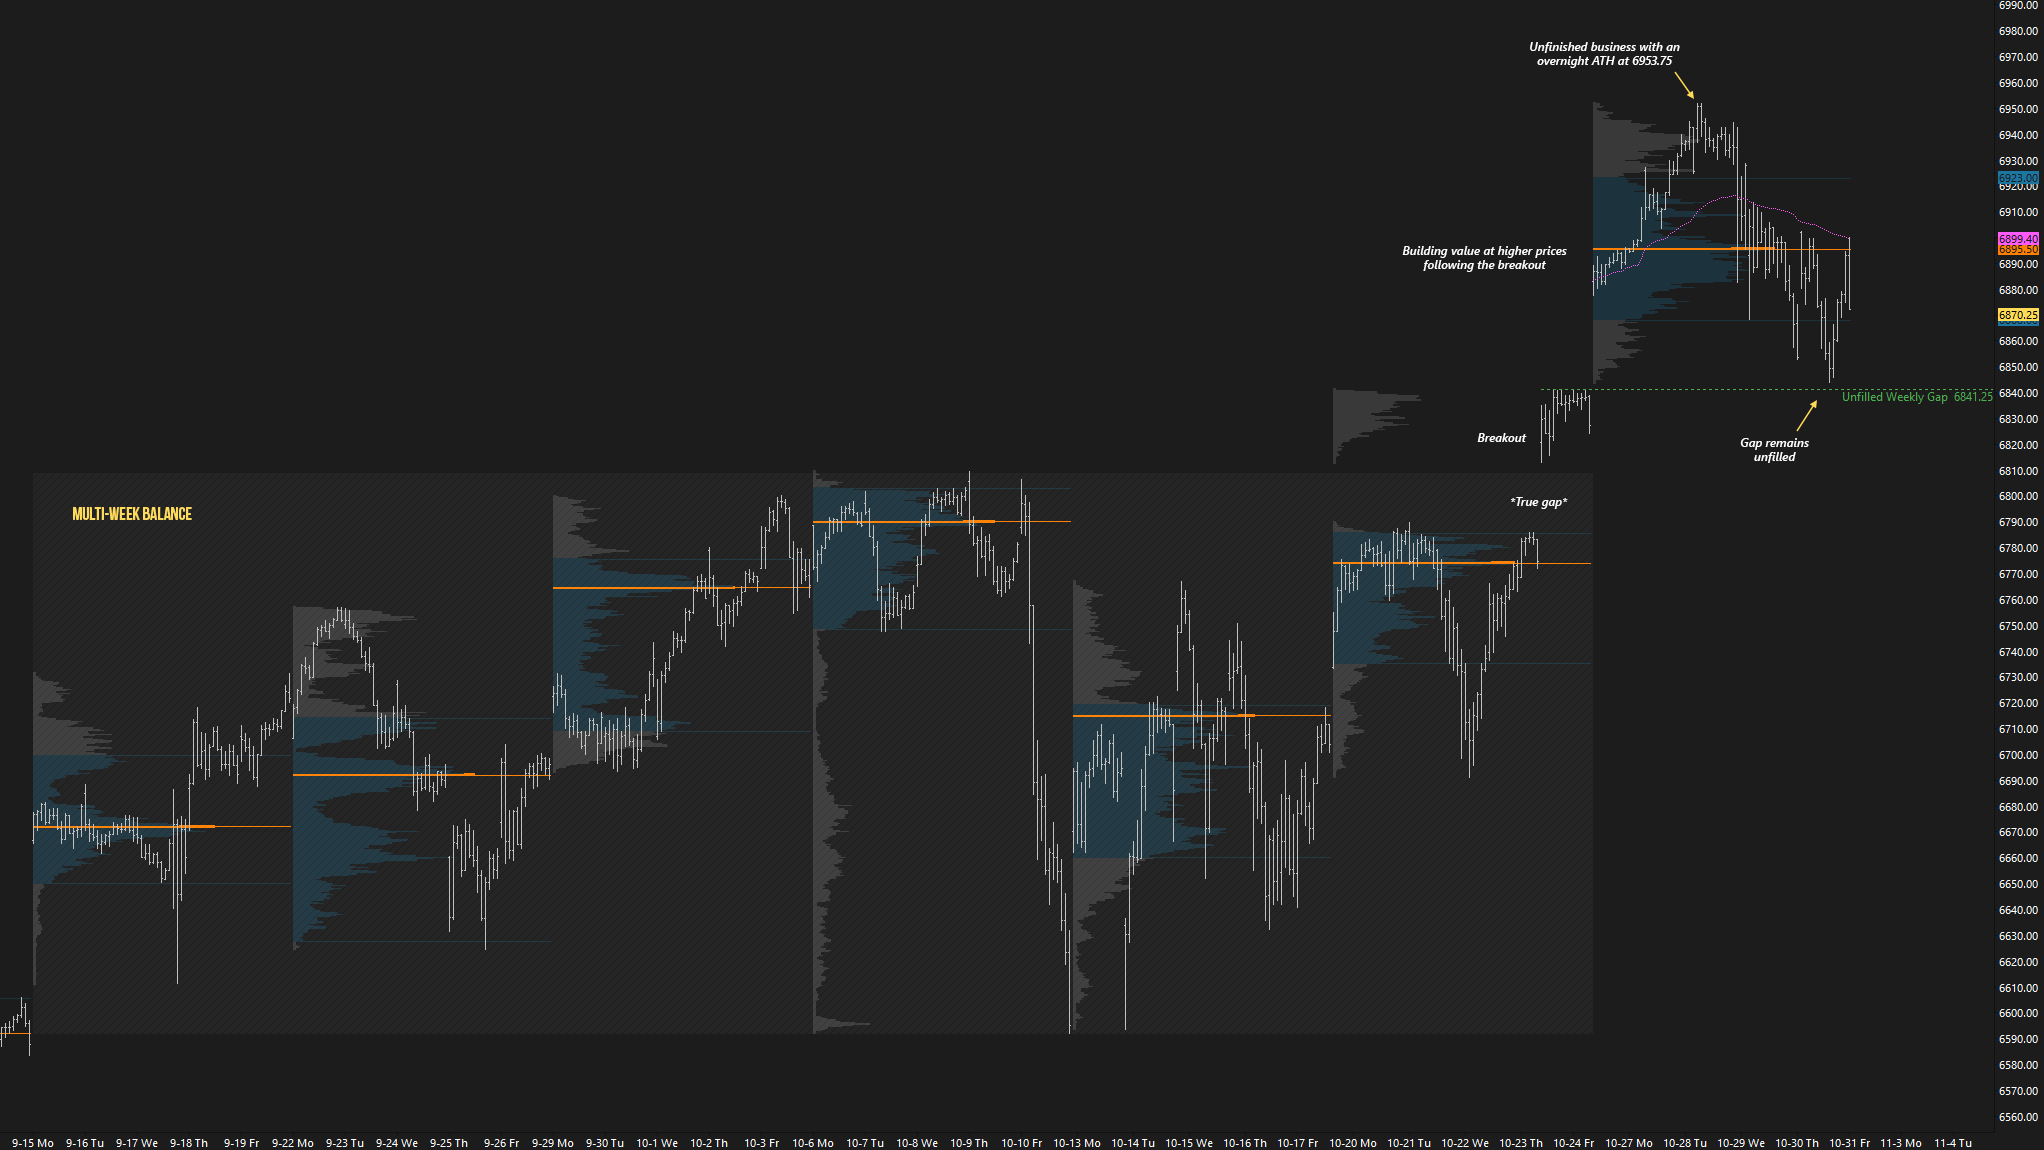
We are in an interesting situation now, where the monthly and weekly time frames are one-time framing up, while the daily is one-time framing down. Sellers are in short-term control, forming lower highs and lower lows; however, Monday’s gap failed to fill, which is not a sign of stronger selling. As discussed throughout the week, a meaningful shift in tone would require filling the gap and achieving acceptance back within the previous week’s range. Even then, the next objective would be to establish acceptance back within the prior multi-week balance area, which would require filling the true gap from last week.
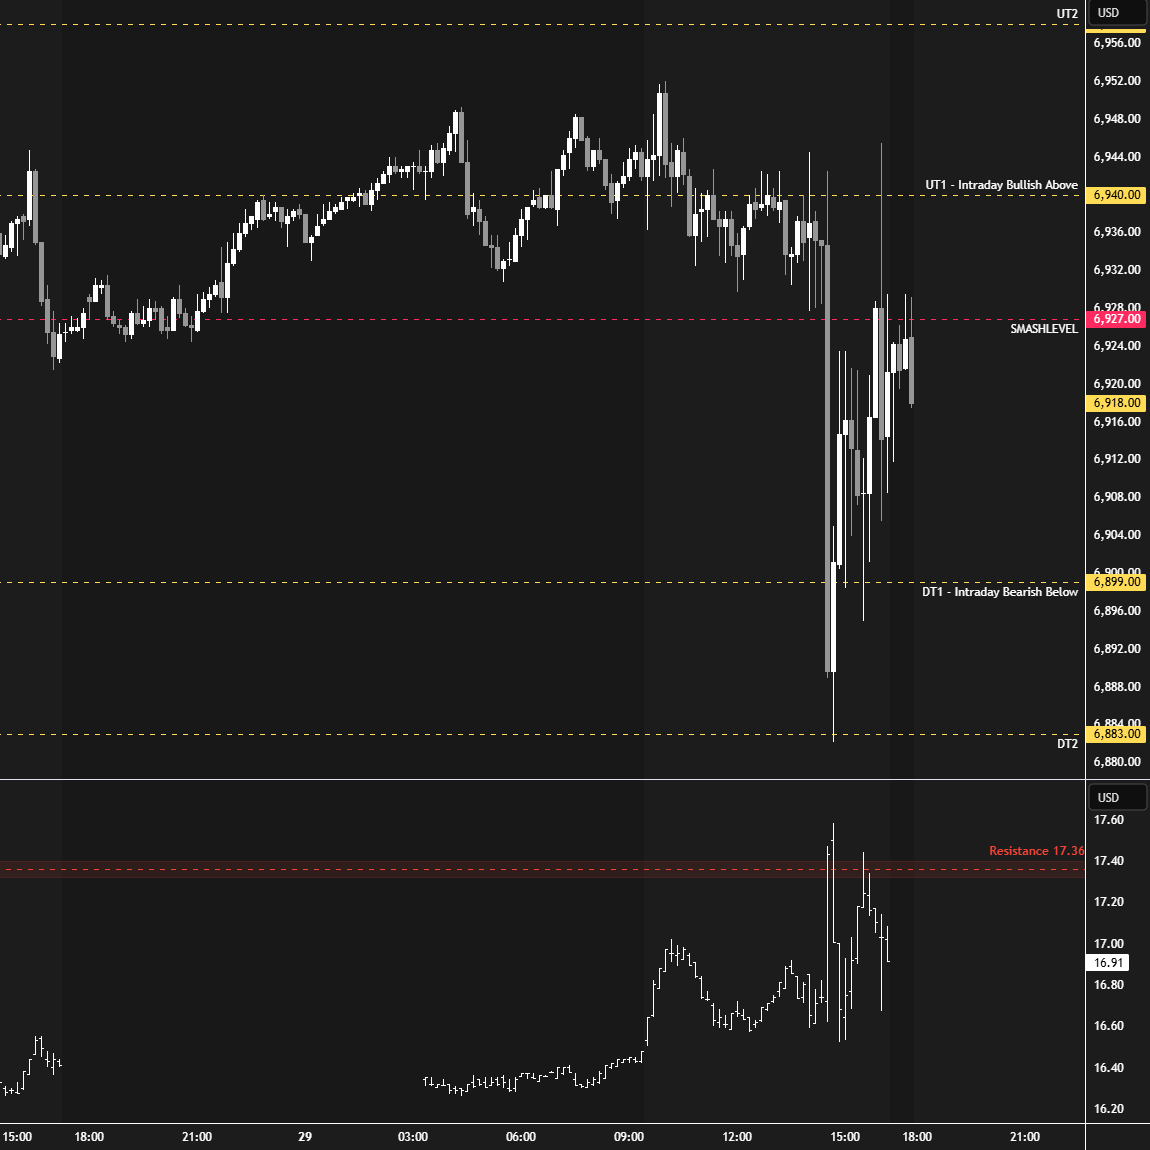
The key question is whether this pullback is simply a technical fill before a continuation higher, or the start of a failed multi-week balance breakout (see Figure 3). The unfinished business at the overnight ATH of 6953.75 suggests the former, but we navigate day by day, keeping an open mind to every scenario.
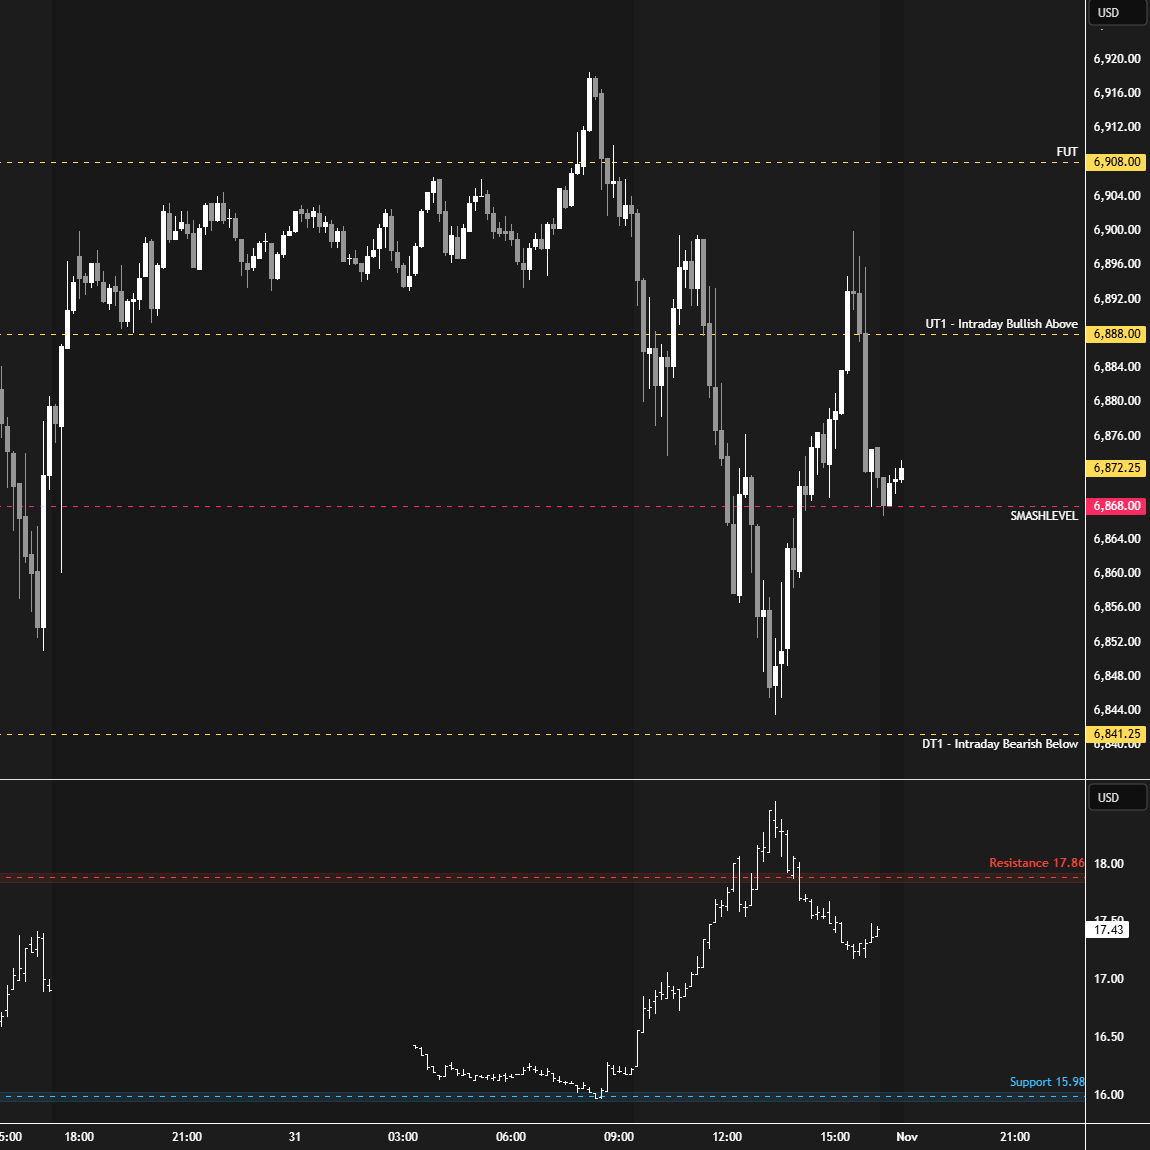
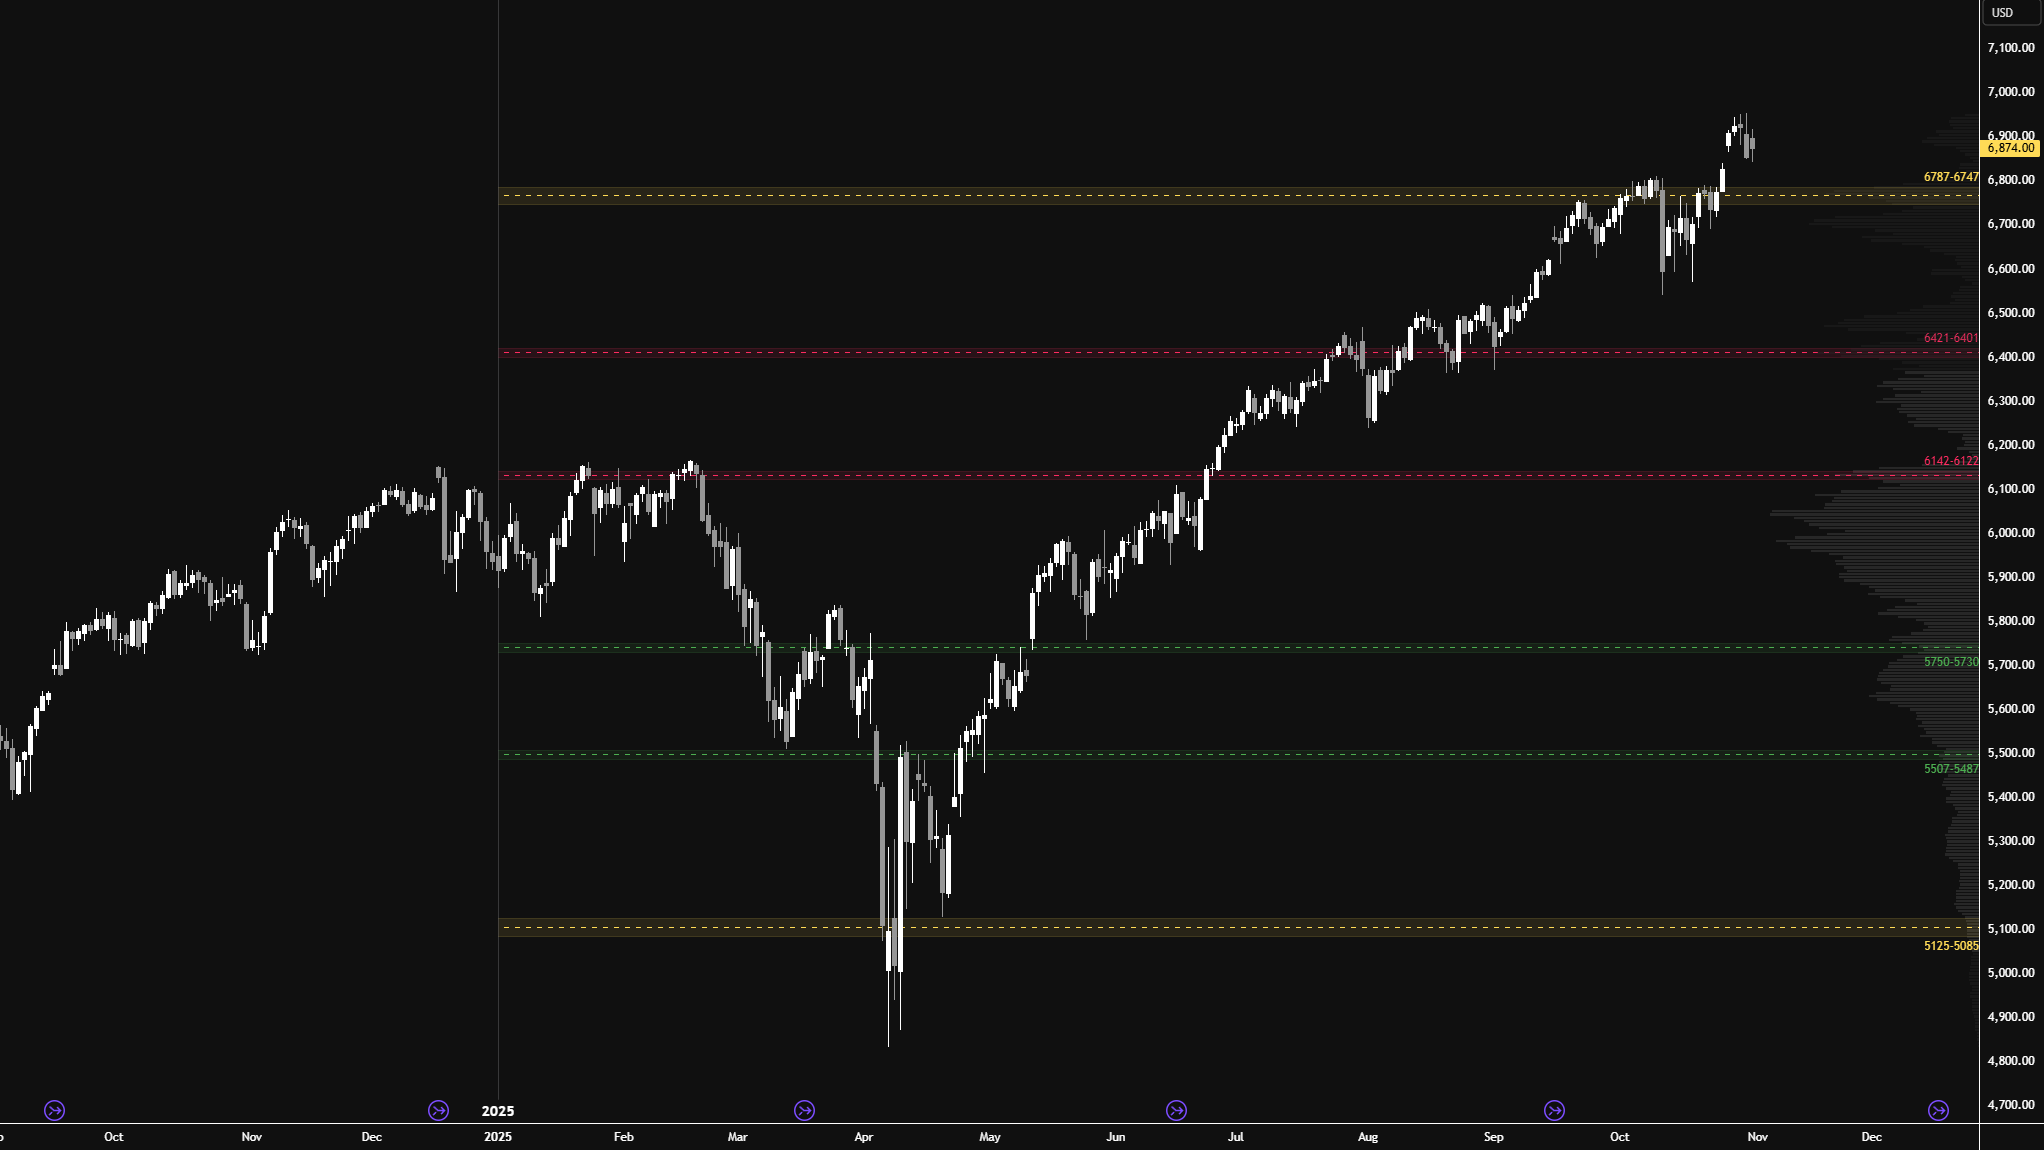
I will continue to include the HTF chart from a good friend of mine (see Figure 4), featuring levels generated by one of his models at the start of 2025. As you can see, this year’s price action has respected these levels remarkably well.
There’s not much to add here: as long as the market continues to build value above the 6747–6787 area, there is potential for further upside pressure. The door to weakness would only open with acceptance back below this area, so if you’re bearish, remain cautious until that happens.
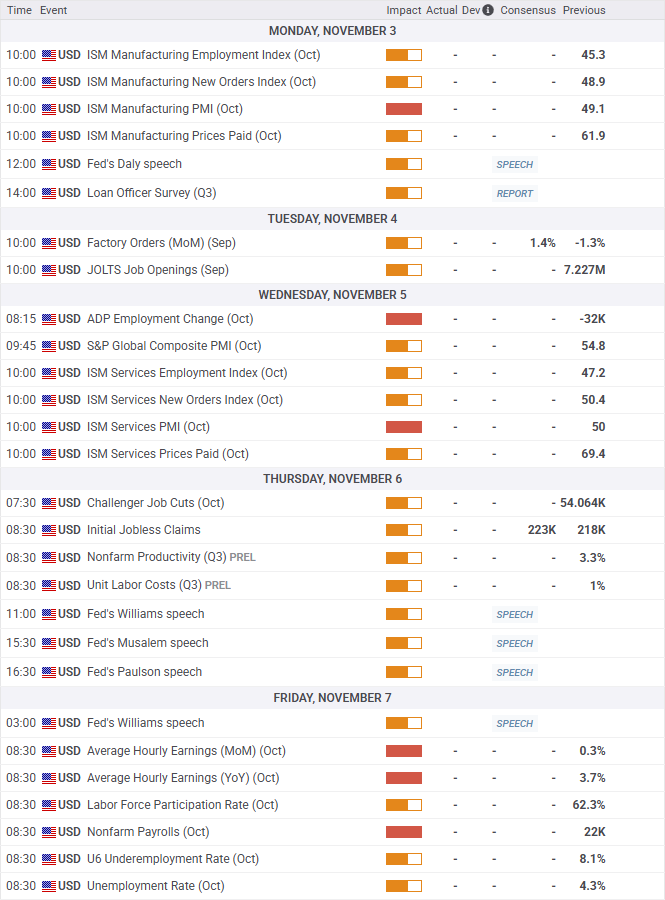
Economic & Earnings Calendar

Market Structure
🟥 Daily: OTFD → Ends at: 6902.50
🟩 Weekly: OTFU → Ends at: 6843.50
🟩 Monthly: OTFU → Ends at: 6591.75
Balance: A market condition where price consolidates within a defined range, reflecting indecision as the market awaits more market-generated information. We apply balance guidelines—favoring fade trades at range extremes (highs/lows) and preparing for breakout setups if balance resolves.
One-Time Framing Up (OTFU): A market condition where each subsequent bar forms a higher low, signaling a strong upward trend.
One-Time Framing Down (OTFD): A market condition where each subsequent bar forms a lower high, signaling a strong downward trend.
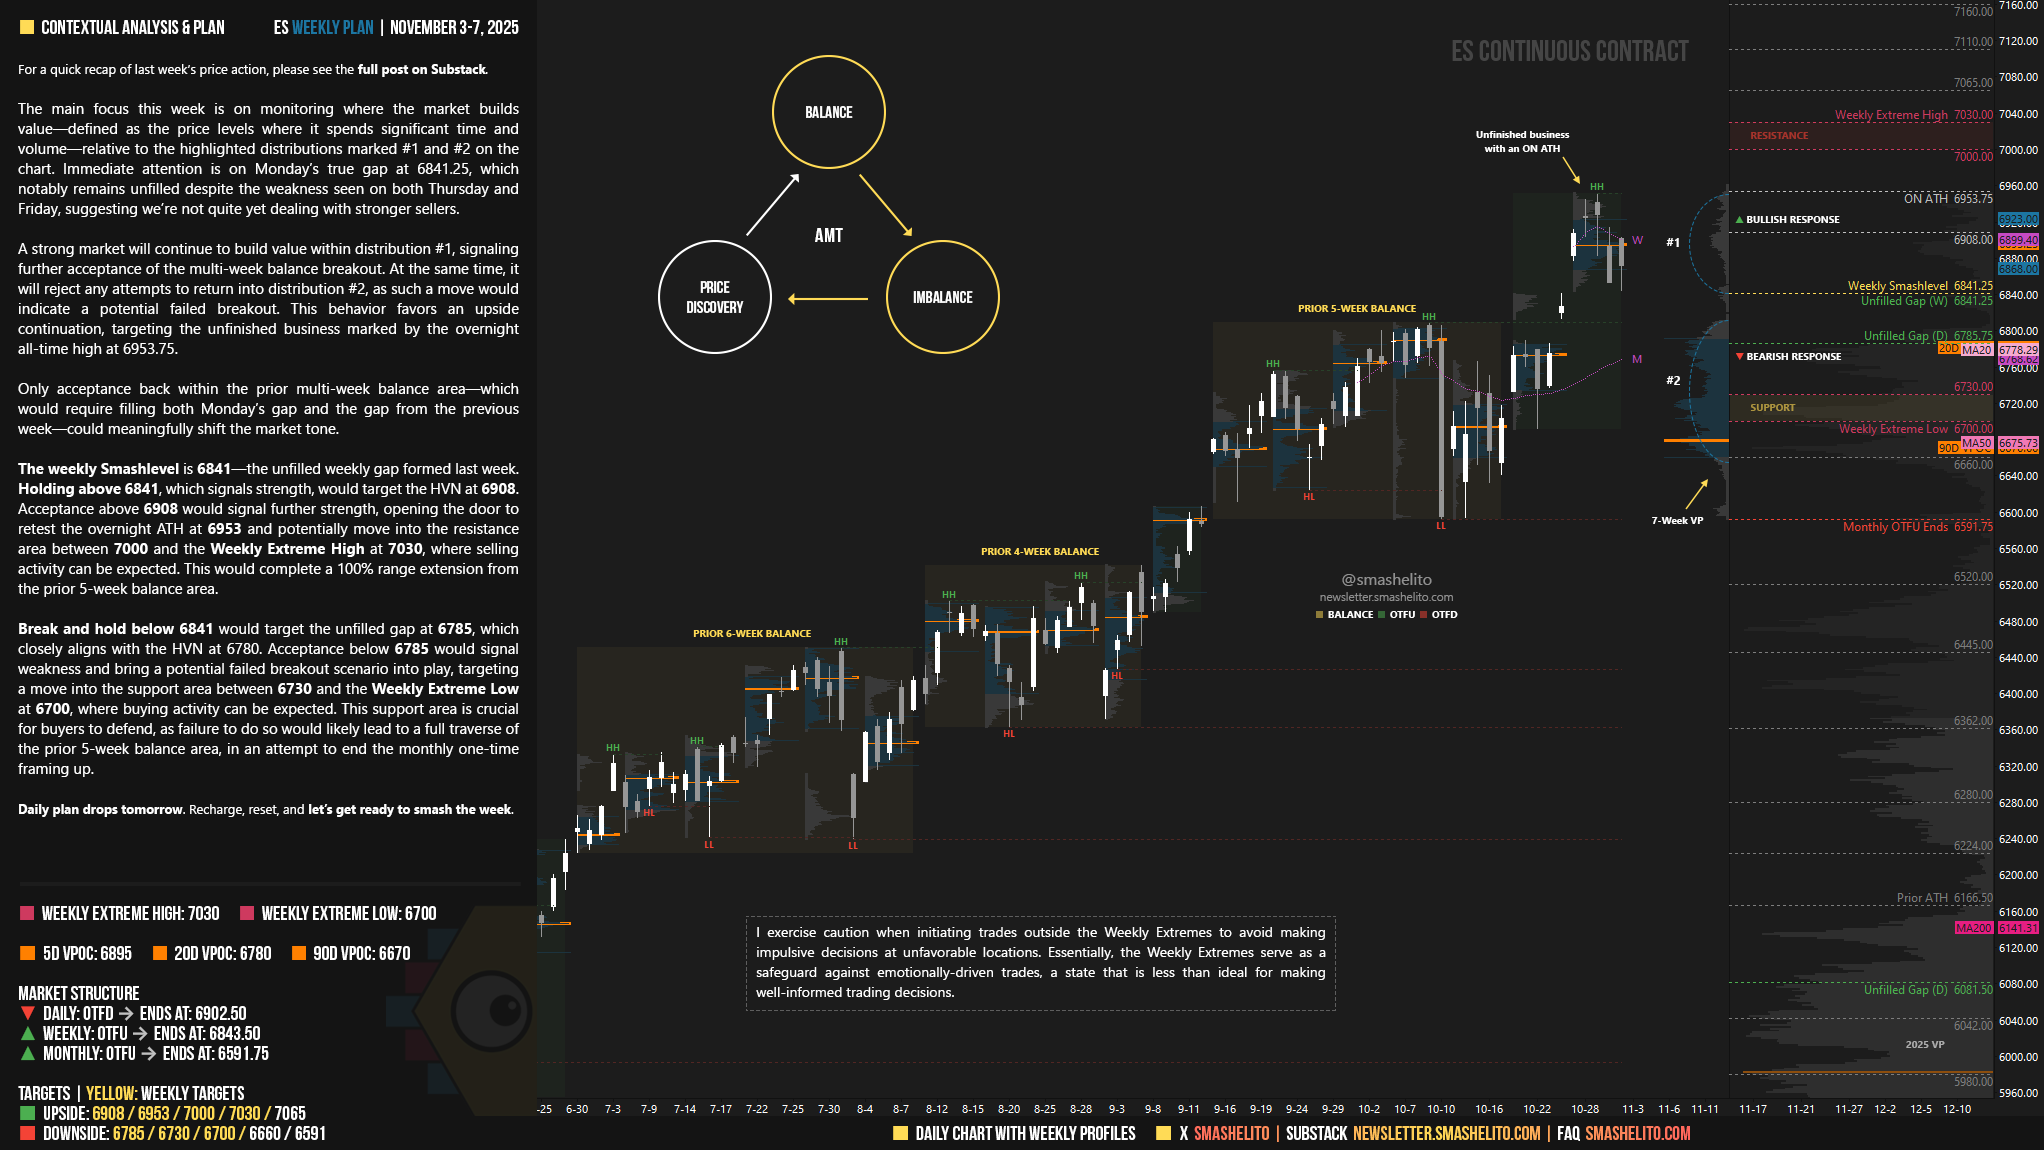
Contextual Analysis & Plan
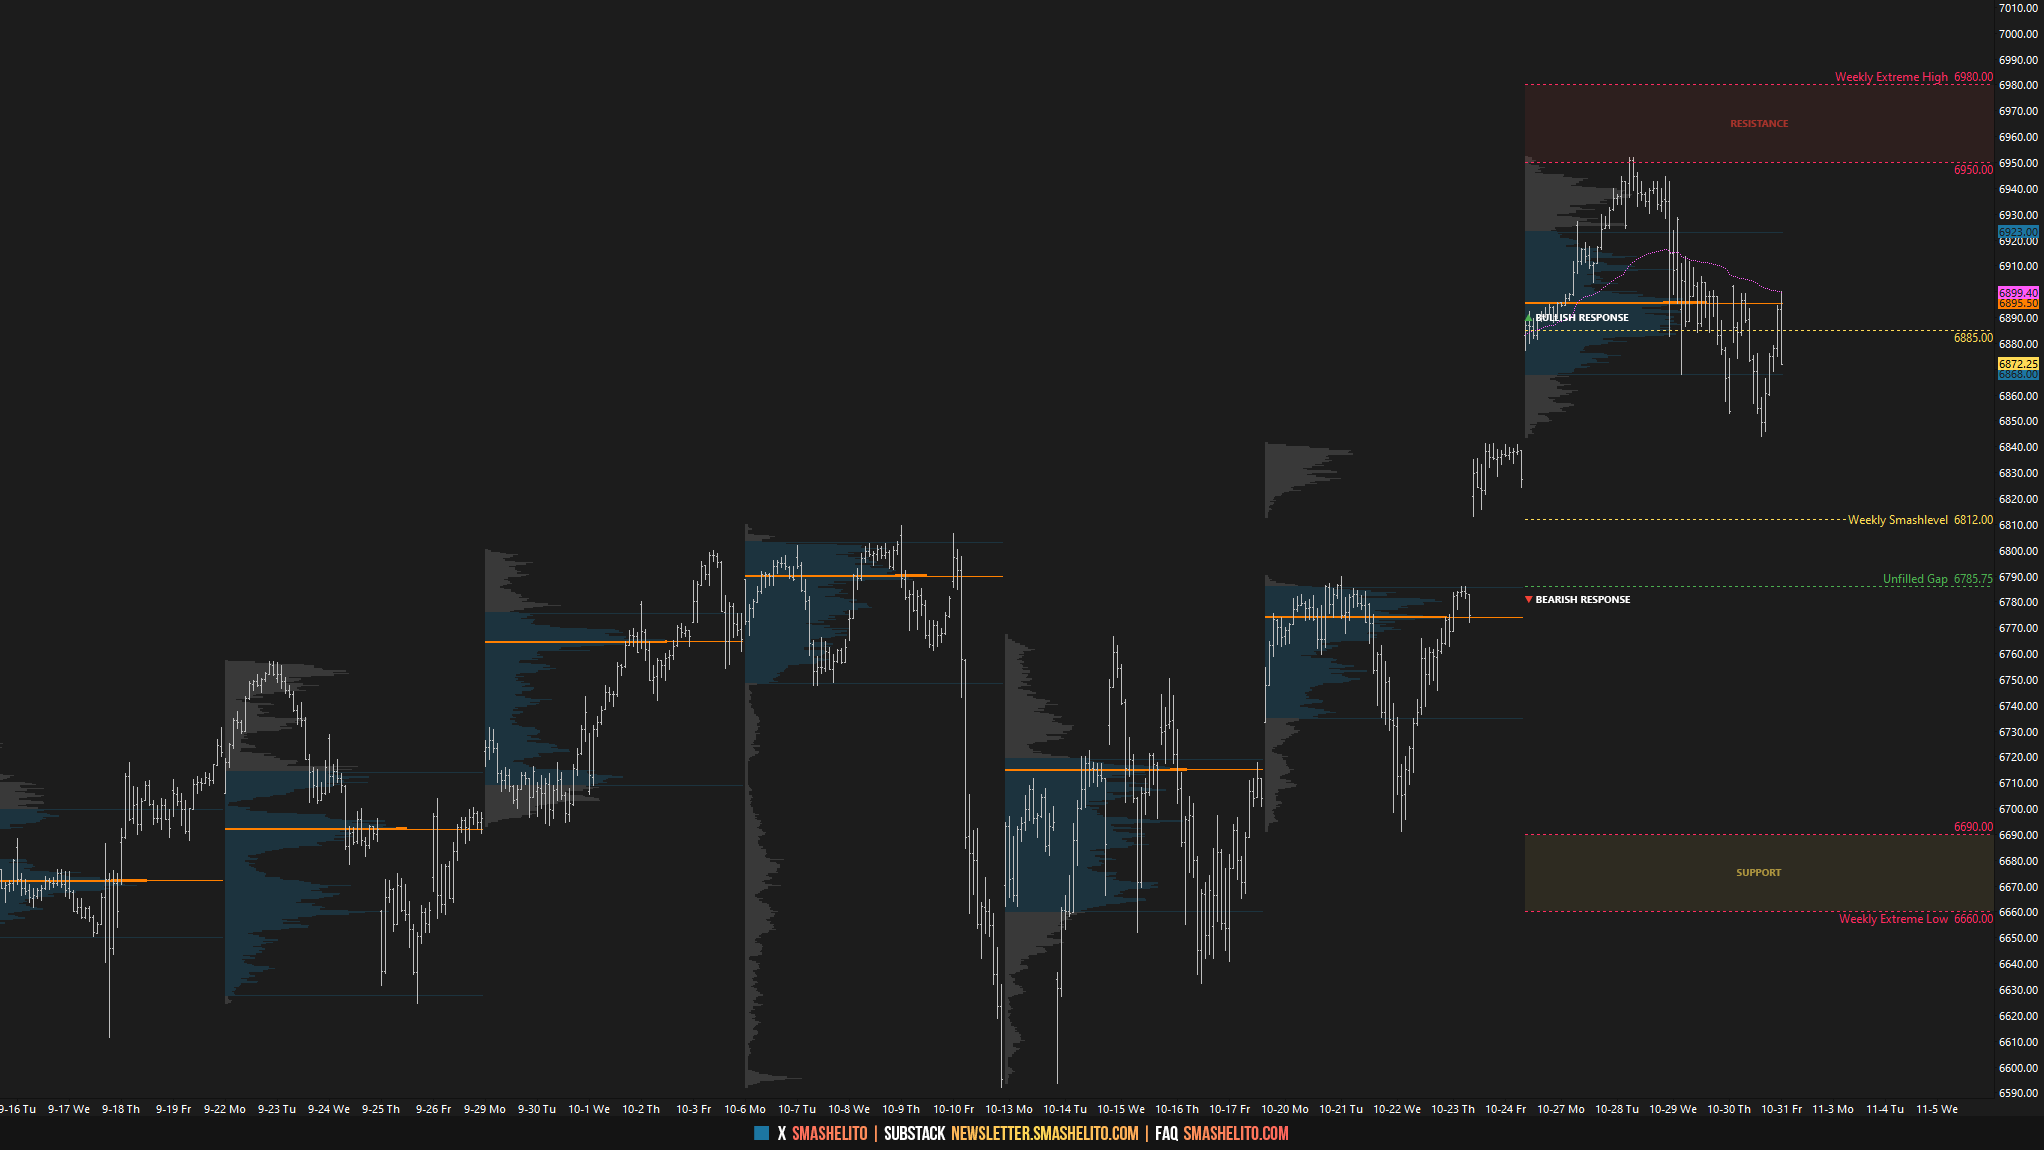
The main focus this week is on monitoring where the market builds value—defined as the price levels where it spends significant time and volume—relative to the highlighted distributions marked #1 and #2 on the chart. Immediate attention is on Monday’s true gap at 6841.25, which notably remains unfilled despite the weakness seen on both Thursday and Friday, suggesting we’re not quite yet dealing with stronger sellers.
A strong market will continue to build value within distribution #1, signaling further acceptance of the multi-week balance breakout. At the same time, it will reject any attempts to return into distribution #2, as such a move would indicate a potential failed breakout. This behavior favors an upside continuation, targeting the unfinished business marked by the overnight all-time high at 6953.75.
Only acceptance back within the prior multi-week balance area—which would require filling both Monday’s gap and the gap from the previous week—could meaningfully shift the market tone.
The weekly Smashlevel is 6841—the unfilled weekly gap formed last week. Holding above 6841, which signals strength, would target the HVN at 6908. Acceptance above 6908 would signal further strength, opening the door to retest the overnight ATH at 6953 and potentially move into the resistance area between 7000 and the Weekly Extreme High at 7030, where selling activity can be expected. This would complete a 100% range extension from the prior 5-week balance area.
Break and hold below 6841 would target the unfilled gap at 6785, which closely aligns with the HVN at 6780. Acceptance below 6785 would signal weakness and bring a potential failed breakout scenario into play, targeting a move into the support area between 6730 and the Weekly Extreme Low at 6700, where buying activity can be expected. This support area is crucial for buyers to defend, as failure to do so would likely lead to a full traverse of the prior 5-week balance area, in an attempt to end the monthly one-time framing up.
Key Levels of Interest
In the upcoming week, I will closely observe the behavior around 6841.
Holding above 6841 would target 6908 / 6953 / 7000 / 7030* / 7065
Break and hold below 6841 would target 6785 / 6730 / 6700* / 6660 / 6591
*Weekly Extremes. I exercise caution when initiating trades outside the Weekly Extremes to avoid making impulsive decisions at unfavorable locations. Essentially, the Weekly Extremes serve as a safeguard against emotionally-driven trades, a state that is less than ideal for making well-informed trading decisions.
Daily plan drops tomorrow. Recharge, reset, and let’s get ready to smash the week.
Thank you GOAT!
Thanks Smash!💥