
ES Daily Plan | October 30, 2025
Market Context & Key Levels for the Day Ahead

— For new subscribers
The yellow levels highlighted at the bottom left of the chart are the primary intraday levels I focus on. To avoid impulsive decisions at poor trade locations, I follow a simple but effective rule: exercise caution when initiating trades outside of these yellow levels.
This means I’m cautious about chasing longs above the Final Upside Target (FUT) and shorts below the Final Downside Target (FDT). It’s important to understand that not chasing does not imply initiating a trade in the opposite direction — discipline over impulse.
Be sure to review the Weekly Plan for a broader perspective, key levels, and market expectations for the week ahead.

Price can have three relationships to value: it can be above, below, or within it. “Responsive“ behavior aligns with expectations, while “Initiating“ behavior deviates from expectations.
Buying below value is expected and thus considered responsive activity.
Buying above value is unexpected and thus considered initiating activity.
Selling above value is expected and thus considered responsive activity.
Selling below value is unexpected and thus considered initiating activity.
For a more comprehensive understanding of these principles within the framework of Auction Market Theory (AMT), refer to CBOT - A Six-Part Study Guide to Market Profile.
Contextual Analysis & Plan
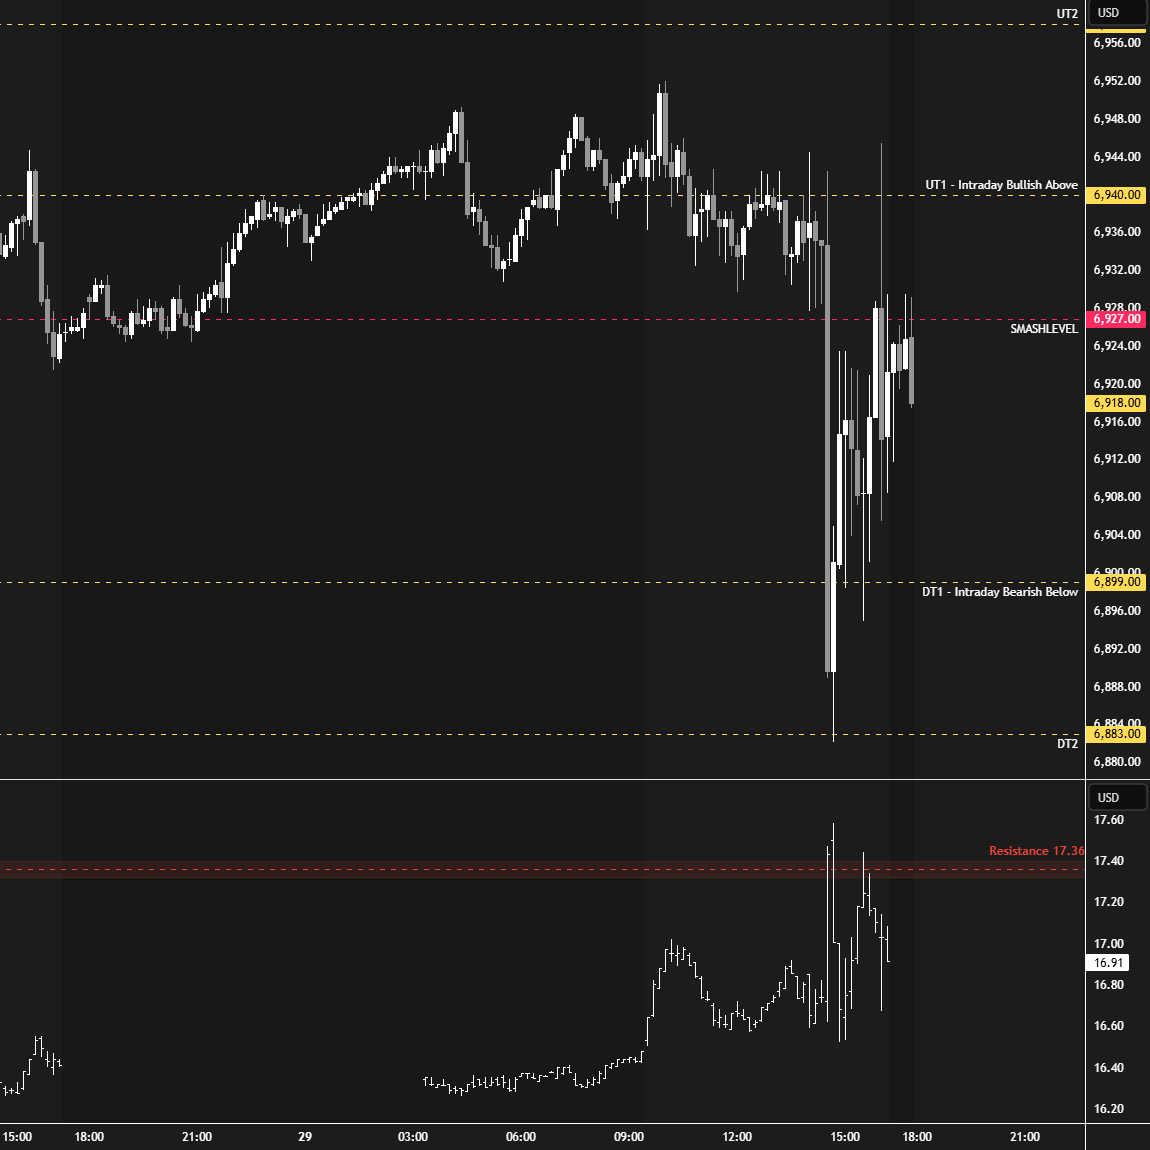
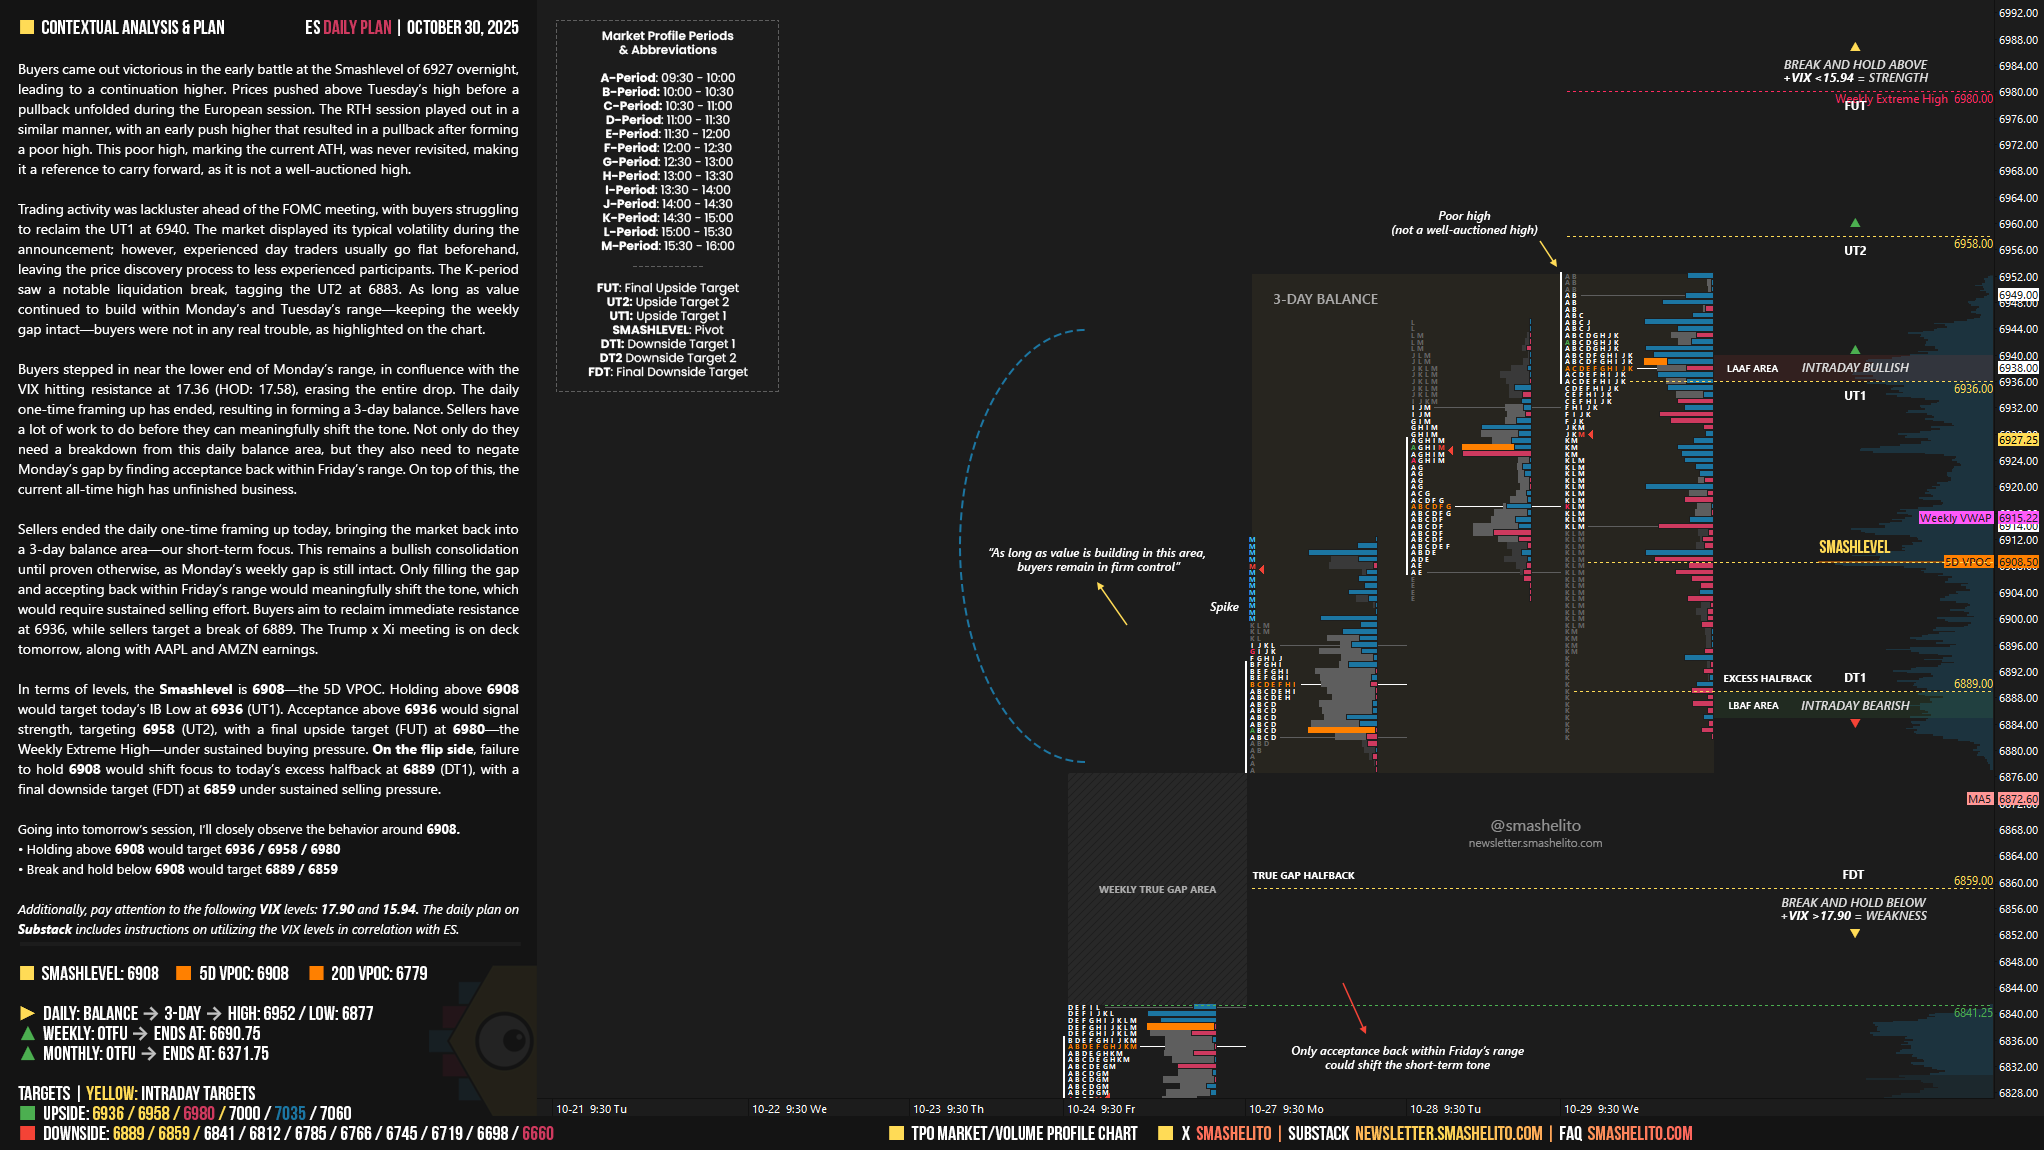
Buyers came out victorious in the early battle at the Smashlevel of 6927 overnight, leading to a continuation higher. Prices pushed above Tuesday’s high before a pullback unfolded during the European session. The RTH session played out in a similar manner, with an early push higher that resulted in a pullback after forming a poor high. This poor high, marking the current ATH, was never revisited, making it a reference to carry forward, as it is not a well-auctioned high.
Trading activity was lackluster ahead of the FOMC meeting, with buyers struggling to reclaim the UT1 at 6940. The market displayed its typical volatility during the announcement; however, experienced day traders usually go flat beforehand, leaving the price discovery process to less experienced participants. The K-period saw a notable liquidation break, tagging the UT2 at 6883. As long as value continued to build within Monday’s and Tuesday’s range—keeping the weekly gap intact—buyers were not in any real trouble, as highlighted on the chart.
Buyers stepped in near the lower end of Monday’s range, in confluence with the VIX hitting resistance at 17.36 (HOD: 17.58), erasing the entire drop. The daily one-time framing up has ended, resulting in forming a 3-day balance. Sellers have a lot of work to do before they can meaningfully shift the tone. Not only do they need a breakdown from this daily balance area, but they also need to negate Monday’s gap by finding acceptance back within Friday’s range. On top of this, the current all-time high has unfinished business.
Sellers ended the daily one-time framing up today, bringing the market back into a 3-day balance area—our short-term focus. This remains a bullish consolidation until proven otherwise, as Monday’s weekly gap is still intact.
Only filling the gap and accepting back within Friday’s range would meaningfully shift the tone, which would require sustained selling effort.
Buyers aim to reclaim immediate resistance at 6936, while sellers target a break of 6889. The Trump x Xi meeting is on deck tomorrow, along with AAPL and AMZN earnings.
In terms of levels, the Smashlevel is 6908—the 5D VPOC. Holding above 6908 would target today’s IB Low at 6936 (UT1). Acceptance above 6936 would signal strength, targeting 6958 (UT2), with a final upside target (FUT) at 6980—the Weekly Extreme High—under sustained buying pressure.
On the flip side, failure to hold 6908 would shift focus to today’s excess halfback at 6889 (DT1), with a final downside target (FDT) at 6859 under sustained selling pressure.
Levels of Interest
Going into tomorrow’s session, I’ll closely observe the behavior around 6908.
Holding above 6908 would target 6936 / 6958 / 6980
Break and hold below 6908 would target 6889 / 6859
Additionally, pay attention to the following VIX levels: 17.90 and 15.94. These levels can provide confirmation of strength or weakness.
Break and hold above 6980 with VIX below 15.94 would confirm strength.
Break and hold below 6859 with VIX above 17.90 would confirm weakness.
Overall, it's important to exercise caution when trading outside of the highlighted yellow levels. A non-cooperative VIX may suggest possible reversals i.e trade setups.
Thanks as always!
Simply amazing, can't believe how accurate your Smashlevels are.