
ES Weekly Plan | October 27-31, 2025
Recap, Market Context & Key Levels for the Week Ahead

Welcome to this week’s plan. Inside, you’ll find a quick review of last week’s price action, key economic events, market structure, context for the week ahead, and the levels I’ll be focusing on. Let’s get prepared.
Contents
Last Week in Review & Bonus Chart
Economic & Earnings Calendar
Market Structure
Contextual Analysis & Plan
Key Levels of Interest
Last Week in Review & Bonus Chart
Last week’s plan:

Heading into last week, the main focus was on the 5-week balance area, where two-sided activity continued to dominate as the market awaited new information to resolve the range. The plan highlighted the importance of monitoring value development relative to the prior week’s inside bar—particularly its value area—to gauge whether the market intended to explore higher or lower.
Buyers aimed to build value above 6719, potentially setting the stage for a revisit of the all-time highs, while a weak response would involve building acceptance below 6660, opening the door to test the weak lows.
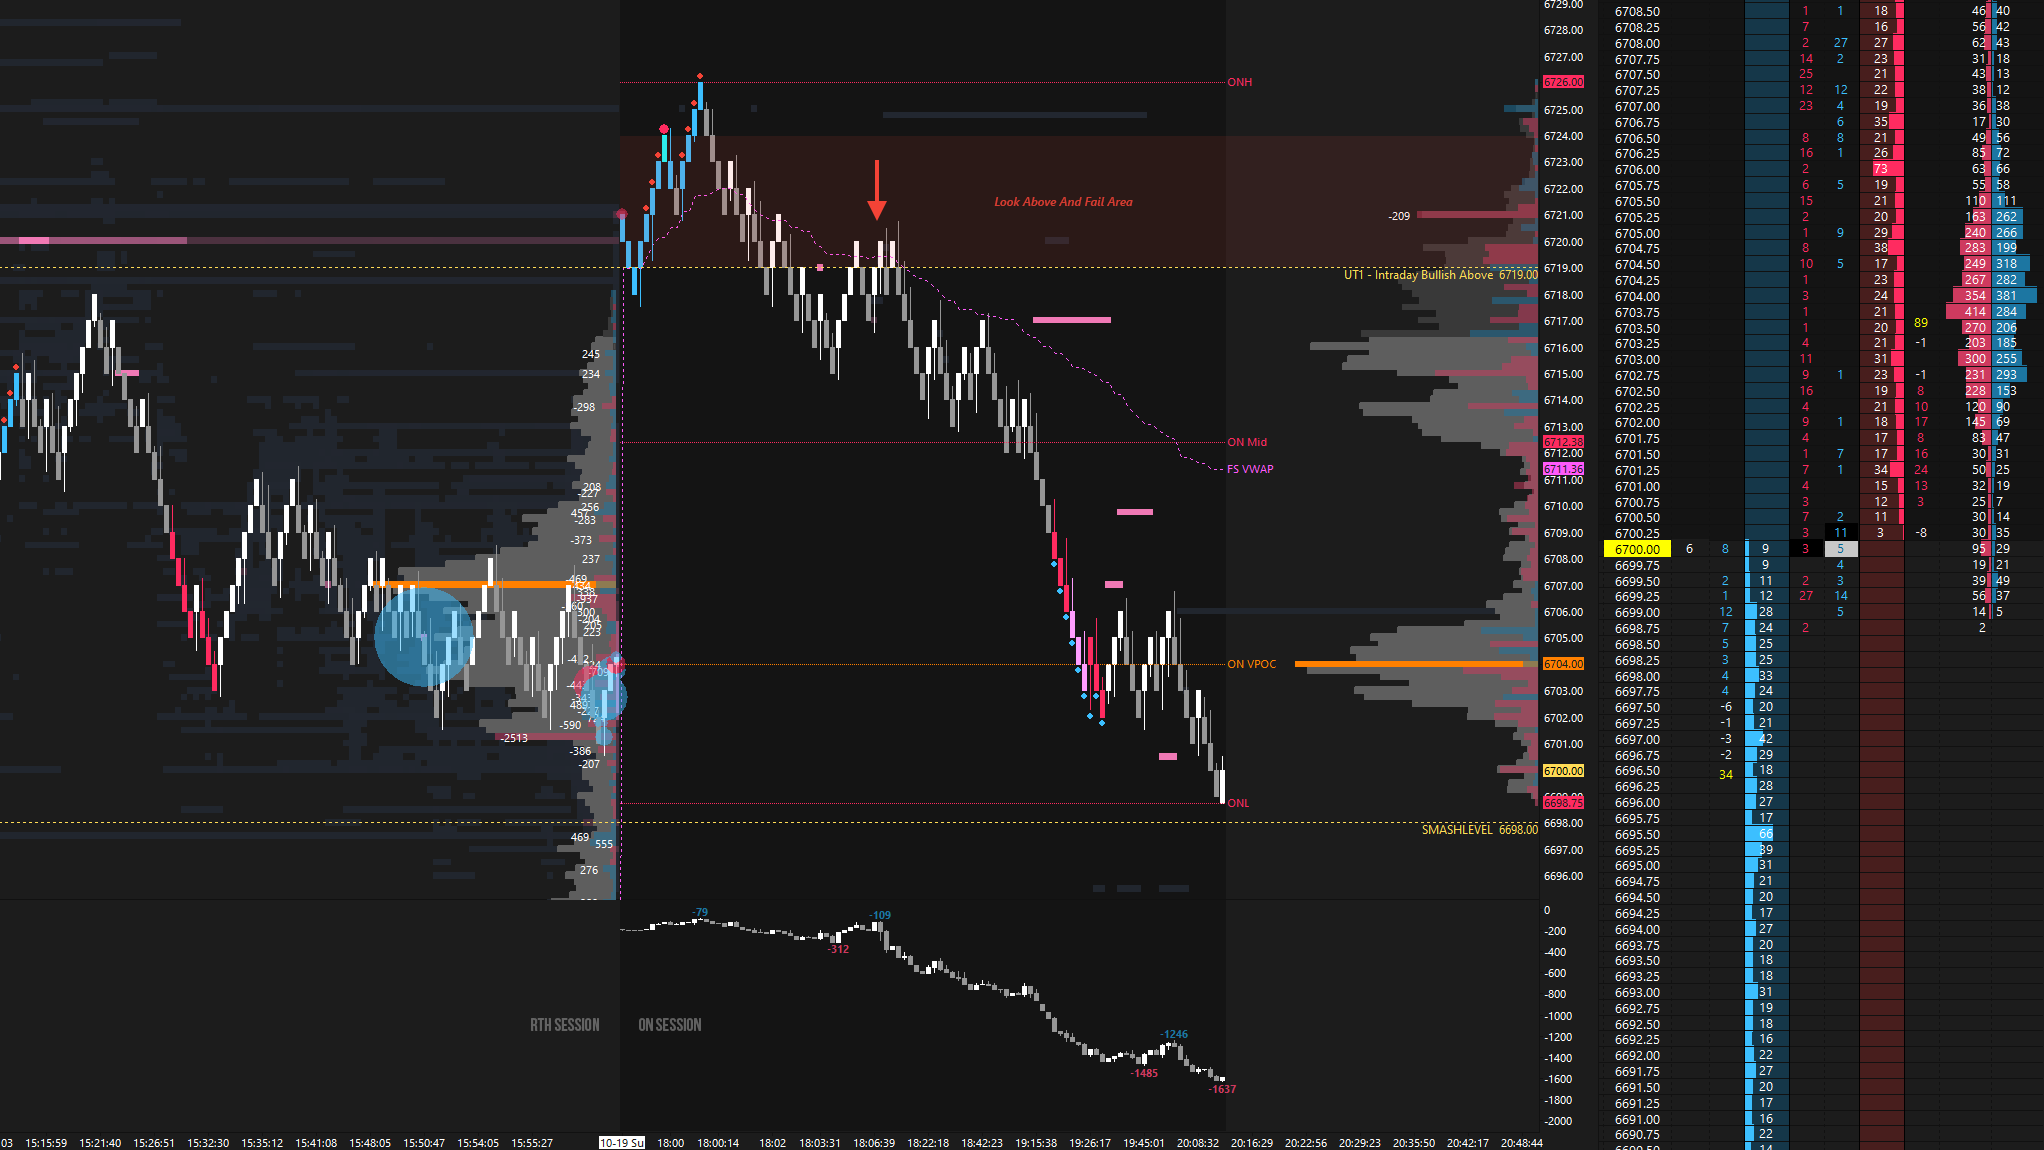
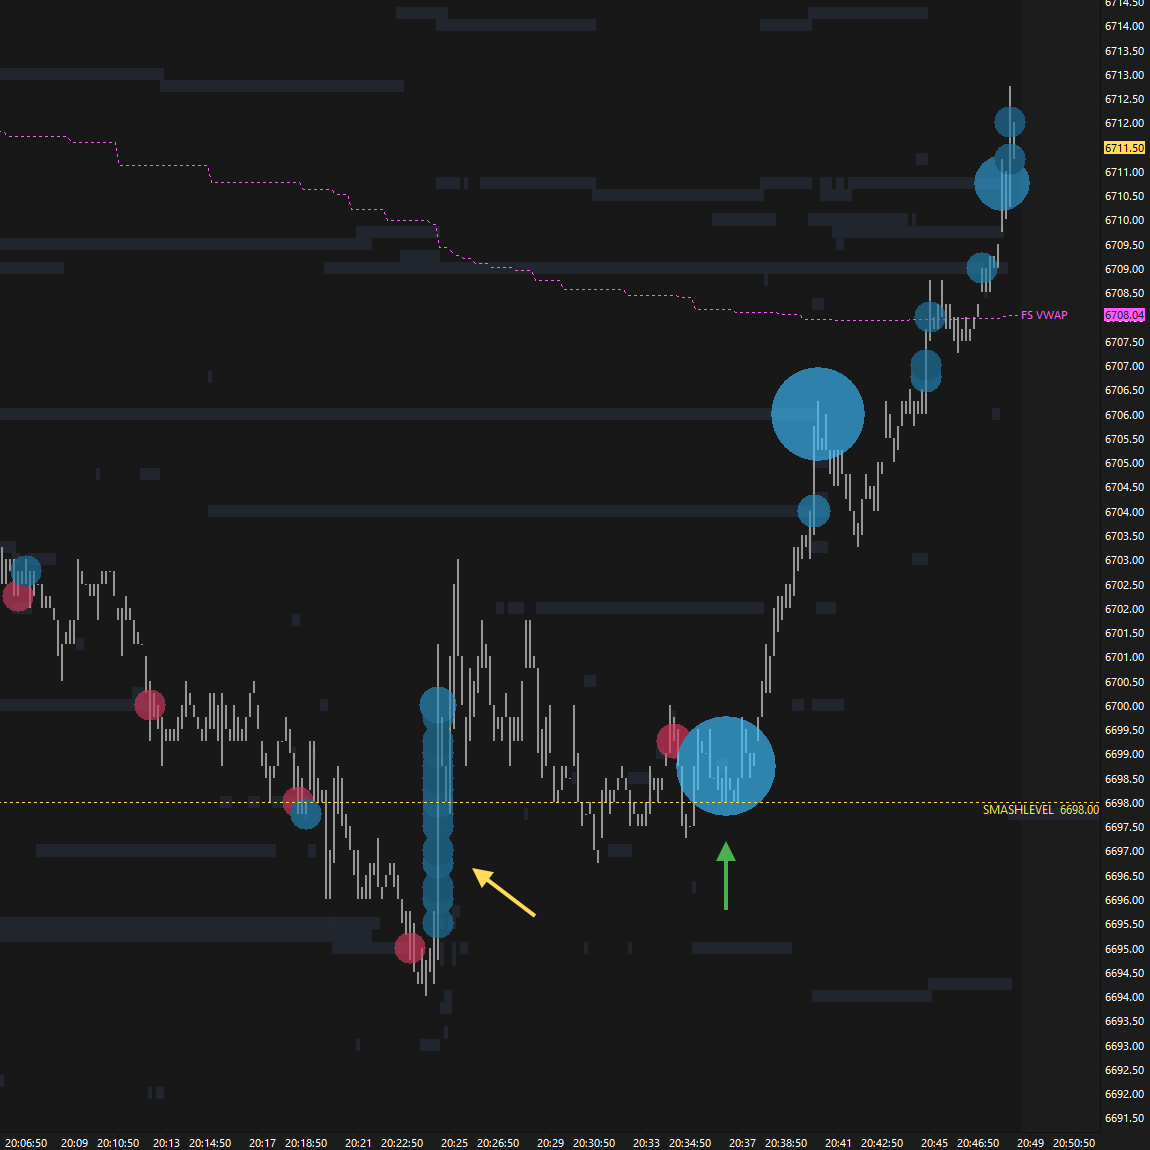
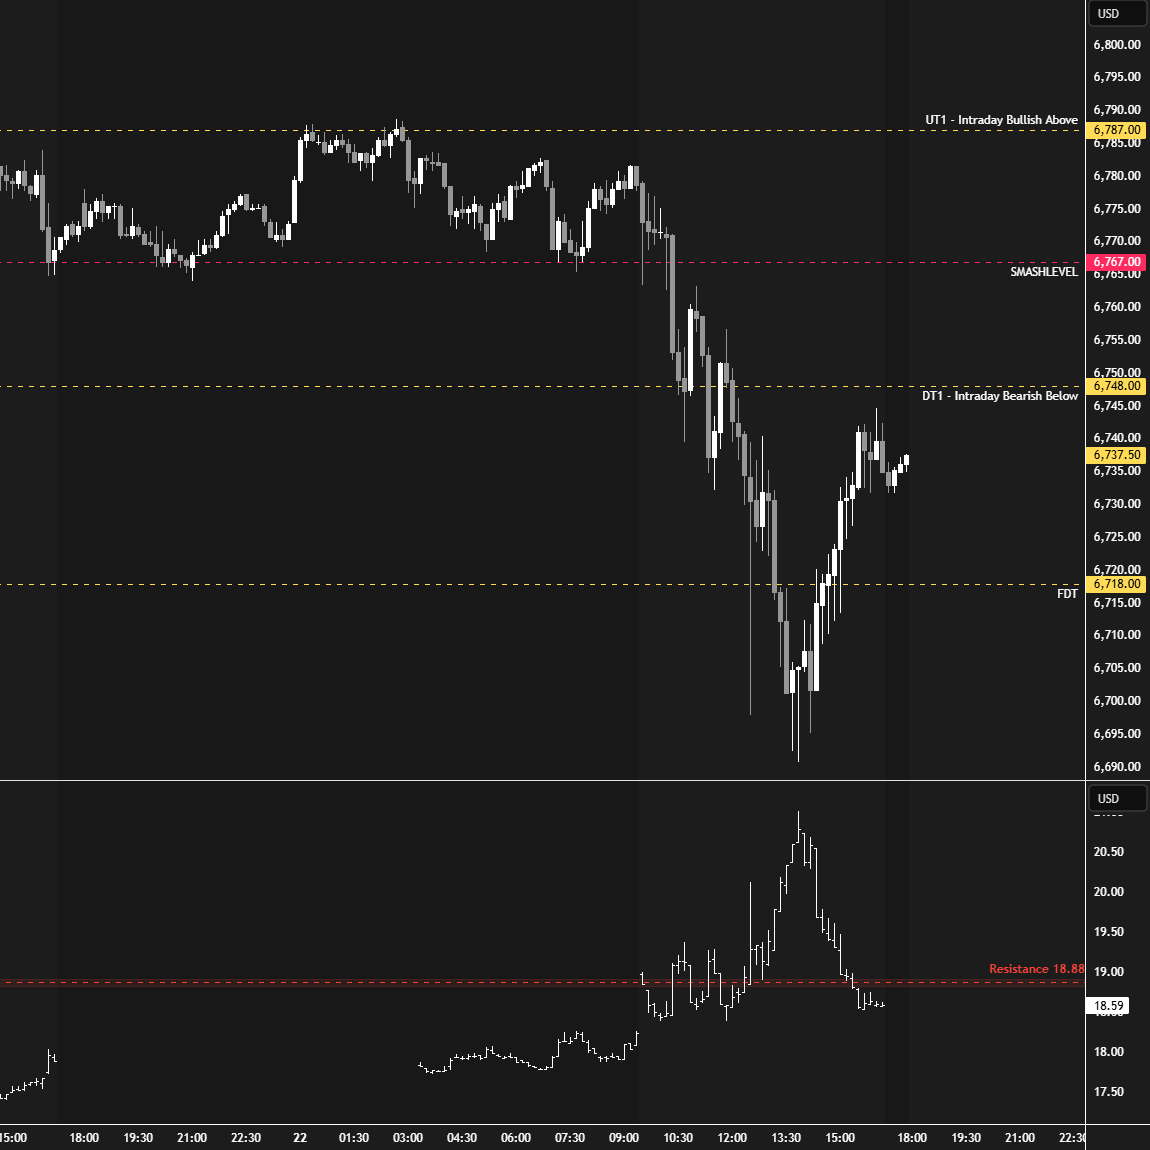
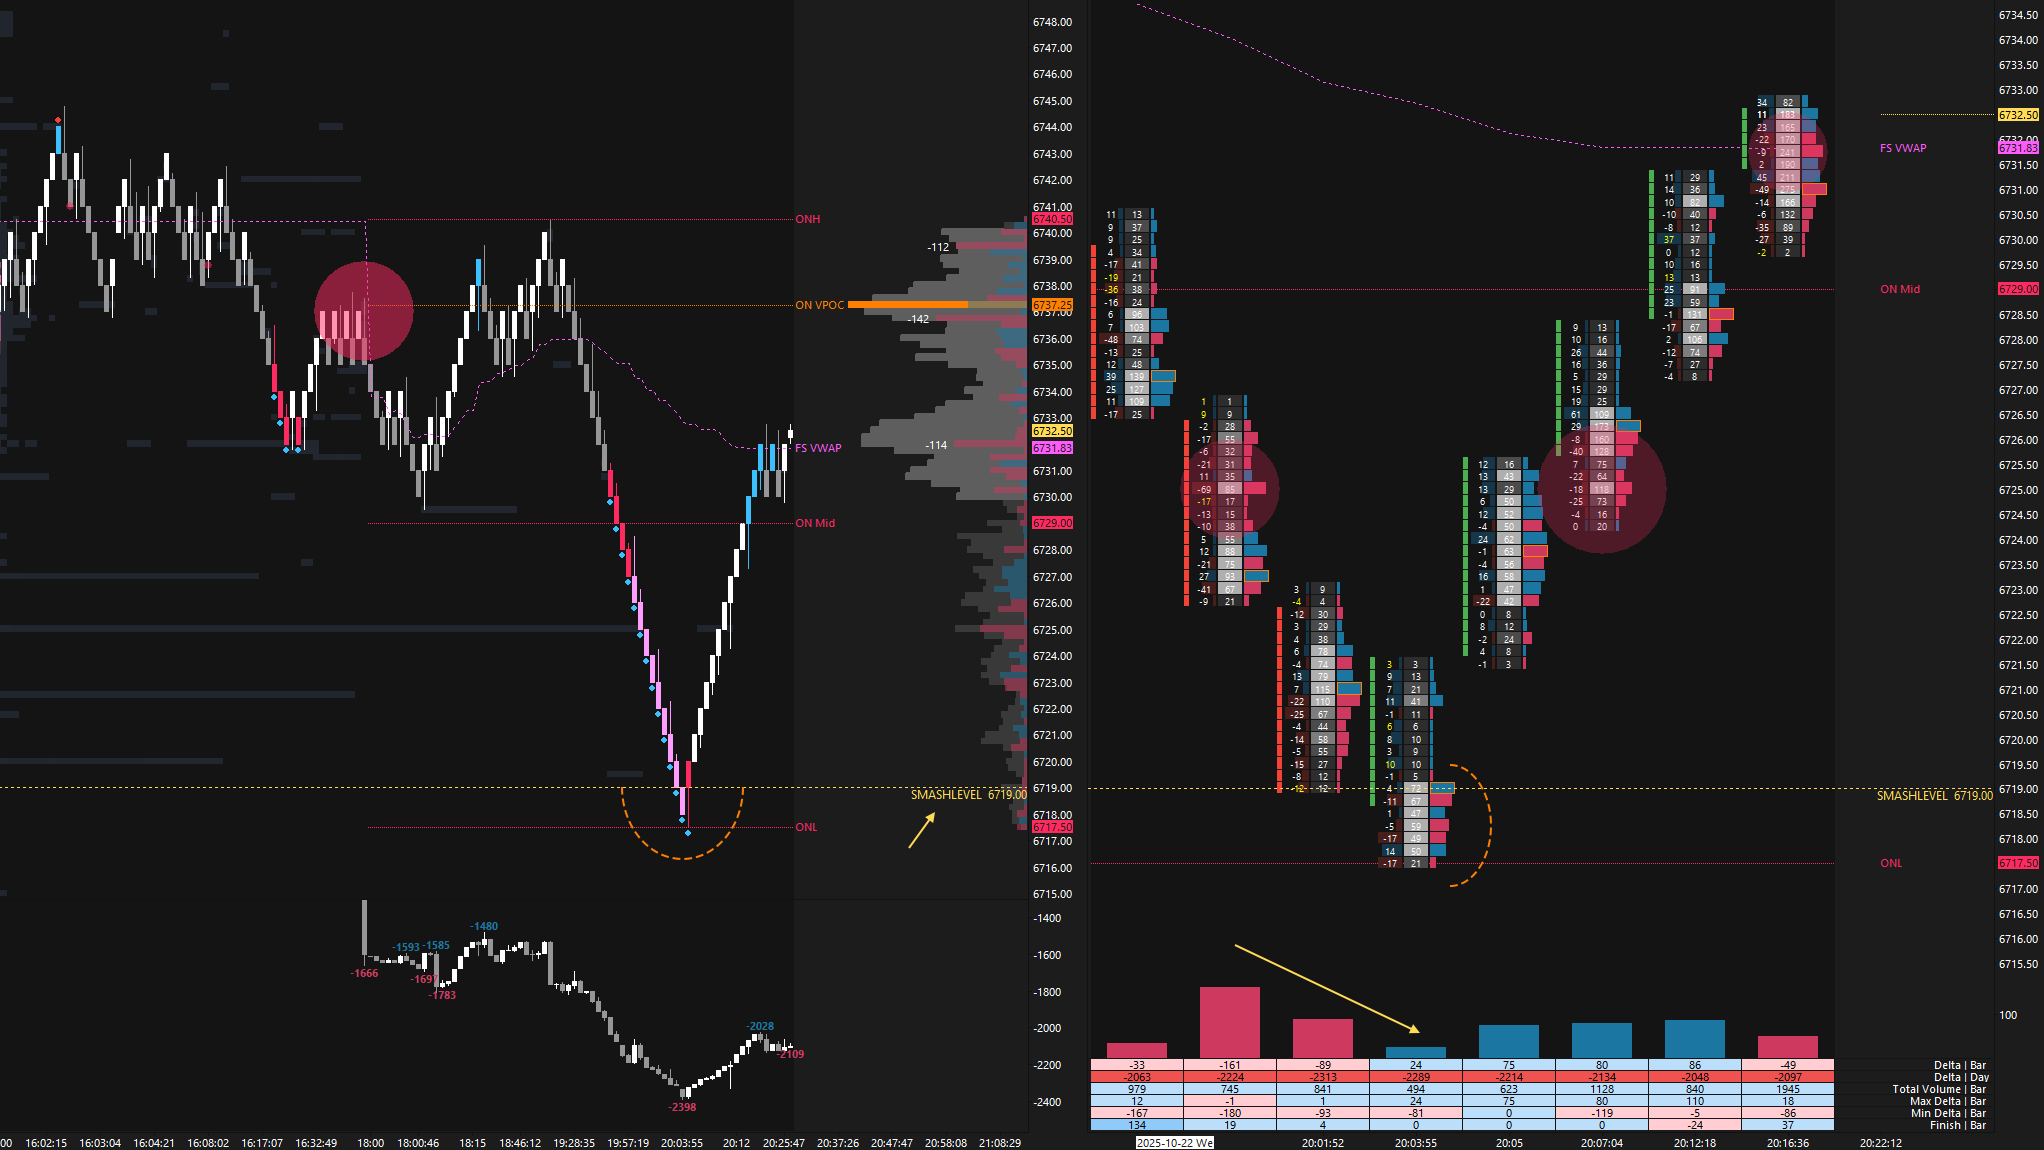
Monday kicked off the week with immediate overnight weakness following a failure above 6719, resulting in a test of the Smashlevel at 6698, where notable aggressive buying was observed (see Figure 1 & Figure 2). RTH opened on a true gap up, leading to upside continuation and a close back within the prior multi-day balance area from early October, as well as above the prior week’s inside bar.

Tuesday’s session continued to build value above the prior week’s inside bar, suggesting bullish consolidation until proven otherwise. Only sustained acceptance back within the prior week’s range would shift the short-term tone.
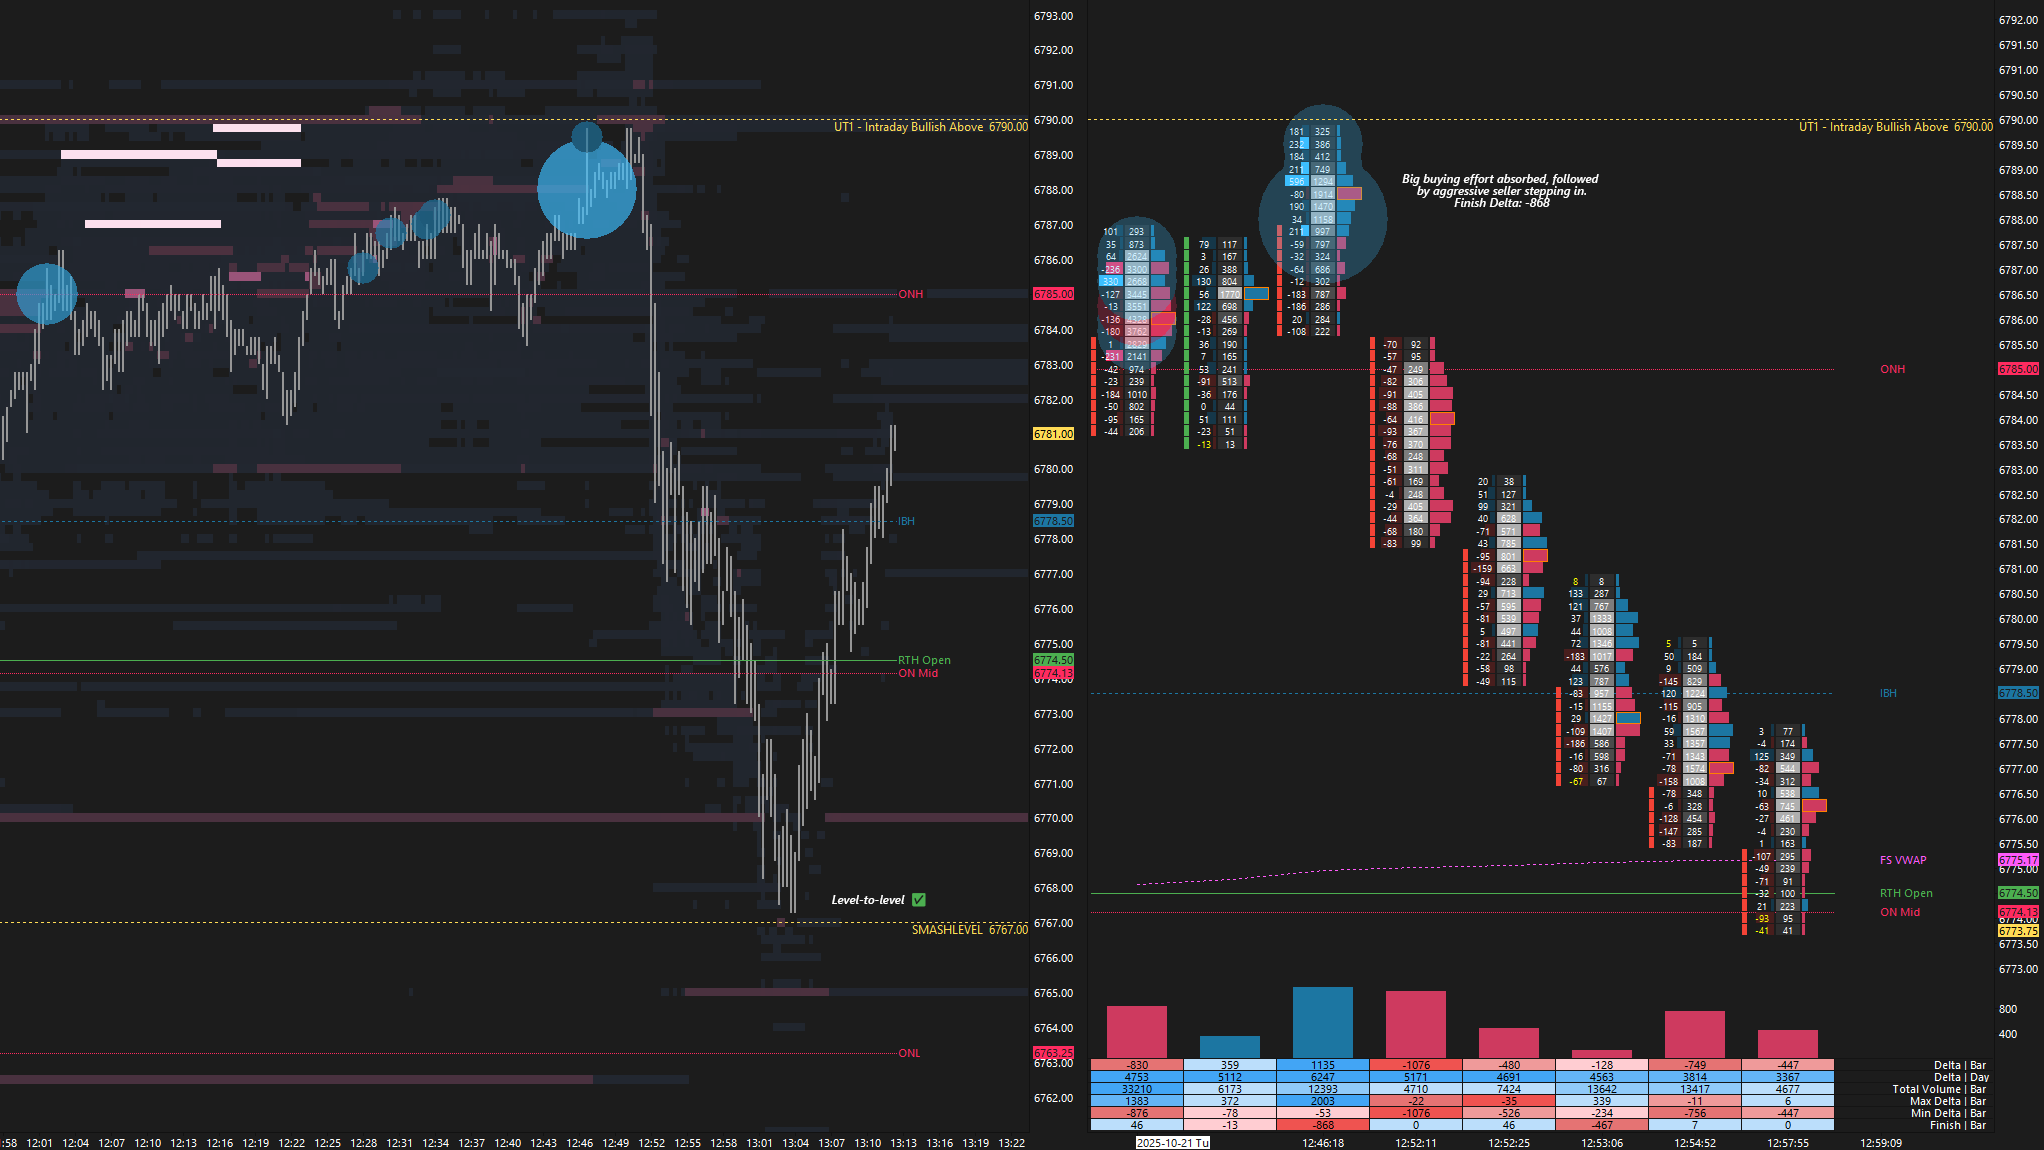
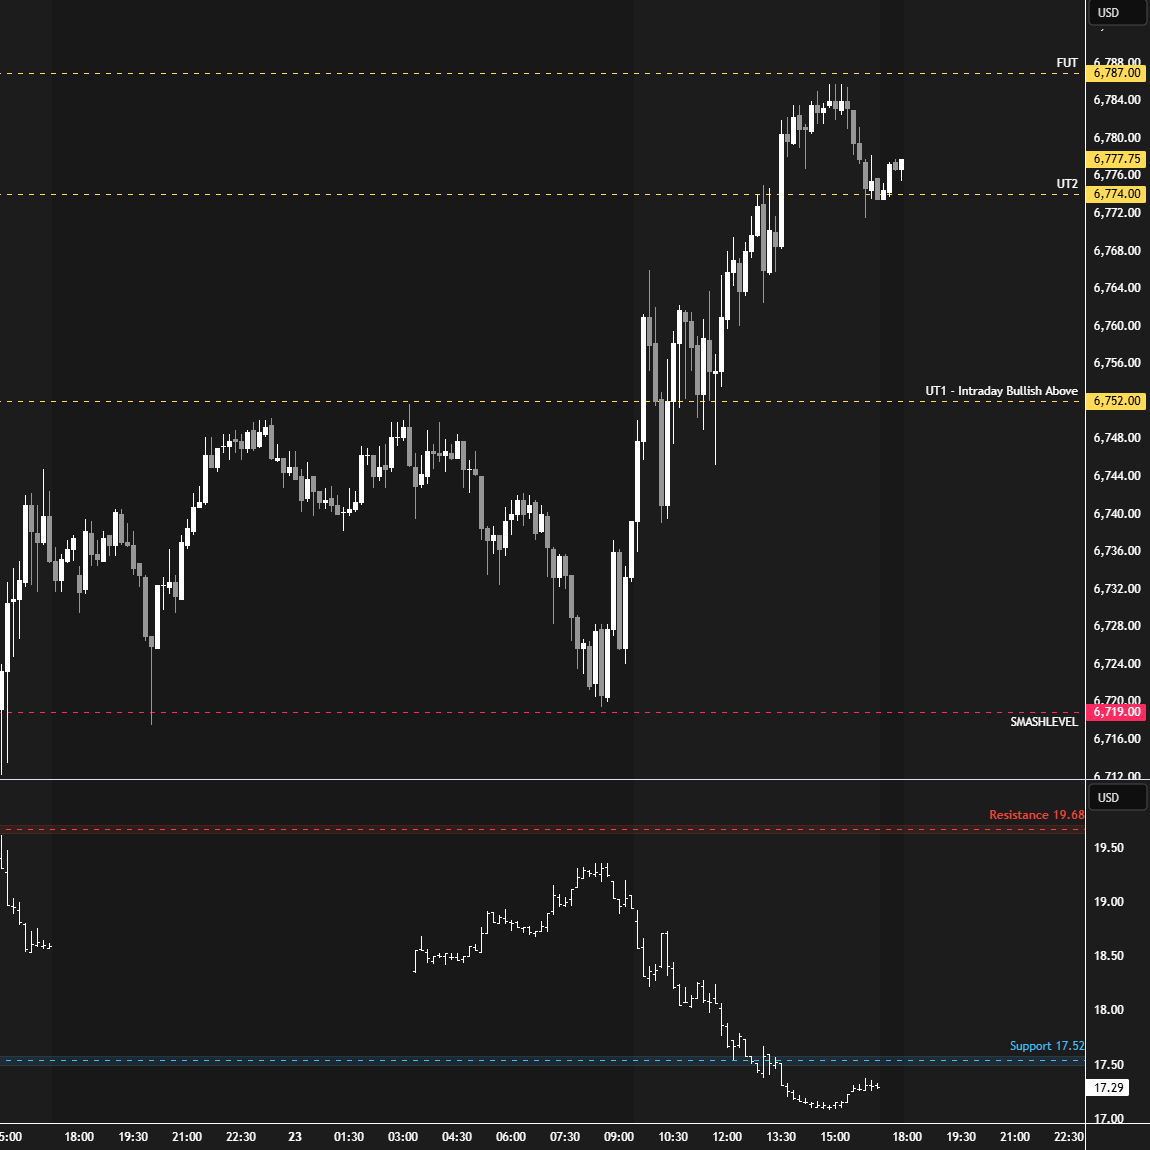
A great reversal setup played out after tagging UT1 at 6790: notable aggressive buying was absorbed, followed by aggressive sellers stepping in and triggering a reversal (see Figure 3). While this one was difficult to catch as it unfolded during a headline, the underlying principle of an order flow reversal remains the same.
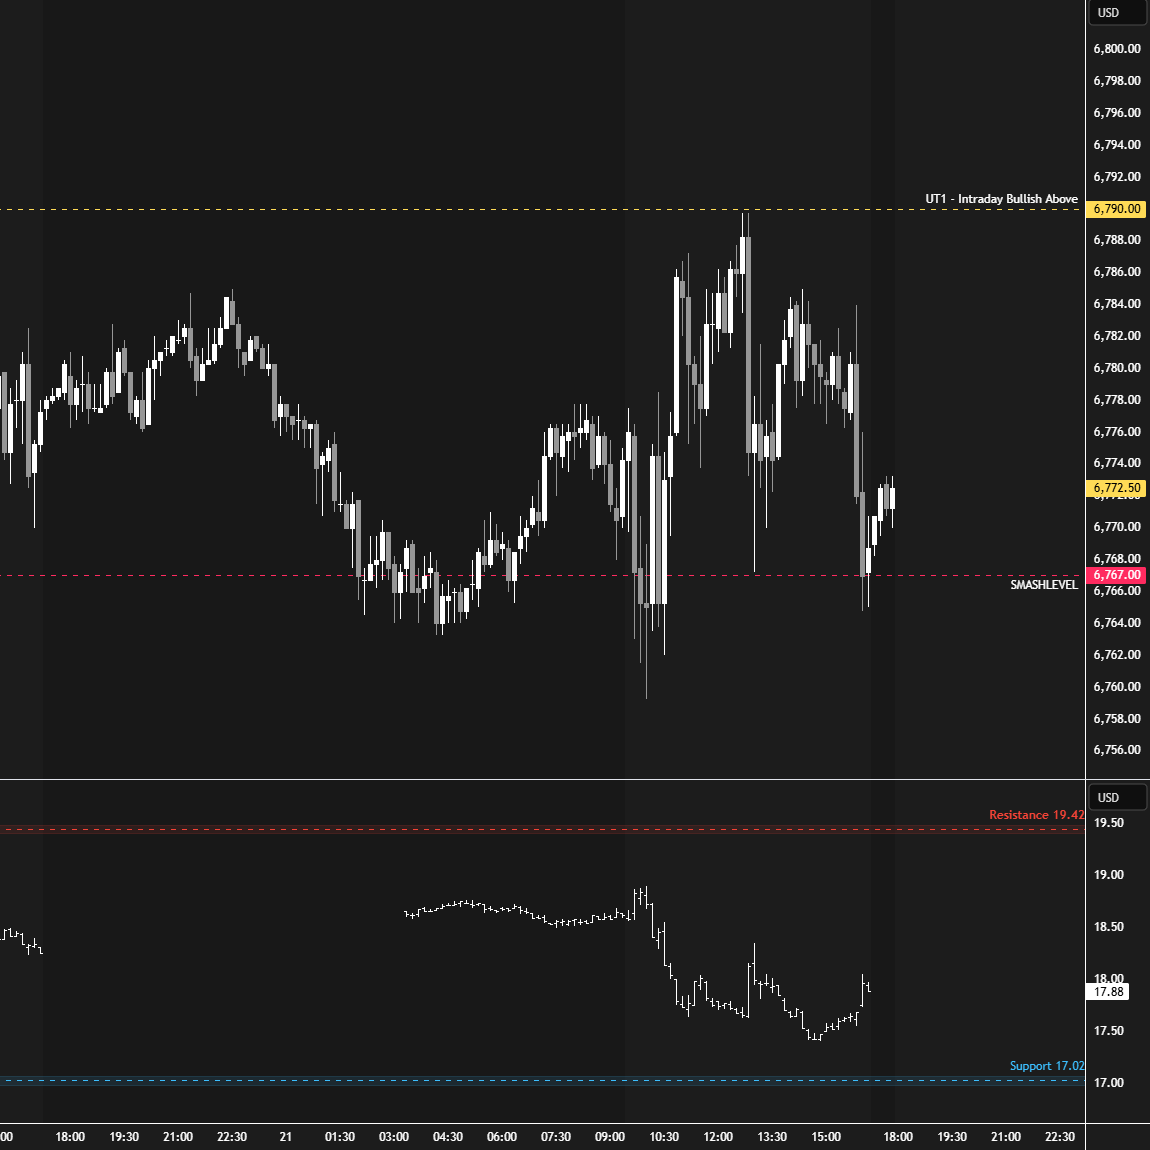
On Wednesday, sellers shifted the short-term tone by breaking 6767, signaling a return within the prior week’s range. This triggered the anticipated weakness, with Monday’s true gap filled in the process. Buyers later stepped in within the prior week’s value area, leading to a close back above its value area high at 6719—a pivotal level for the week.
Thursday was a massive session in terms of opportunities. The 6719 level attracted buyers early overnight (see Figure 4) and again pre-open. During the RTH session, the crucial 6752 level was reclaimed, resulting in a return to the value created earlier in the week.
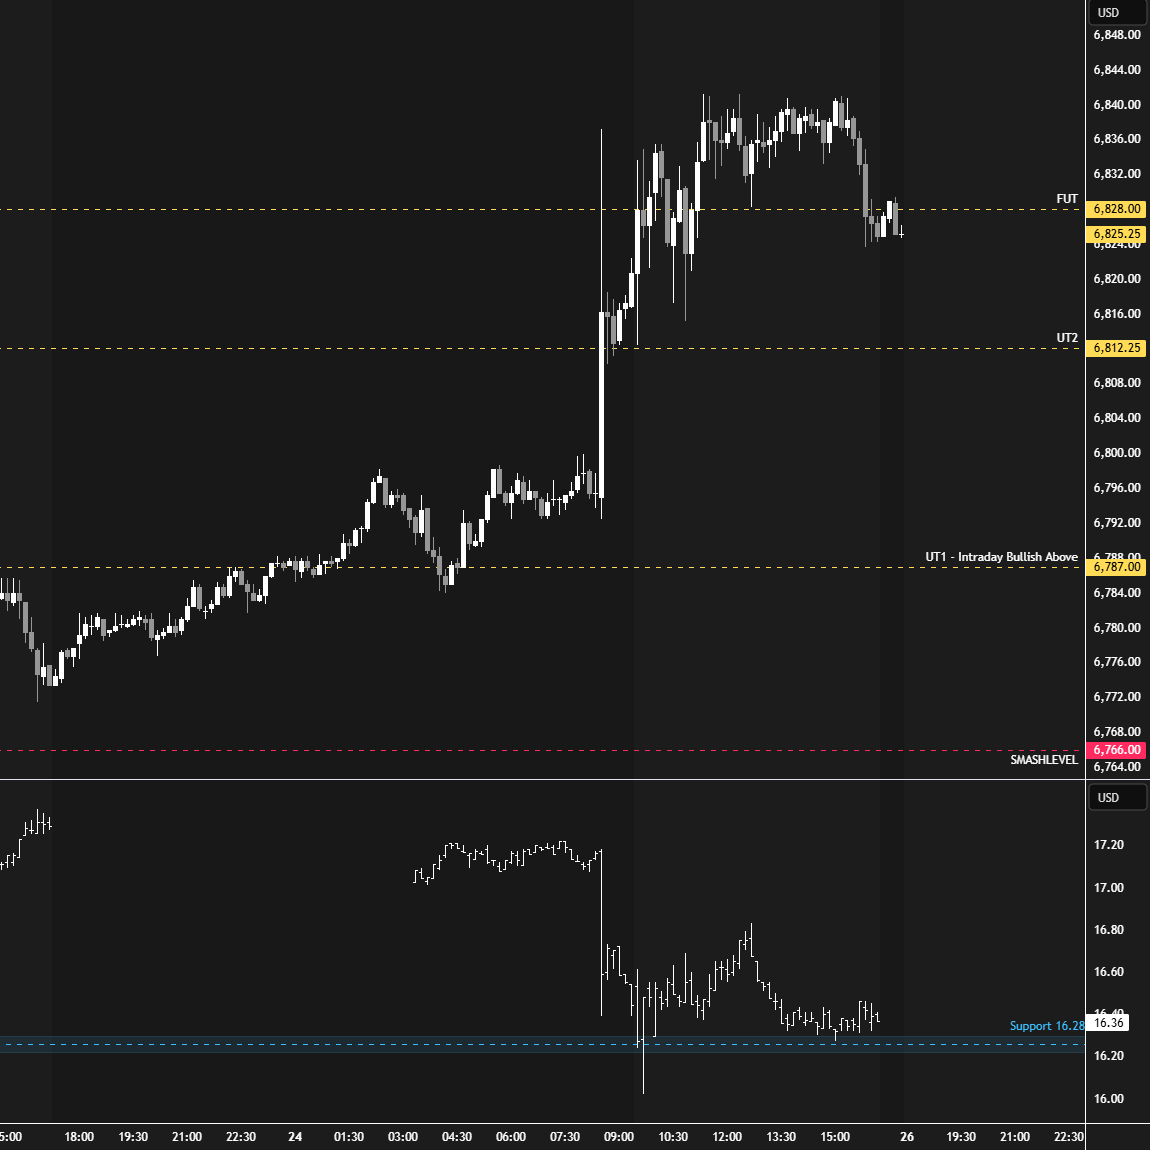
In Friday’s plan, we discussed how the weekly profile had formed a P-shaped profile with weak highs. The key question was whether the market was building energy for a breakout attempt to resolve this bullish imbalance. The CPI data release served as the catalyst, resulting in a breakout from the multi-week balance area and effectively cleaning up the unfinished business at the all-time highs (see Figure 5).
Key next will be to monitor for continuation—or lack thereof—as the market attempts to initiate a new phase of imbalance, with immediate focus on Friday’s true gap.
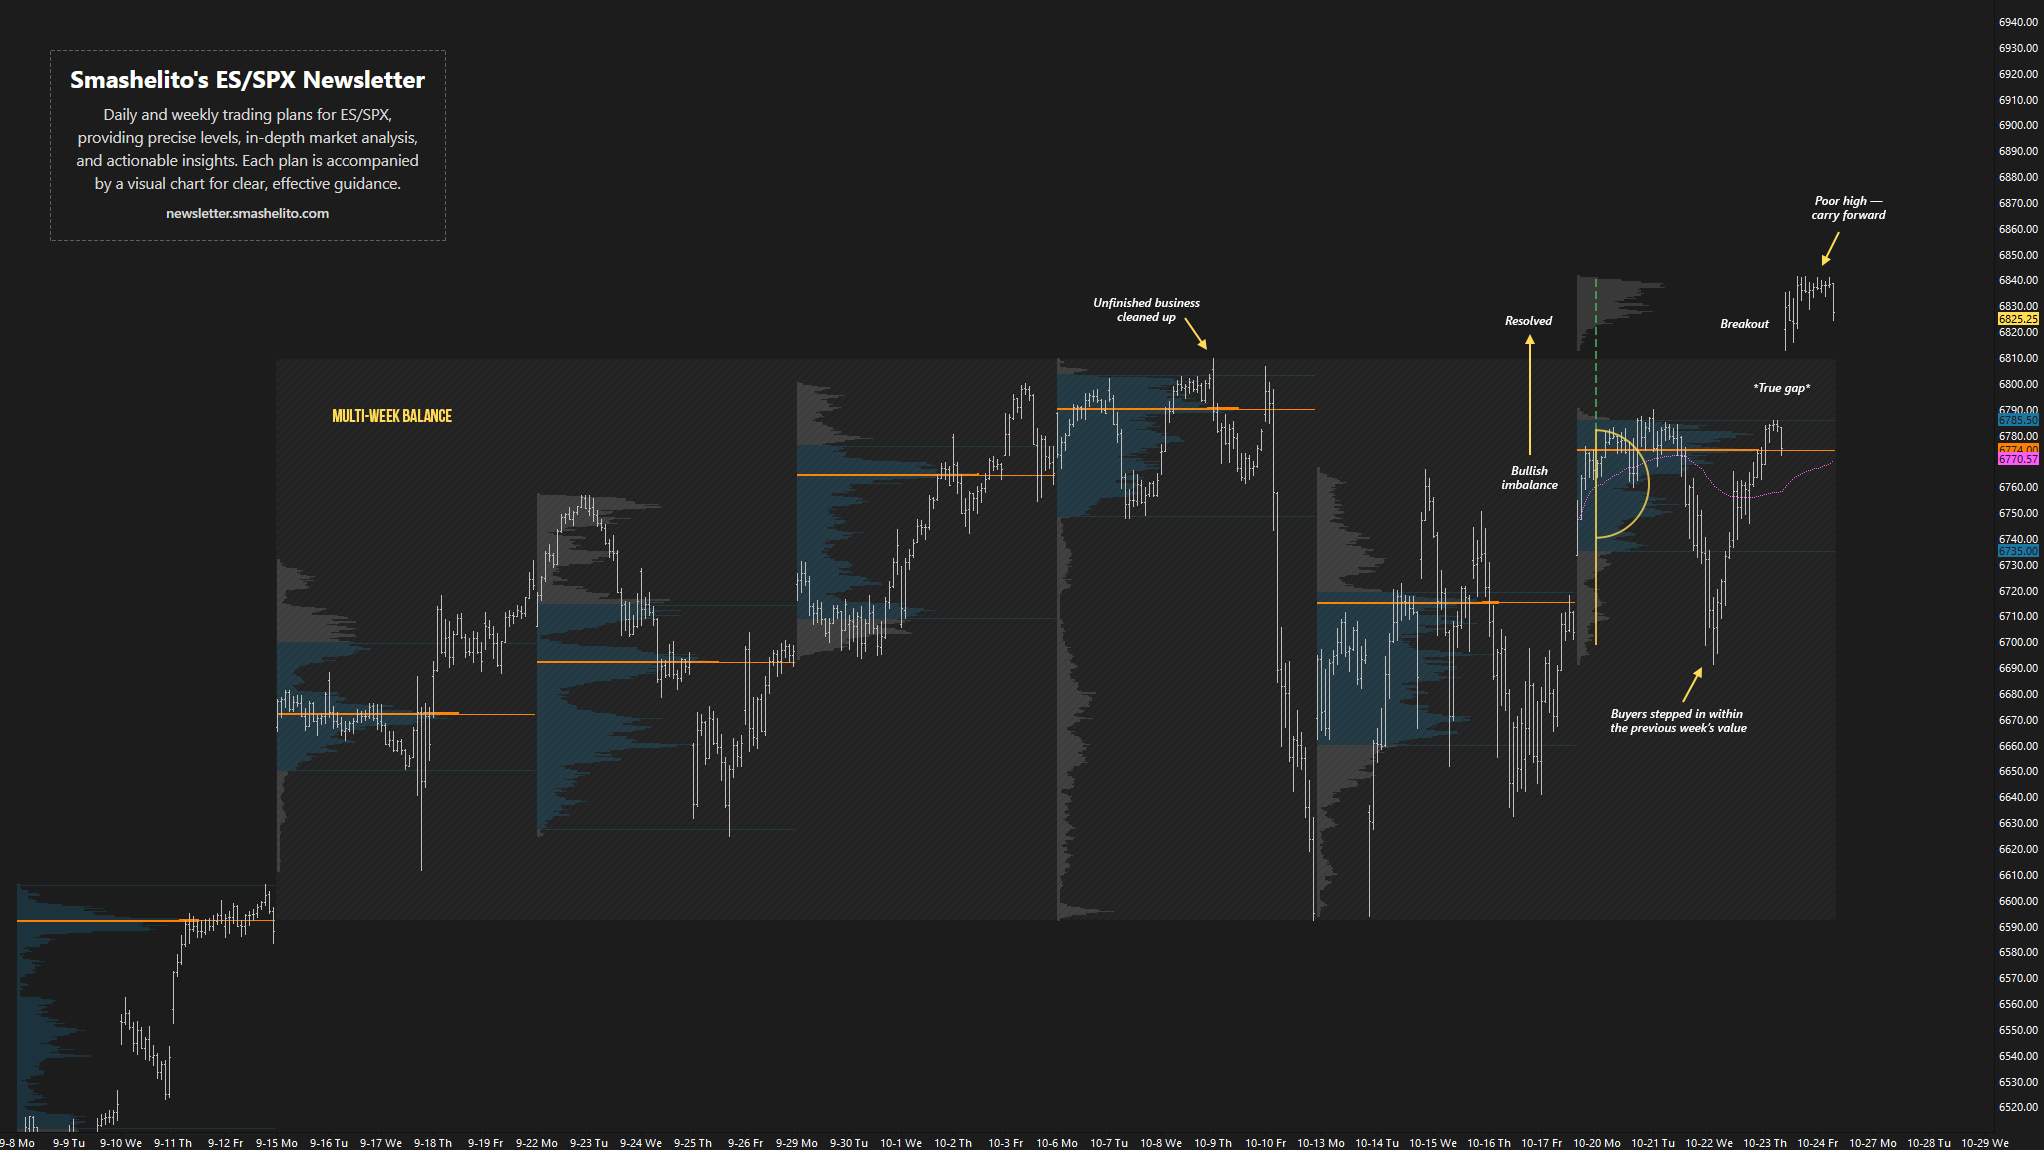
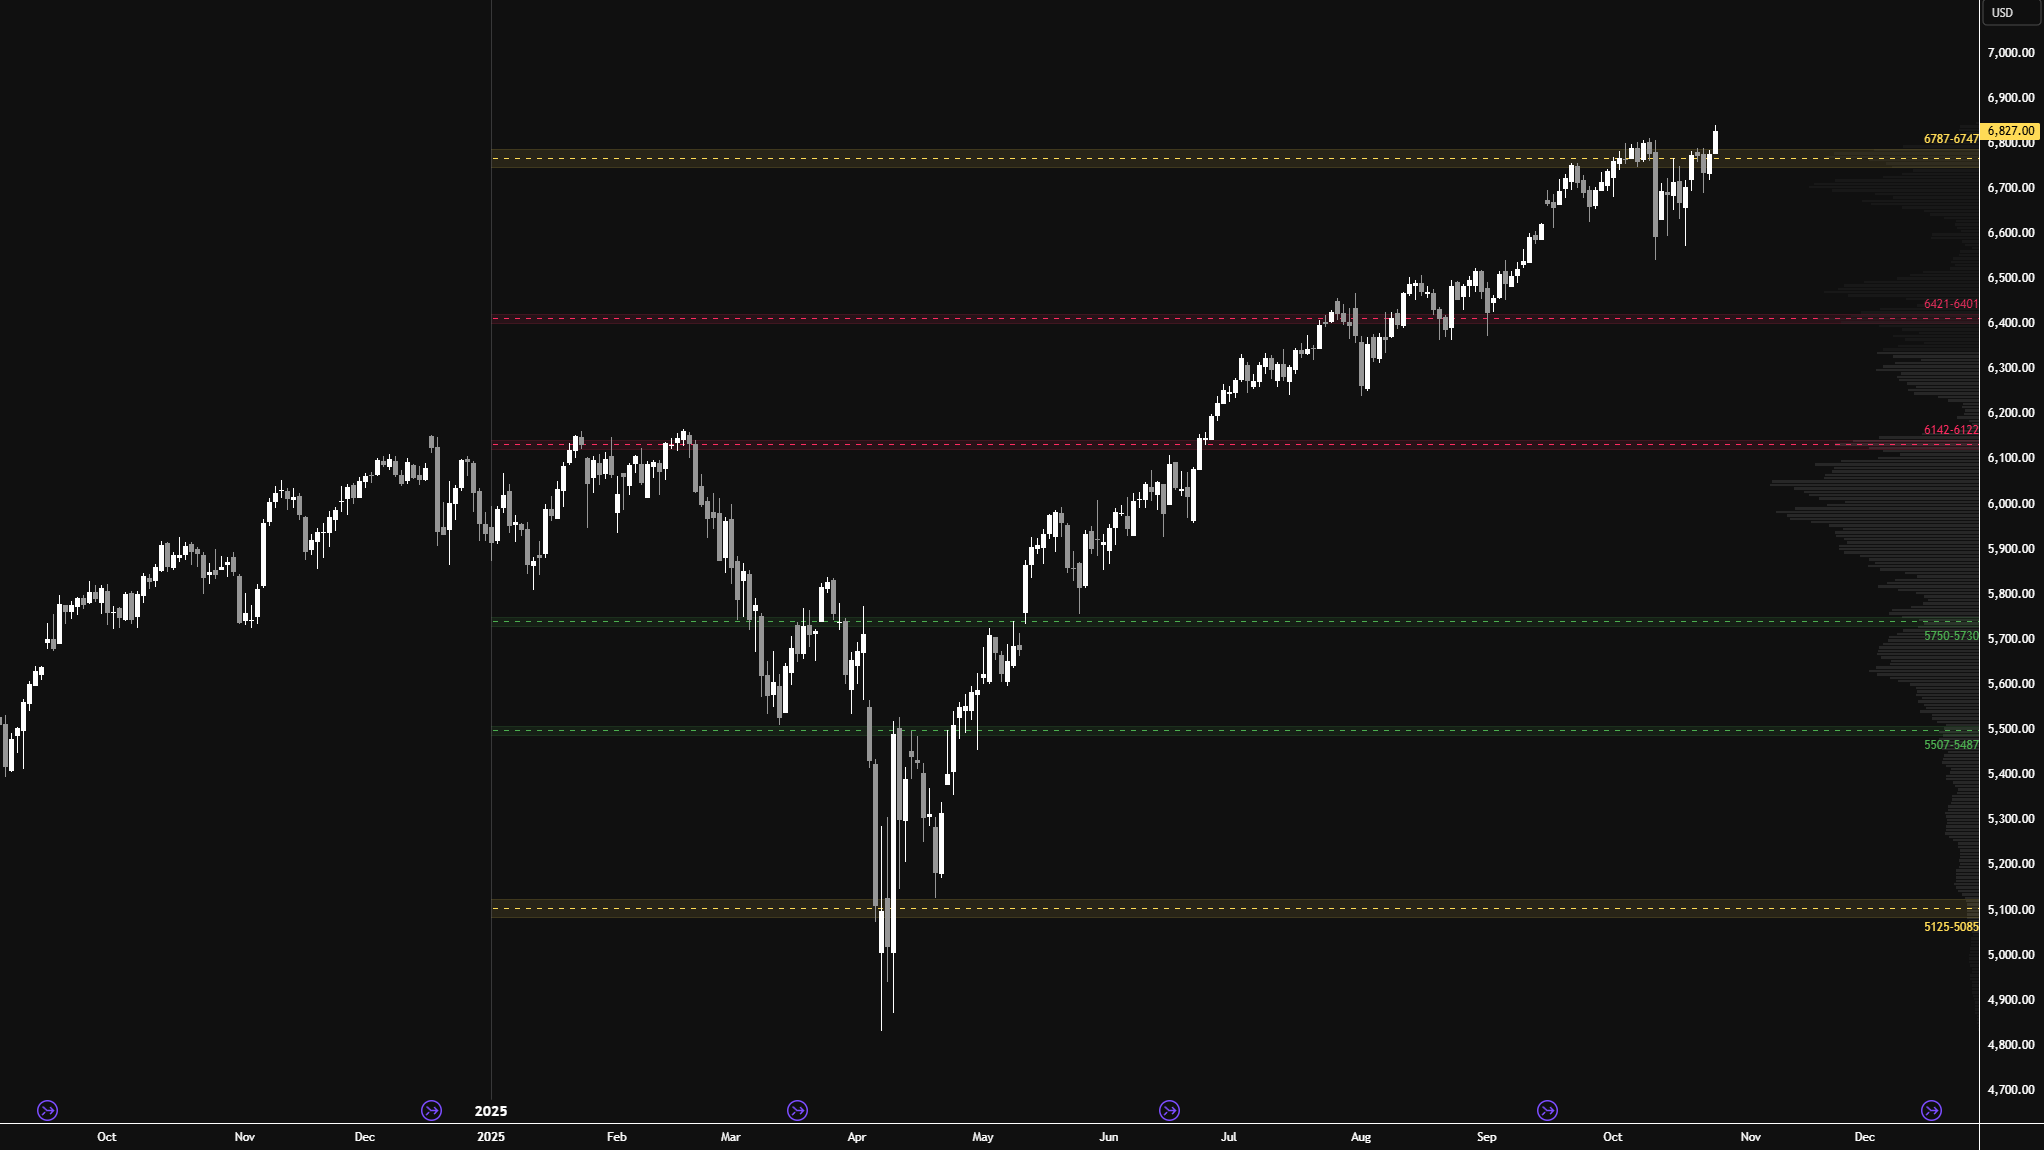
I will continue to include the HTF chart from a good friend of mine (see Figure 6), featuring levels generated by one of his models at the start of 2025. As you can see, this year’s price action has respected these levels remarkably well.
The 6747–6787 area of interest has been attracting selling activity for the past few weeks; however, Friday’s session saw a decisive close above this area. The key question now is whether the pullback on Friday, October 10th, was all the sellers had. Personally, I wanted to see a bigger pullback, but the market does what it wants, and our job is to align with it.
The simplest approach going forward is to monitor Friday’s breakout for continuation—or lack thereof. As long as the market builds value above the 6747–6787 area, there is potential for further upside pressure. Acceptance back below would once again open the door to weakness.
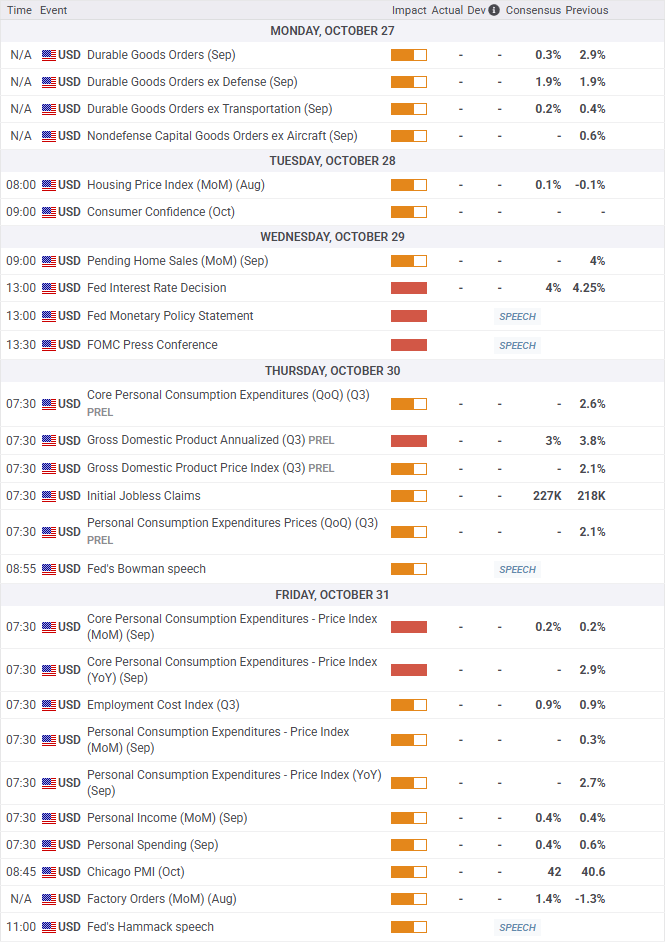
Economic & Earnings Calendar

Market Structure
🟩 Daily: OTFU → Ends at: 6812.50
🟩 Weekly: OTFU → Ends at: 6690.75
🟩 Monthly: OTFU → Ends at: 6371.75
Balance: A market condition where price consolidates within a defined range, reflecting indecision as the market awaits more market-generated information. We apply balance guidelines—favoring fade trades at range extremes (highs/lows) and preparing for breakout setups if balance resolves.
One-Time Framing Up (OTFU): A market condition where each subsequent bar forms a higher low, signaling a strong upward trend.
One-Time Framing Down (OTFD): A market condition where each subsequent bar forms a lower high, signaling a strong downward trend.
Contextual Analysis & Plan
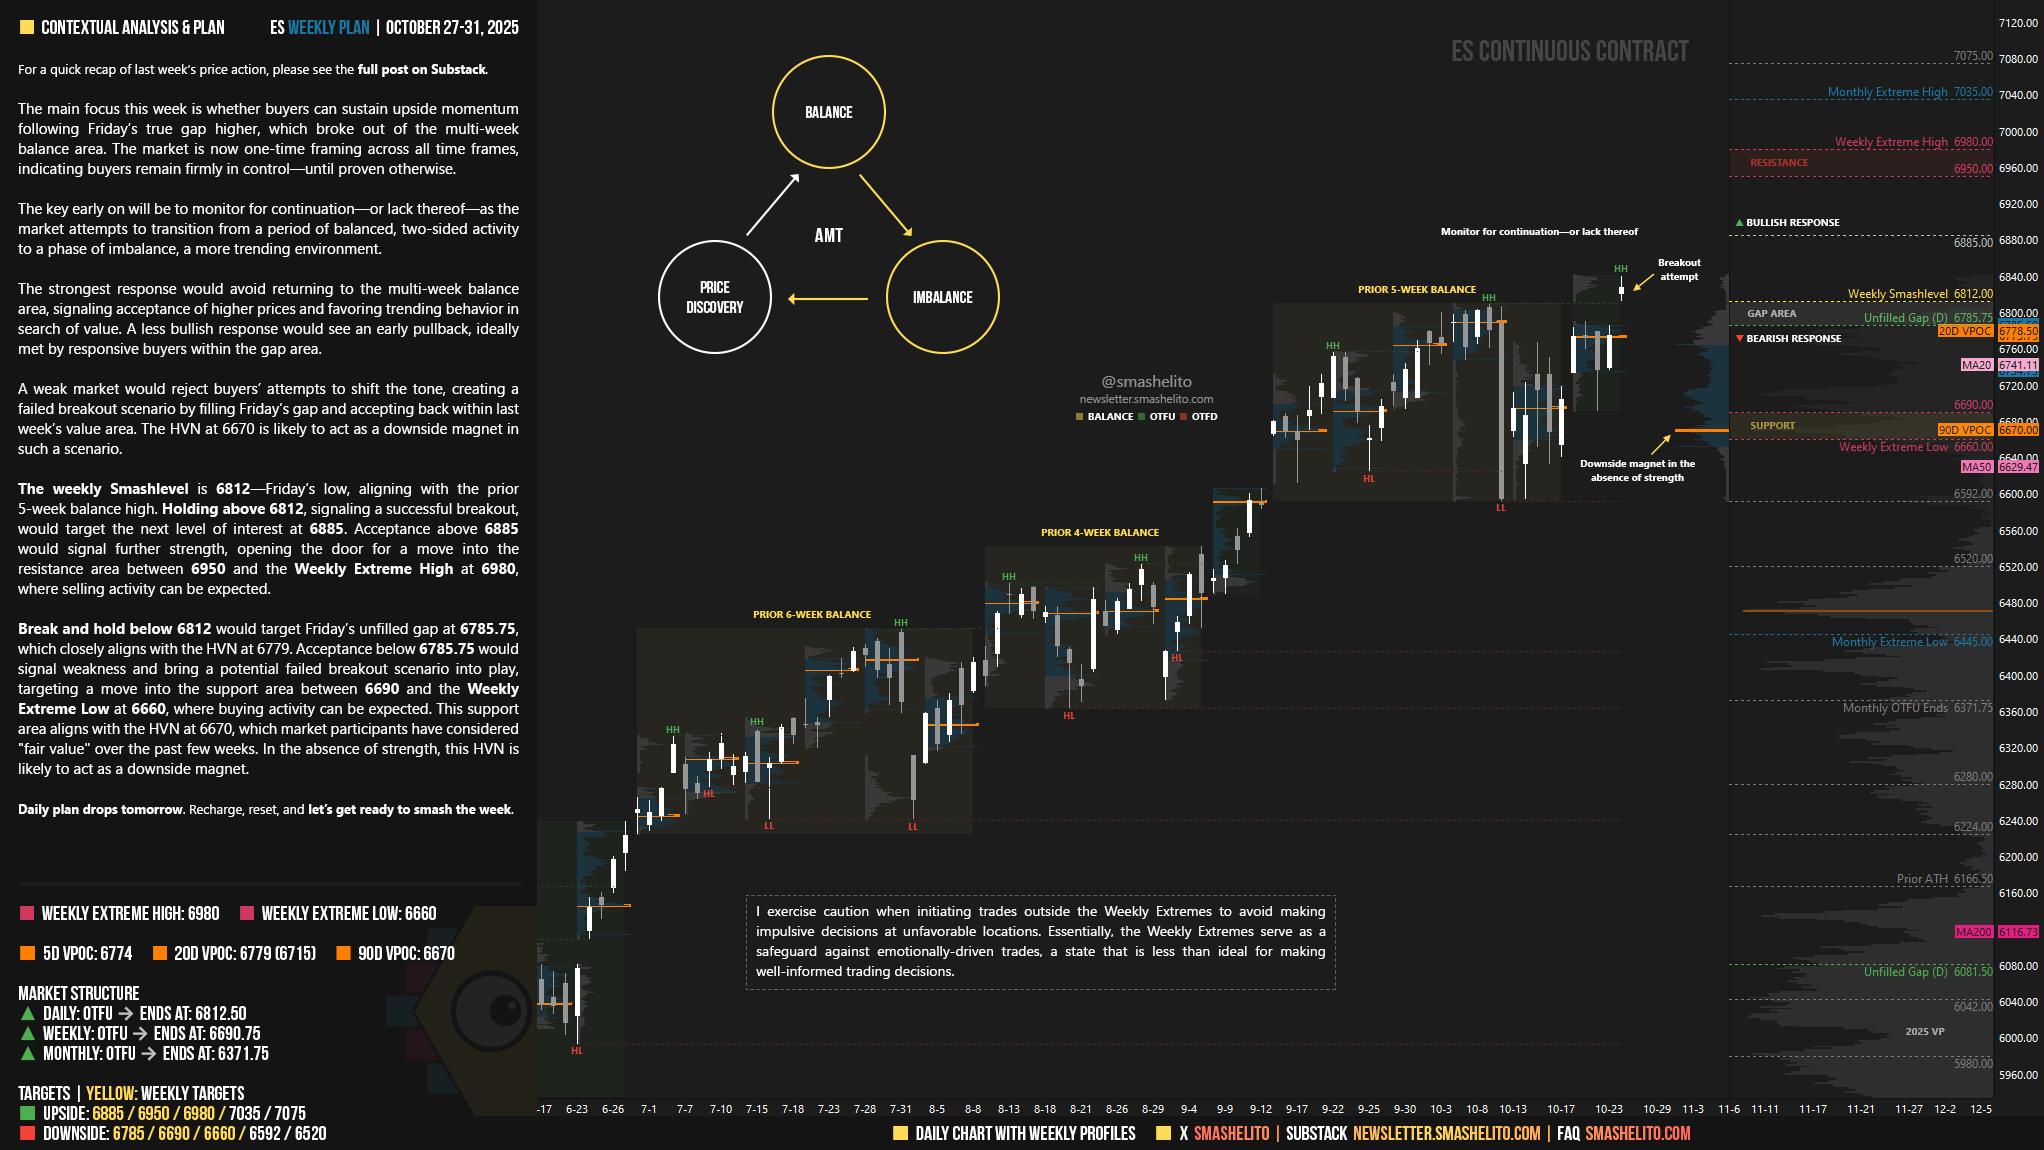
The main focus this week is whether buyers can sustain upside momentum following Friday’s true gap higher, which broke out of the multi-week balance area. The market is now one-time framing across all time frames, indicating buyers remain firmly in control—until proven otherwise.
The key early on will be to monitor for continuation—or lack thereof—as the market attempts to transition from a period of balanced, two-sided activity to a phase of imbalance, a more trending environment.
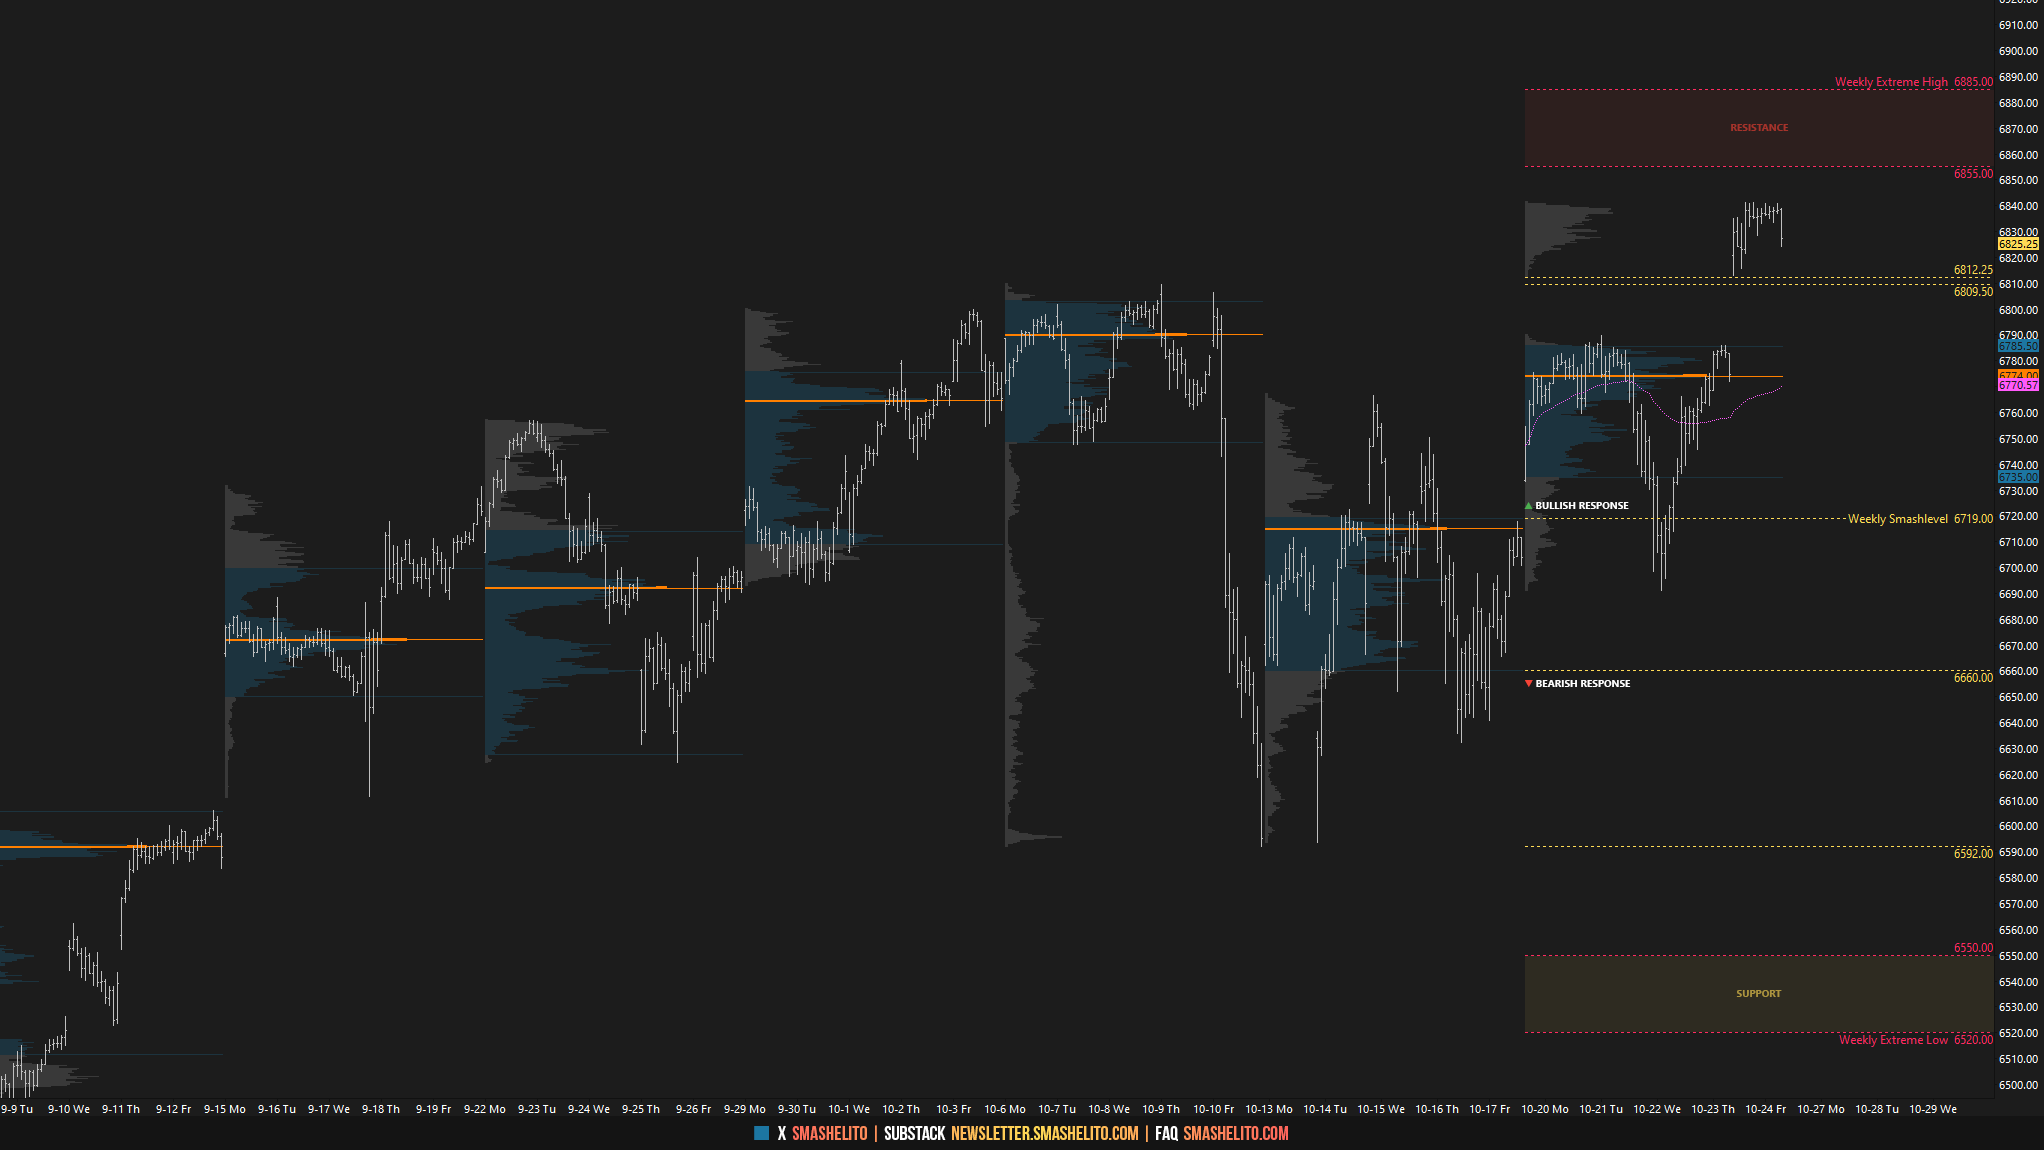
The strongest response would avoid returning to the multi-week balance area, signaling acceptance of higher prices and favoring trending behavior in search of value. A less bullish response would see an early pullback, ideally met by responsive buyers within the gap area.
A weak market would reject buyers’ attempts to shift the tone, creating a failed breakout scenario by filling Friday’s gap and accepting back within last week’s value area. The HVN at 6670 is likely to act as a downside magnet in such a scenario.
The weekly Smashlevel is 6812—Friday’s low, aligning with the prior 5-week balance high. Holding above 6812, signaling a successful breakout, would target the next level of interest at 6885. Acceptance above 6885 would signal further strength, opening the door for a move into the resistance area between 6950 and the Weekly Extreme High at 6980, where selling activity can be expected.
Break and hold below 6812 would target Friday’s unfilled gap at 6785.75, which closely aligns with the HVN at 6779. Acceptance below 6785.75 would signal weakness and bring a potential failed breakout scenario into play, targeting a move into the support area between 6690 and the Weekly Extreme Low at 6660, where buying activity can be expected. This support area aligns with the HVN at 6670, which market participants have considered “fair value” over the past few weeks. In the absence of strength, this HVN is likely to act as a downside magnet.
Key Levels of Interest
In the upcoming week, I will closely observe the behavior around 6812.
Holding above 6812 would target 6885 / 6950 / 6980* / 7035 / 7075
Break and hold below 6812 would target 6785 / 6690 / 6660* / 6592 / 6520
*Weekly Extremes. I exercise caution when initiating trades outside the Weekly Extremes to avoid making impulsive decisions at unfavorable locations. Essentially, the Weekly Extremes serve as a safeguard against emotionally-driven trades, a state that is less than ideal for making well-informed trading decisions.
Daily plan drops tomorrow. Recharge, reset, and let’s get ready to smash the week.
Thank you for all your hard work. Absolutely flawless IMHO. Wouldn't day trade without your daily guidance. Awesome!
Thanks Smash!!