
ES Weekly Plan | May 26-30, 2025
Key Levels & Market Context for the Upcoming Week.

Economic & Earnings Calendar
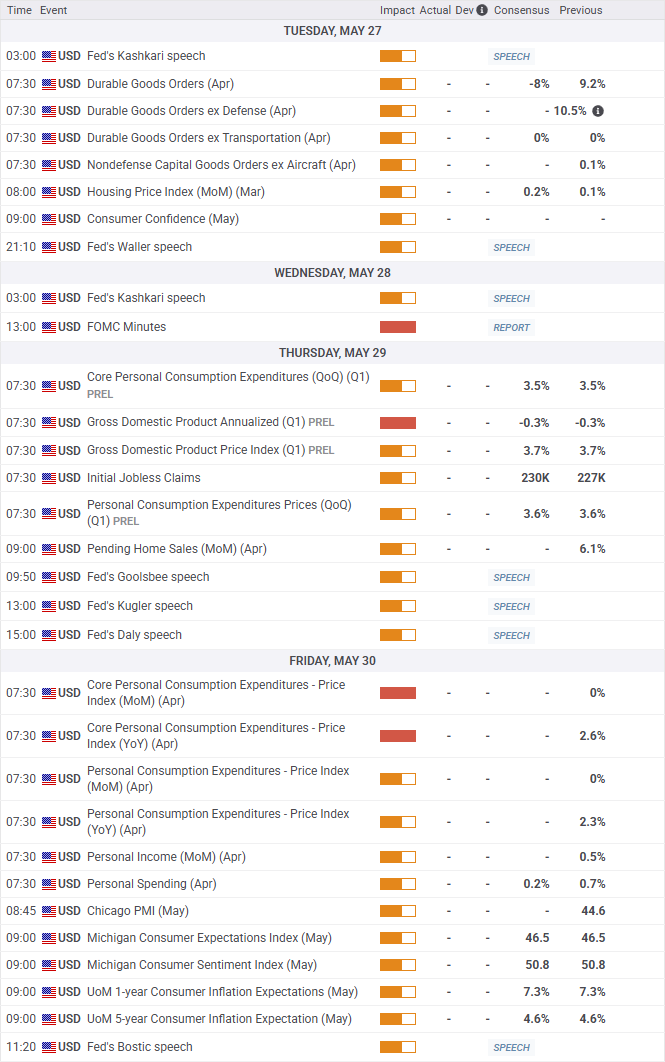
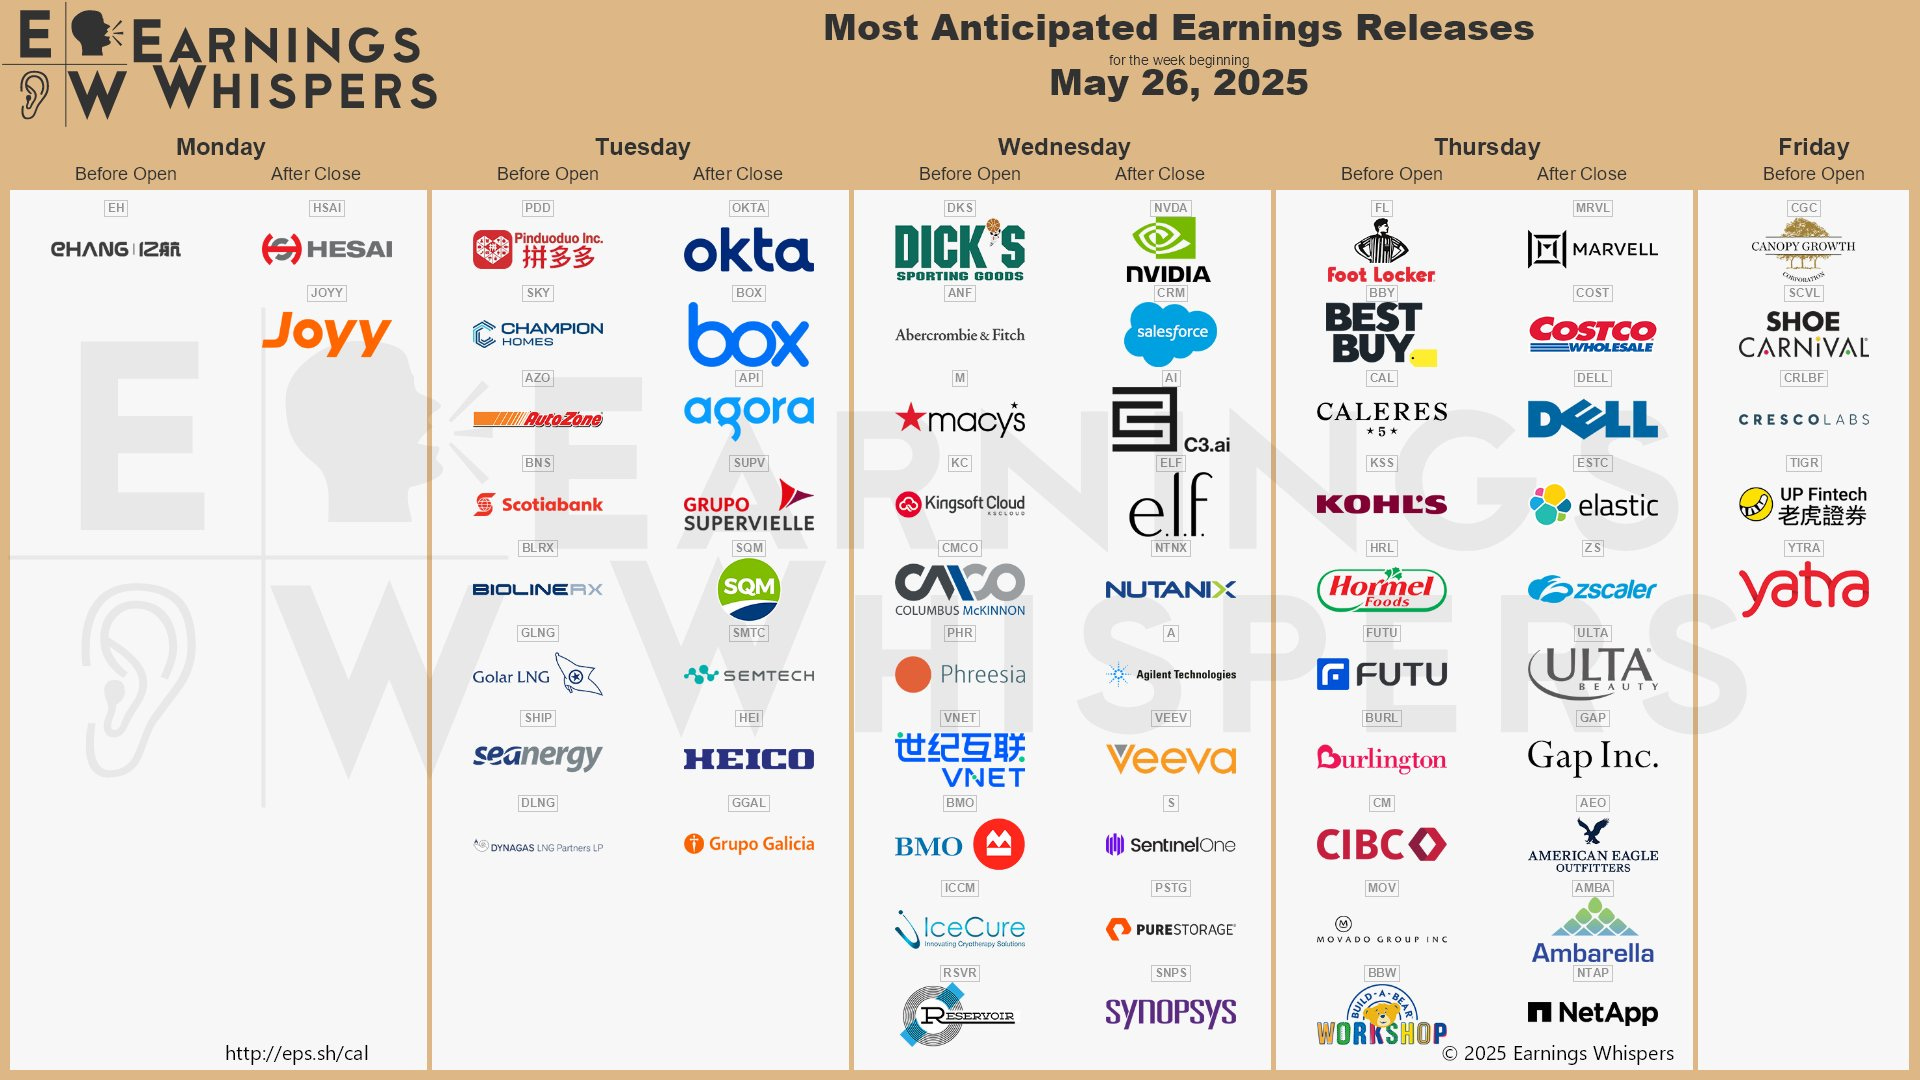
Visual Representation

Market Structure
🟥 DAILY: OTFD → Ends at: 5843.75
🟨 WEEKLY: BALANCE → 2-Week → High: 5987.50 / L: 5780.50
🟨 MONTHLY: BALANCE → TBD
One-time Framing Down (OTFD): A market condition where each subsequent bar forms a lower high, indicating a strong downward trend. The opposite condition, One-time Framing Up (OTFU), occurs when each subsequent bar forms a higher low, indicating a strong upward trend.
Contextual Analysis & Plan
Last week kicked off with a true gap down on Monday, which failed to see downside follow-through and instead resulted in an outside day to the upside. Tuesday formed an inside day, followed by a downside break on Wednesday that established a double distribution profile after rejecting the Smashlevel from Wednesday’s plan (5949). On Thursday, the market consolidated within Wednesday’s lower distribution—a bearish development in the context of Wednesday’s trend day.
Friday’s session was interesting: it opened below the Weekly Extreme Low of 5815 on a true gap down, within the large gap area from the prior week, ending the weekly one-time framing up in the process. However, no downside follow-through was observed, and the intraday gap was filled. Sellers were active at the gap fill, which ultimately led to the week closing outside the weekly value area, right at the Weekly Extreme Low.

This shortened week, we are closely monitoring whether sellers can follow through to the downside after ending both the daily—and more importantly, the weekly—one-time framing up last week. The weekly has now formed a 2-week balance area, which is our short-term focus. A look at the value areas from the past two weeks shows that sellers are attempting to explore lower prices, away from value. The key question is whether last week’s weakness was driven by stronger sellers—or if this is merely an inventory correction. Friday’s price action suggests that we are not dealing with stronger sellers thus far, which will be discussed in more detail in the daily plan. Generally, a market that is not interested in returning within last week’s value, is targeting the weekly (5741) and daily (5710) gaps, where responsive buying is expected. A failure to attract buyers on a gap fill would be a sign of weakness, opening the door for a traverse of the prior balance area from early May.
The weekly Smashlevel is 5841—the low volume node within the current 2-week balance area. Break and hold above 5841 would target the high volume node at 5908. Acceptance above 5908 would signal strength, opening the door for a move into the resistance area between 5960 and the Weekly Extreme High of 5988, where selling activity can be expected. This resistance area marks the upper end of the current 2-week balance area.
Holding below 5841 would target the 2-week balance low at 5780. Acceptance below 5780 would signal weakness, targeting both the weekly gap at 5741 and the daily gap at 5710—an area to monitor for responsive buying. Failure to attract buyers there would then target the support area between 5678 and the Weekly Extreme Low of 5650, where buying activity can be expected. This support area coincides with a low volume node located between two daily NVPOCs (5678 and 5650)—a pivotal area from the prior balance.
Levels of Interest
In the upcoming week, I will closely observe the behavior around 5841.
Break and hold above 5841 would target 5908 / 5960 / 5988* / 6014 / 6082
Holding below 5841 would target 5780 / 5741-10 / 5678 / 5650* / 5596
*Weekly Extremes. I exercise caution when initiating trades outside the Weekly Extremes to avoid making impulsive decisions at unfavorable locations. Essentially, the Weekly Extremes serve as a safeguard against emotionally-driven trades, a state that is less than ideal for making well-informed trading decisions.
As usual, a detailed daily plan will be published tomorrow. In the meantime, enjoy the rest of your weekend!
Fantastic analysis!
Thank you! HAGW!