
ES Weekly Plan | May 19-23, 2025
Key Levels & Market Context for the Upcoming Week.

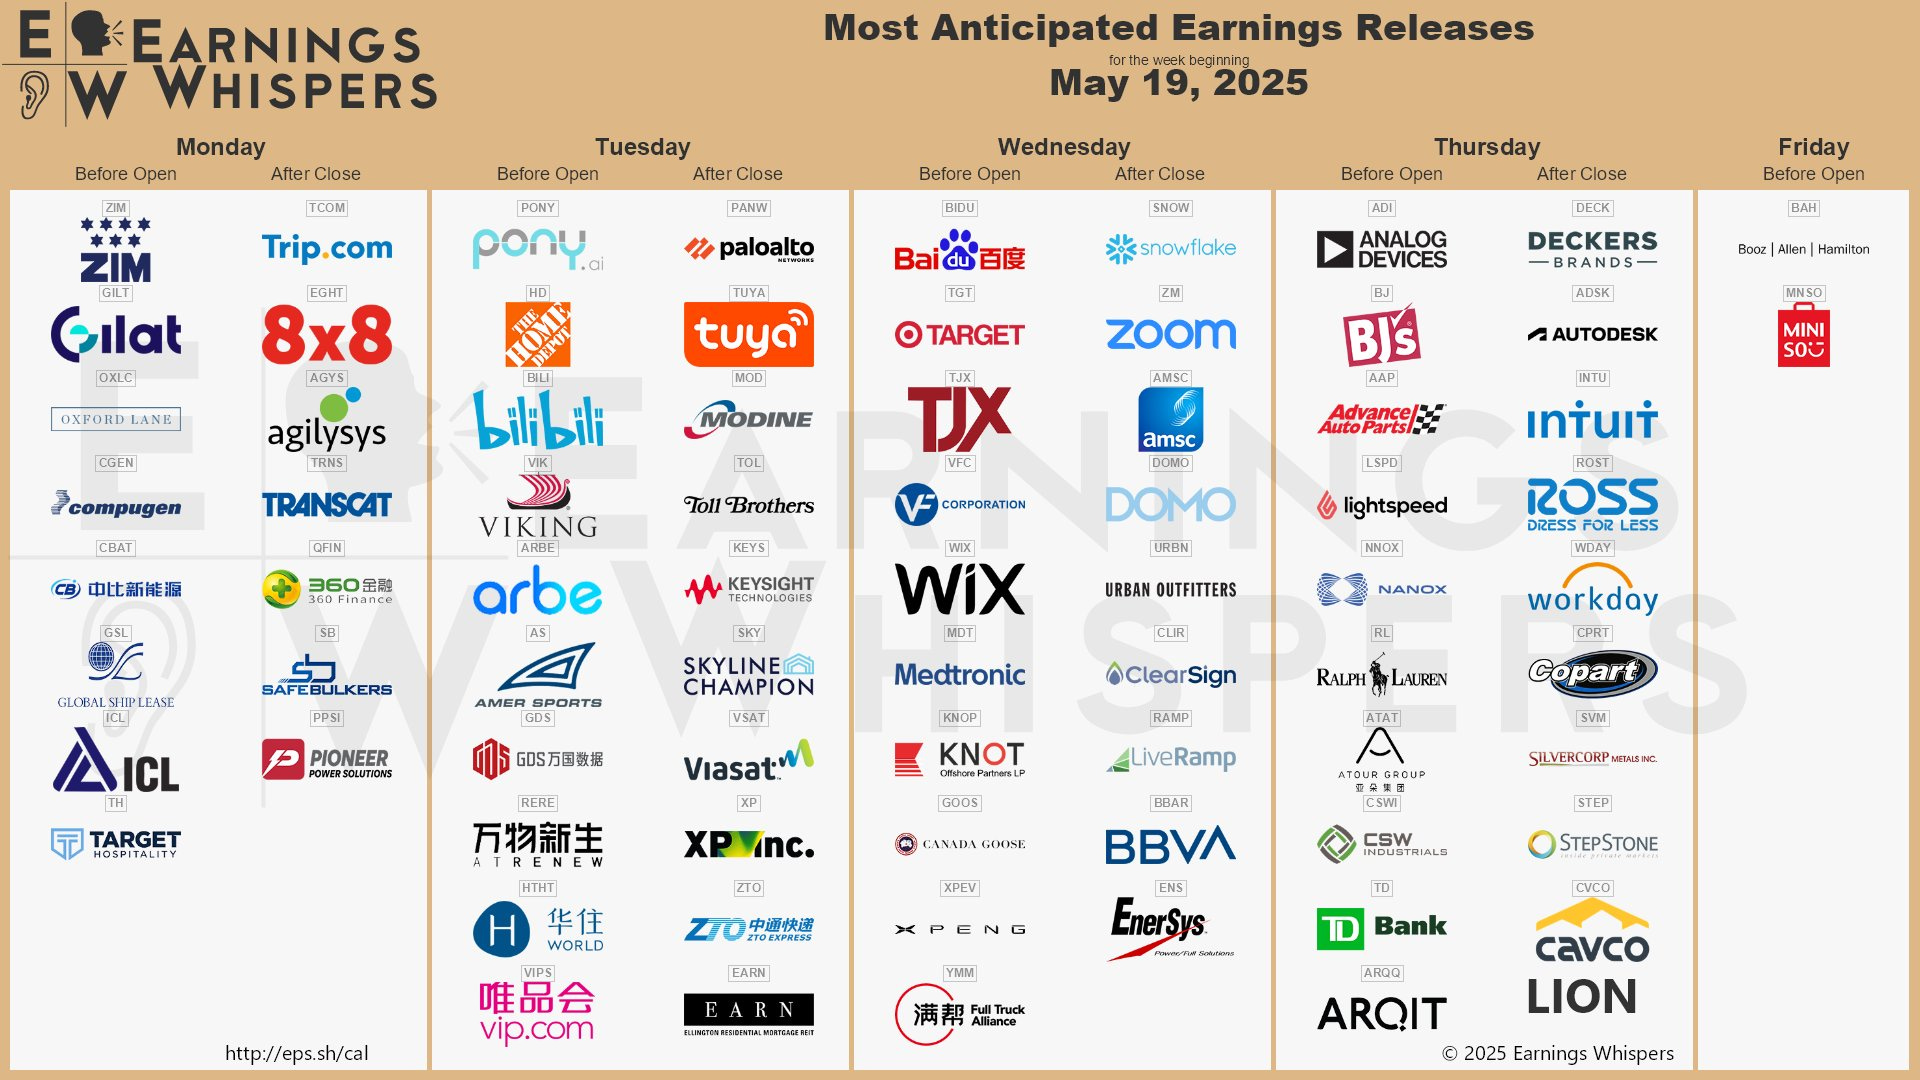
Economic & Earnings Calendar

Visual Representation

Market Structure
🟩 DAILY: OTFU → Ends at: 5924.75
🟩 WEEKLY: OTFU → Ends at: 5805.75
🟨 MONTHLY: BALANCE → TBD
One-time Framing Down (OTFD): A market condition where each subsequent bar forms a lower high, indicating a strong downward trend. The opposite condition, One-time Framing Up (OTFU), occurs when each subsequent bar forms a higher low, indicating a strong upward trend.
Contextual Analysis
Last week, the market kicked off with a true gap up on Monday, opening above the 7-day balance area and forming both a daily gap (5710) and a weekly gap (5741). In the process, the Weekly Extreme High at 5855 was tagged and exceeded. As noted in Tuesday’s daily plan, the VIX closed below its Weekly Extreme Low at 18.69—supporting the move above 5855. The market showed no interest in filling the gap, resulting in upside continuation, with consolidation at higher prices on Tuesday and Wednesday, followed by an outside day up on Thursday.
Friday’s session extended the price exploration higher, tagging and closing above the 2025 opening level at 5967. However, the more interesting sequence unfolded after-hours, following the announcement of Moody’s downgrade of the U.S. credit rating. The resulting 27-handle drop retraced Friday’s initial balance extension—a move to monitor for continuation early in the week. In the bigger picture, two weekly NVPOCs remain below at 5678 and 5550, both of which are of interest in the intermediate term should a potential deeper pullback unfold.

This week, the main focus is on monitoring the market’s reaction to Moody’s downgrade of the U.S. credit rating, announced after hours on Friday, which triggered a 27-handle drop in the post-market session. Since forming a higher low on April 21st, the market has rallied more than 800 handles, with notably shallow pullbacks along the way. The key question now is whether it’s time for a pullback—and if so, where buyers may be in trouble. The most bullish scenario would involve maintaining the weekly one-time framing up, showing no interest in filling last week’s gap, which would favor continued price exploration higher. A less bullish scenario would involve filling or partially filling the gap, but rejecting the prior 7-day balance area. Failure to see a gap-fill reversal and instead finding acceptance back within the multi-day balance would raise questions about last week’s strength.
The weekly Smashlevel is 5967—the 2025 opening level, which was reclaimed on Friday. Holding above 5967 would target the daily NVPOC at 6014. Note the Monthly Extreme High slightly below at 6007. Acceptance above 6014 would signal strength, targeting the resistance area from 6085 to the Weekly Extreme High of 6120, where selling activity can be expected. This resistance area marks the breakdown point from the all-time high (ATH) week.
Break and hold below 5967 would target the high volume node at 5908, marking both the 5D and 20D VPOC. Acceptance below 5908 would signal weakness, targeting the support area from 5850 to the Weekly Extreme Low of 5815, where buying activity can be expected. This support area marks both the lower end of last week’s range and the bottom of the multi-week balance area—a crucial area for buyers to defend. Failure to do so would open the door to filling last week’s gap.
Levels of Interest
In the upcoming week, I will closely observe the behavior around 5967.
Holding above 5967 would target 6014 / 6085 / 6120* / 6166 / 6215
Break and hold below 5967 would target 5908 / 5850 / 5815* / 5741 / 5710
*Weekly Extremes. I exercise caution when initiating trades outside the Weekly Extremes to avoid making impulsive decisions at unfavorable locations. Essentially, the Weekly Extremes serve as a safeguard against emotionally-driven trades, a state that is less than ideal for making well-informed trading decisions.
As usual, a detailed daily plan will be published tomorrow. In the meantime, enjoy the rest of your weekend!
Thank you Smash! The open will be quite interesting.
Outstanding work, brother!👌