
ES Weekly Plan | March 30 - April 3, 2026
Recap, Market Context & Key Levels for the Week Ahead

Welcome to this week’s plan. Inside, you’ll find a quick review of last week’s price action, key economic events, market structure, context for the week ahead, and the levels I’ll be focusing on. Let’s get prepared.
Contents
Last Week in Review
Economic & Earnings Calendar
Market Structure
Contextual Analysis & Plan
Key Levels of Interest
Last Week in Review
Last week’s plan:

The pattern over the last couple of weeks has been early strength followed by late-week weakness, and this week once again repeated the pattern. Monday’s session kicked off with an immediate attempt at downside continuation that failed below the Monthly Extreme Low at 6511 after a significant news-driven move higher overnight, which came 7 handles shy of the weekly resistance area between 6755 and 6785. The HTF level at 6692 then capped the upside in the RTH session, marking the high of the week.
Last week, we discussed locations that were unfavorable to chase shorts (below 6511) and that better short opportunities would occur if the market saw an immediate rally, attempted to reclaim a key resistance area, and then failed. Late sellers got smashed below 6511, while patient traders found better trade locations higher to reload.
Tuesday opened on a true gap down, which was filled during the session, while Wednesday opened on a true gap up that was also filled. Wednesday’s true gap provided an excellent look-above-and-fail setup from an order flow perspective when buyers failed above the overnight high (see Figure 1).
Figure 1
Heading into Thursday, the auction was in a 5-day balance, and we noted in the plan that both the 5D and 20D VPOCs had converged within Wednesday’s range. The market was coiling for a directional move, as such moves are often initiated from high volume nodes.
Sellers triggered a directional move on Thursday, forming a double distribution trend day to the downside. This was followed by another double distribution trend day on Friday, following a sustained true gap down.
Friday’s session closed 295 handles below the Monthly VWAP and 223 handles below the most traded price by volume (VPOC) for the week at 6635. Additionally, the Monthly Extreme Low at 6511 was breached. Trading well below these value references and extremes creates a very complex situation in the short-term. Even though sellers are firmly in control of the auction across all time frames, it’s not optimal to chase shorts. That said, if early attempts at downside continuation fail, a short-covering rally could be triggered, reflecting an inventory correction. Stay nimble.
Last Week’s Levels in Review
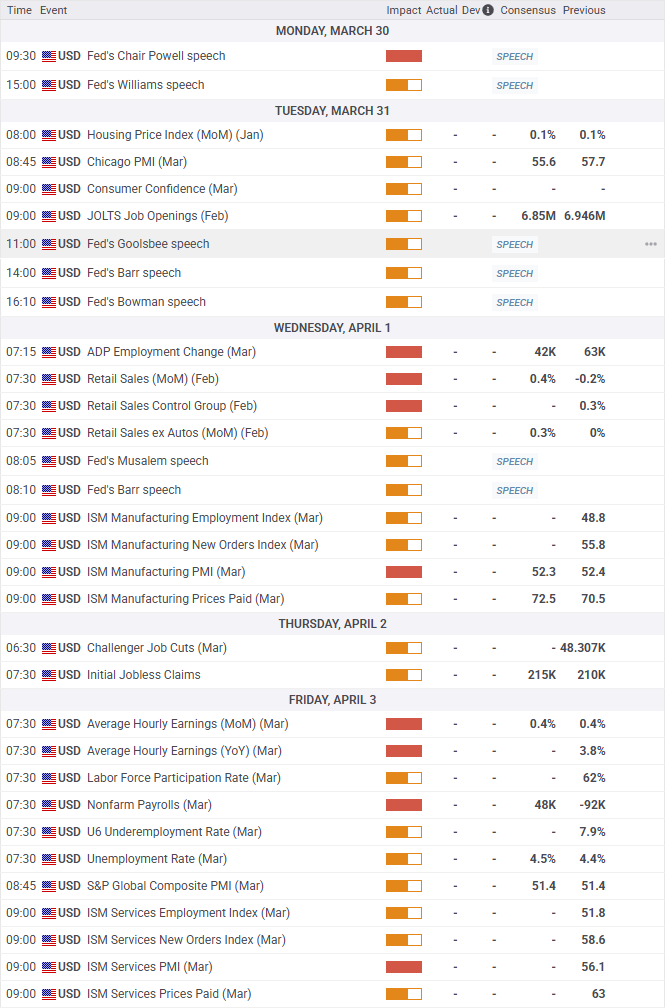
Economic & Earnings Calendar
Central Standard Time
Earnings Whispers

Market Structure
🟥 Daily: OTFD → Ends at: 6495.75
🟥 Weekly: OTFD → Ends at: 6704.75
🟥 Monthly: OTFD → Ends at: 6911.25
Balance: A market condition where price consolidates within a defined range, reflecting indecision as the market awaits more market-generated information. We apply balance guidelines—favoring fade trades at range extremes (highs/lows) and preparing for breakout setups if balance resolves.
One-Time Framing Up (OTFU): A market condition where each subsequent bar forms a higher low, signaling a strong upward trend.
One-Time Framing Down (OTFD): A market condition where each subsequent bar forms a lower high, signaling a strong downward trend.
Contextual Analysis & Plan
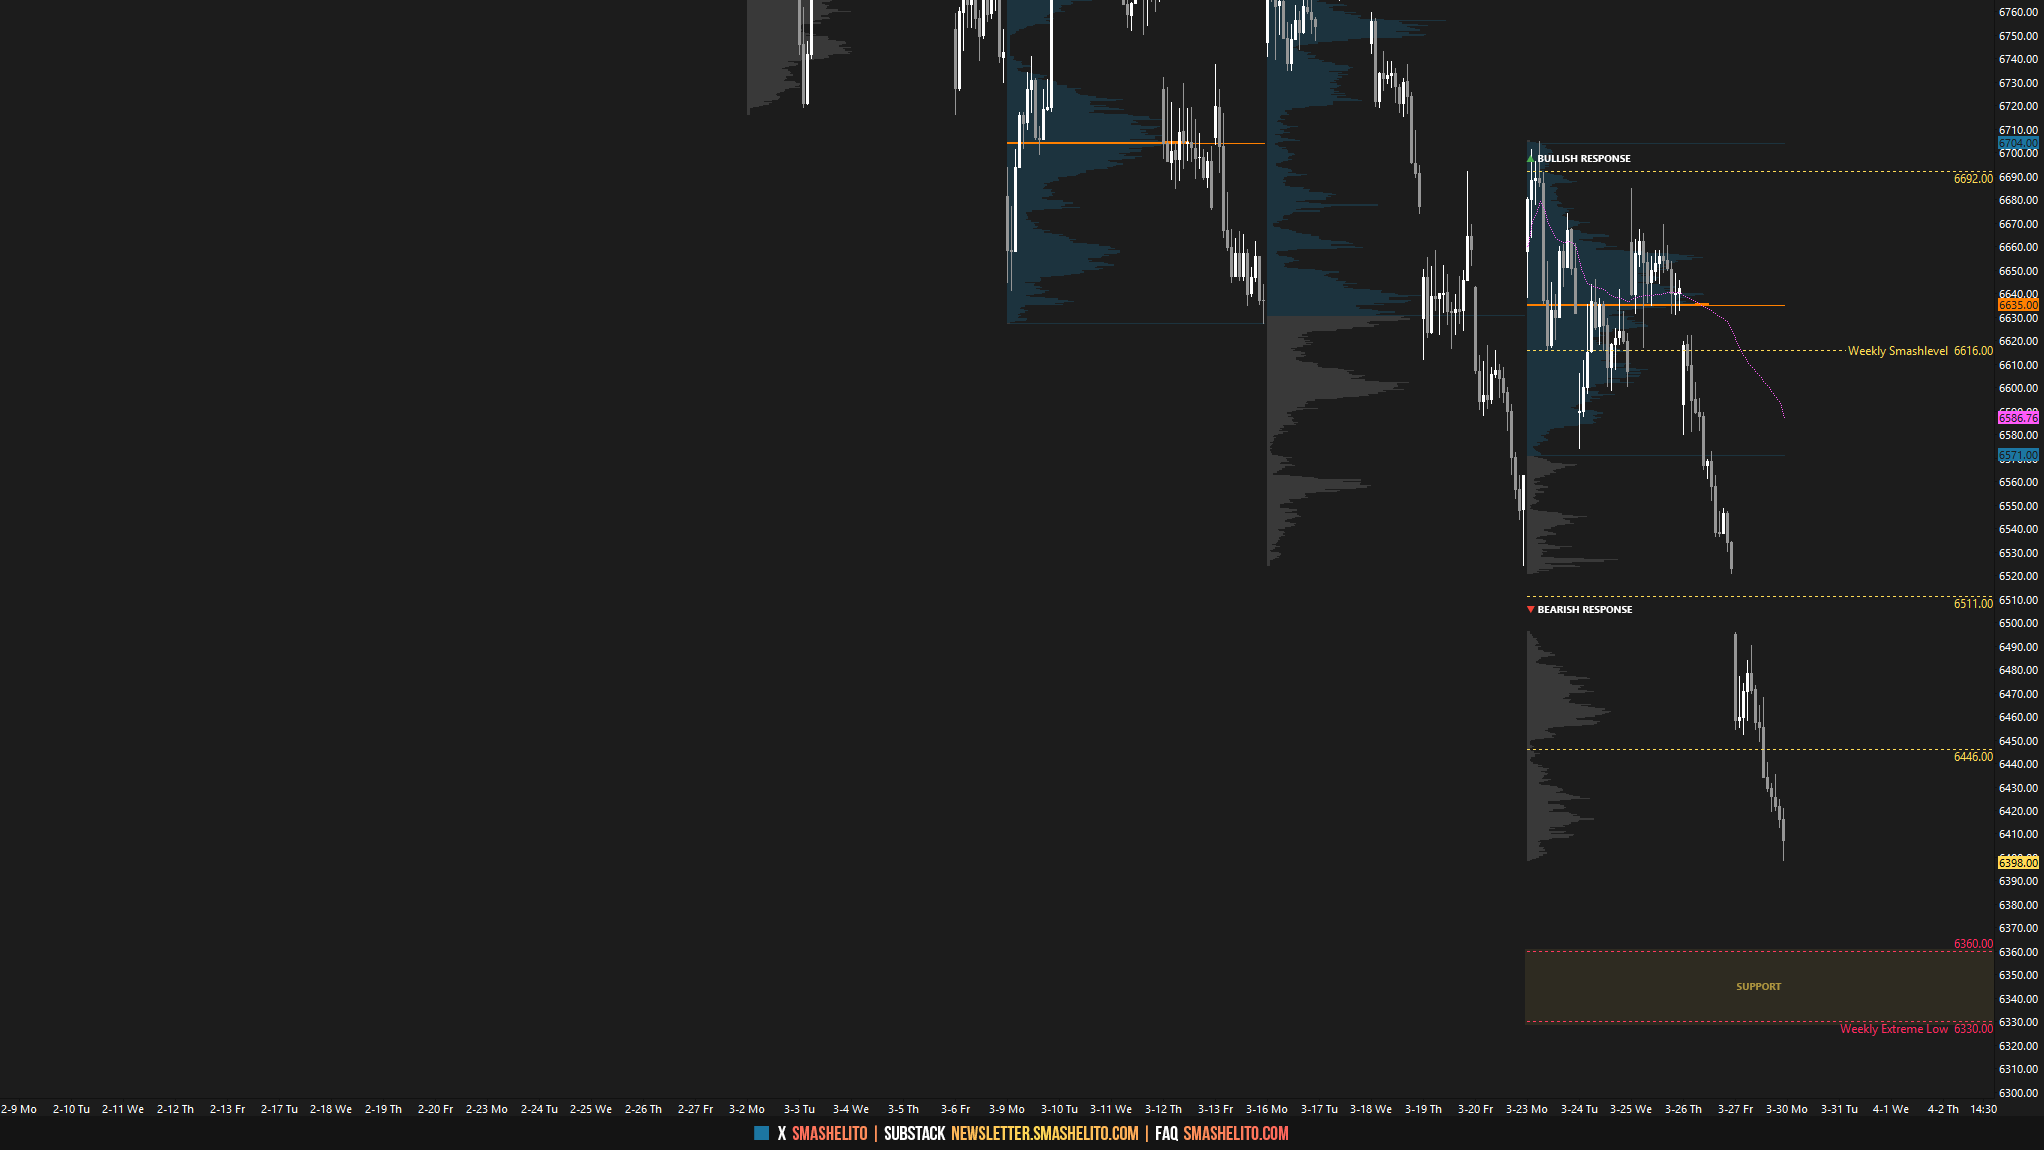
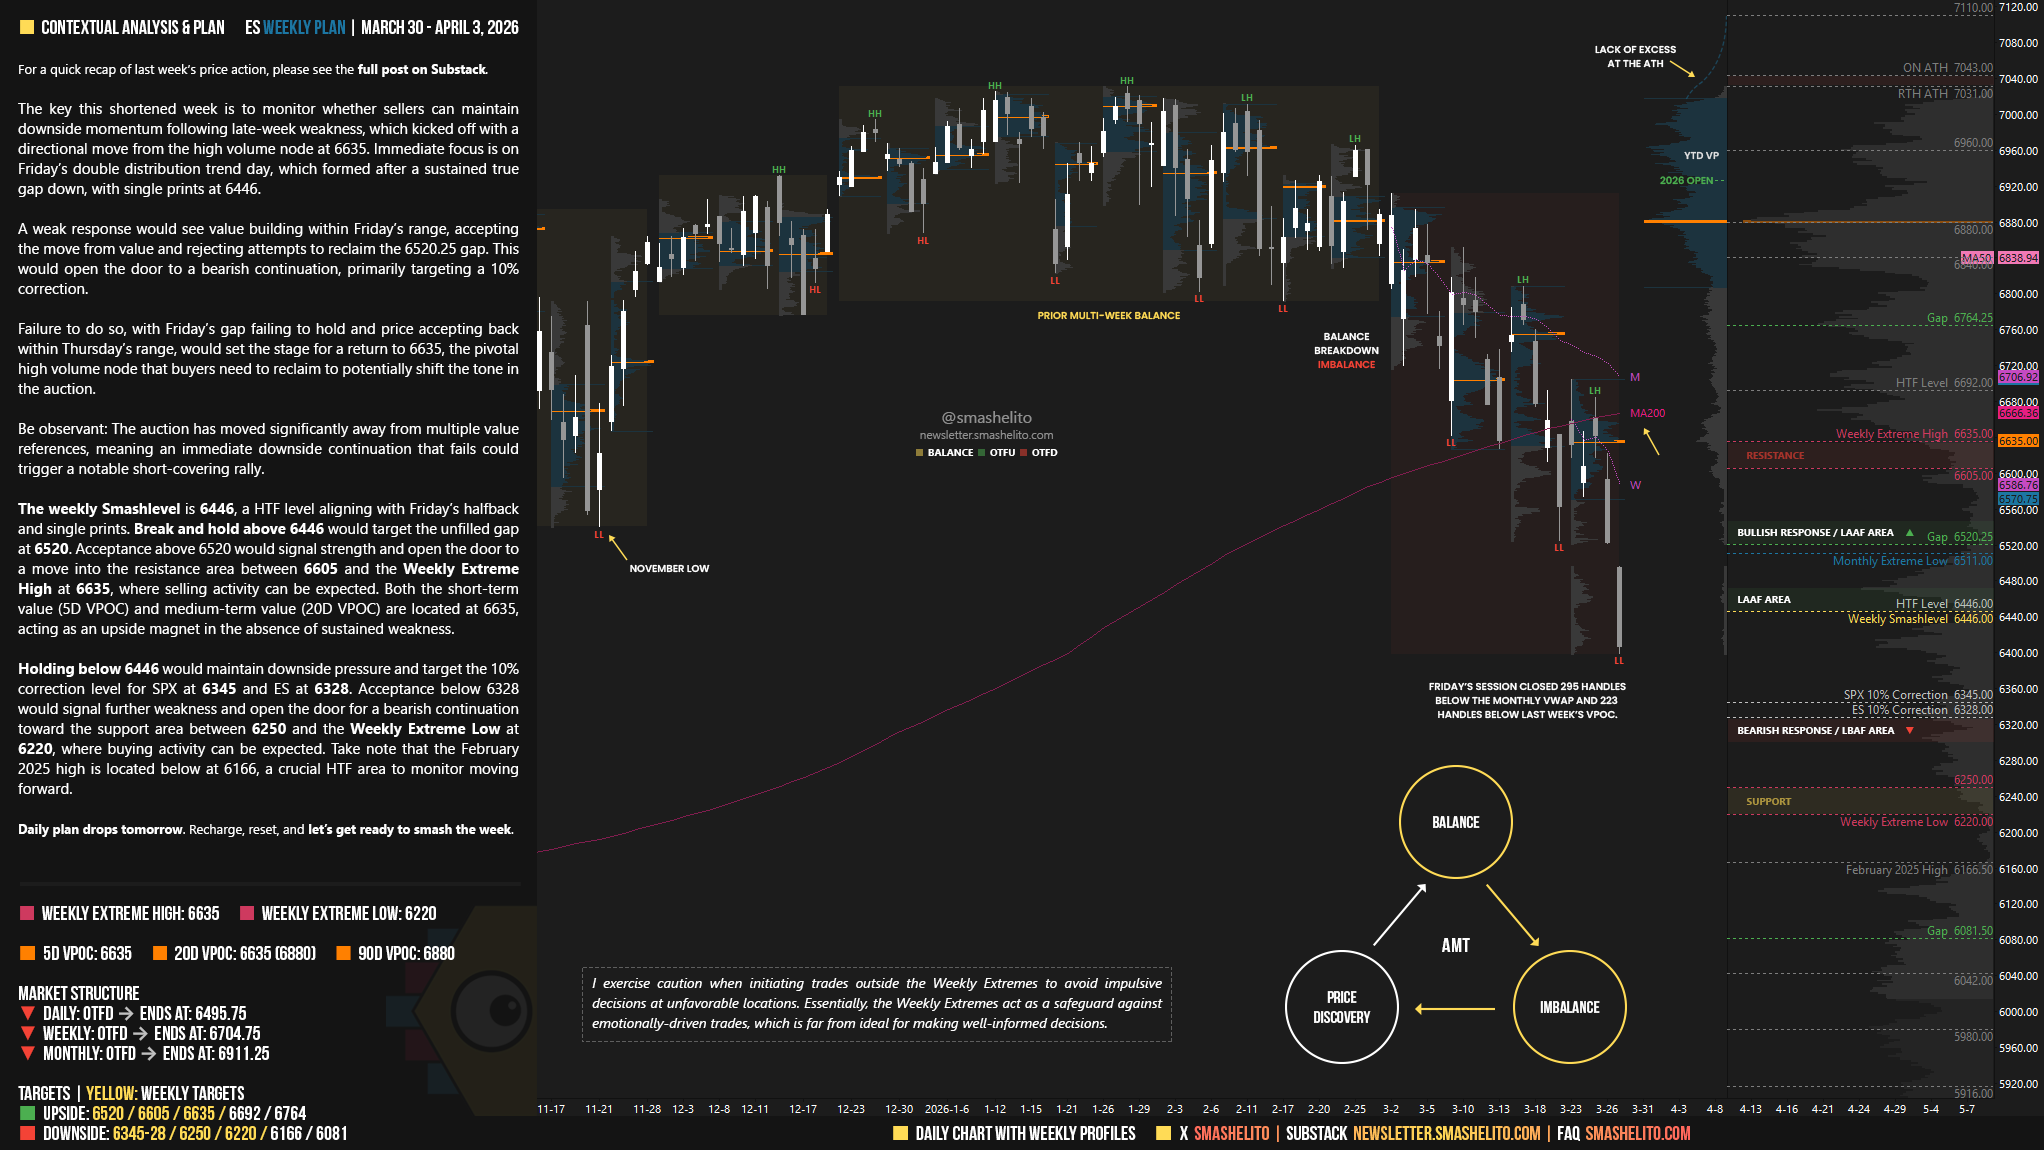
The key this shortened week is to monitor whether sellers can maintain downside momentum following late-week weakness, which kicked off with a directional move from the high volume node at 6635. Immediate focus is on Friday’s double distribution trend day, which formed after a sustained true gap down, with single prints at 6446.
A weak response would see value building within Friday’s range, accepting the move from value and rejecting attempts to reclaim the 6520.25 gap. This would open the door to a bearish continuation, primarily targeting a 10% correction.
Failure to do so, with Friday’s gap failing to hold and price accepting back within Thursday’s range, would set the stage for a return to 6635, the pivotal high volume node that buyers need to reclaim to potentially shift the tone in the auction.
Be observant: The auction has moved significantly away from multiple value references, meaning an immediate downside continuation that fails could trigger a notable short-covering rally.
The weekly Smashlevel is 6446, a HTF level aligning with Friday’s halfback and single prints. Break and hold above 6446 would target the unfilled gap at 6520. Acceptance above 6520 would signal strength and open the door to a move into the resistance area between 6605 and the Weekly Extreme High at 6635, where selling activity can be expected. Both the short-term value (5D VPOC) and medium-term value (20D VPOC) are located at 6635, acting as an upside magnet in the absence of sustained weakness.
Holding below 6446 would maintain downside pressure and target the 10% correction level for SPX at 6345 and ES at 6328. Acceptance below 6328 would signal further weakness and open the door for a bearish continuation toward the support area between 6250 and the Weekly Extreme Low at 6220, where buying activity can be expected. Take note that the February 2025 high is located below at 6166, a crucial HTF area to monitor moving forward.
Key Levels of Interest
In the upcoming week, I will closely observe the behavior around 6446.
Break and hold above 6446 would target 6520 / 6605 / 6635* / 6692 / 6764
Holding below 6446 would target 6345-28 / 6250 / 6220* / 6166 / 6081
*Weekly Extremes (defined by proprietary models). I exercise caution when initiating trades outside the Weekly Extremes to avoid impulsive decisions at unfavorable locations. Essentially, the Weekly Extremes act as a safeguard against emotionally-driven trades, which is far from ideal for making well-informed decisions.
Daily plan drops tomorrow. Recharge, reset, and let’s get ready to smash the week.
Thank you Smash
Thank you Smash!