
ES Daily Plan | March 26, 2026
Market Context & Key Levels for the Day Ahead

— For new subscribers
The yellow levels highlighted at the bottom left of the chart are the primary intraday levels I focus on. To avoid impulsive decisions at poor trade locations, I follow a simple but effective rule: exercise caution when initiating trades outside of these yellow levels.
This means I’m cautious about chasing longs above the Final Upside Target (FUT) and shorts below the Final Downside Target (FDT). It’s important to understand that not chasing does not imply initiating a trade in the opposite direction — discipline over impulse.
Be sure to review the Weekly Plan for a broader perspective, key levels, and market expectations for the week ahead.

Contextual Analysis & Plan
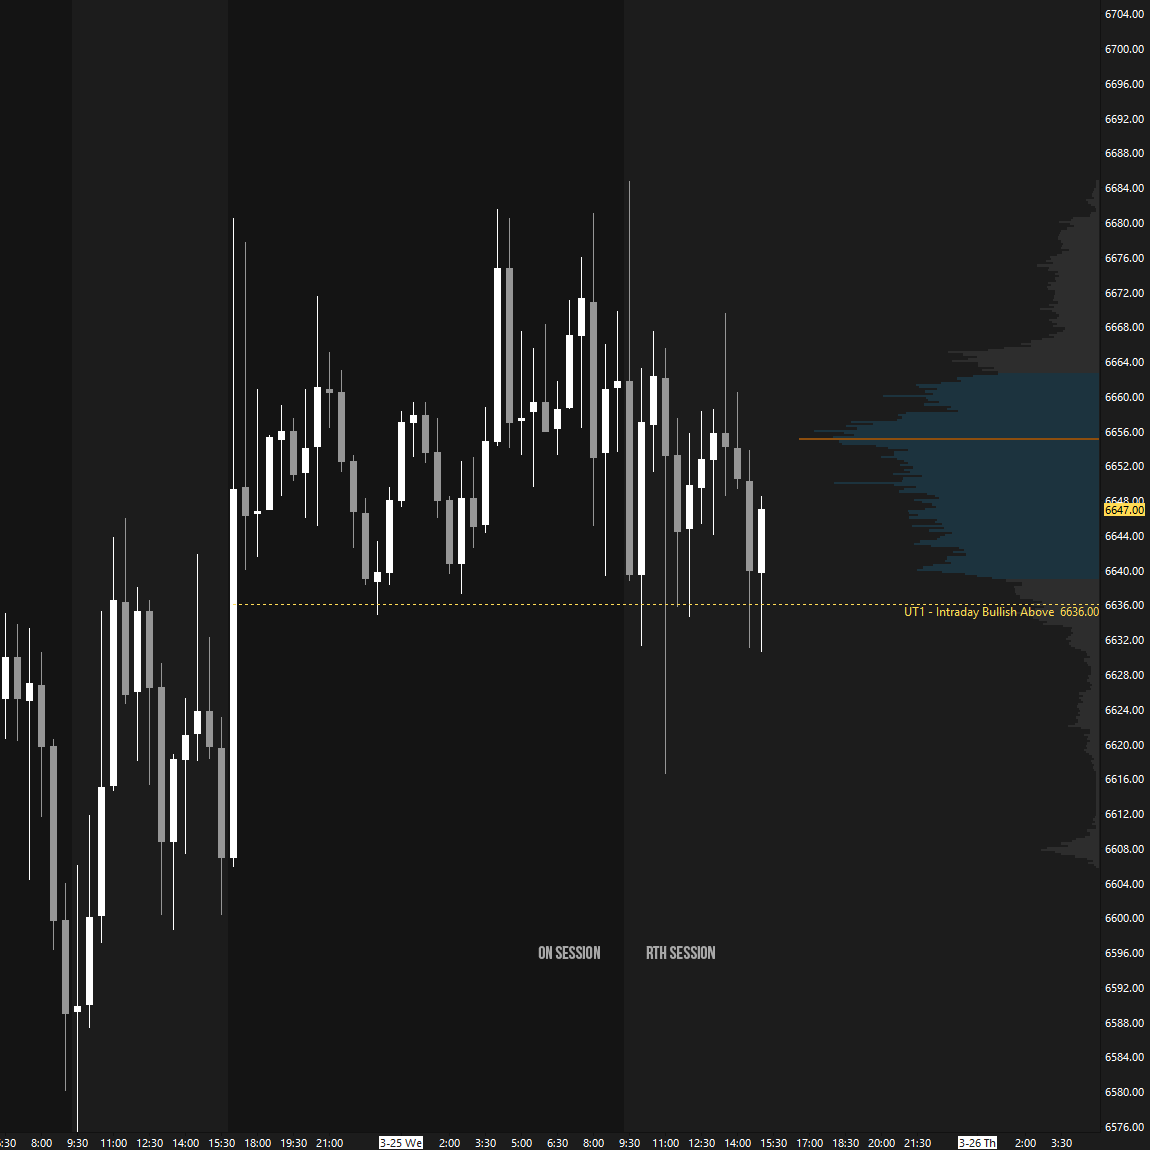
Technical issues have been resolved, and hopefully they stay that way. Yesterday after-hours, a massive news-driven move to the upside traversed Monday’s value area before selling activity stepped in. Whenever we get these types of moves, like we did Monday pre-market, the auction tends to digest the move, making trading conditions a bit tricky. Those who missed the move try to join with big expectations of immediate continuation, while others are shorting in hopes that the move gets retraced. In the end, both camps are left disappointed, as the market simply consolidated. Overnight, a distribution formed above Tuesday’s value area, with buyers defending UT1 at 6636. As the plan noted, “Intraday strength would be indicated by a reclaim of 6636.” This level ended up being pivotal during today’s full session (see Figure 1).
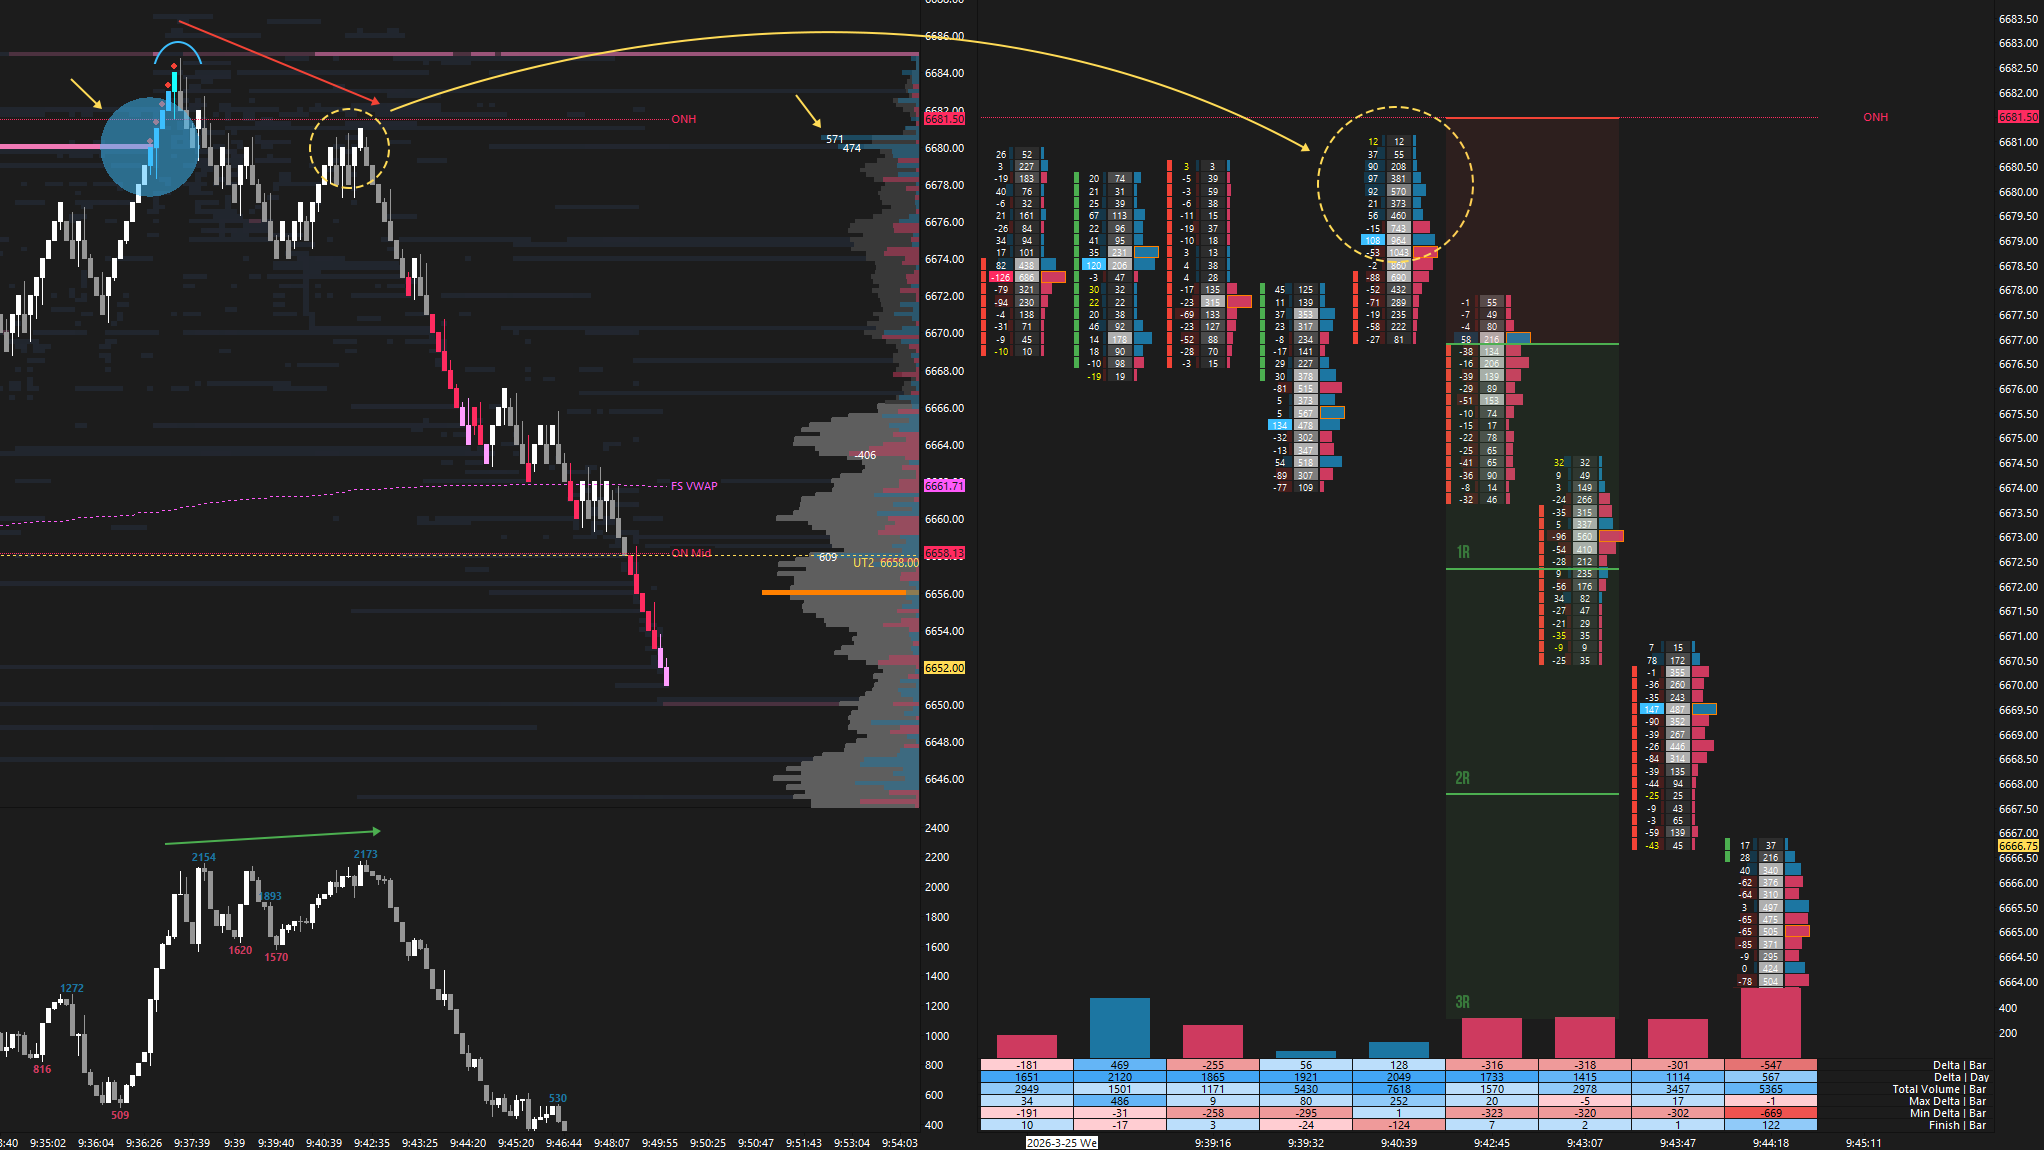
The RTH session opened on a true gap up, and the auction immediately showed strength, testing the overnight high (ONH) at 6681. Regular readers of this newsletter know that a failure above the ONH is a solid fade setup when gapping higher, a sequence that generally triggers an inventory correction. What made this setup interesting today was that the ONH was at 6681, just 11 handles shy of the FDT at 6692. This means that if you were not already in a position, the risk-reward profile for chasing an ONH breakout was unappealing.
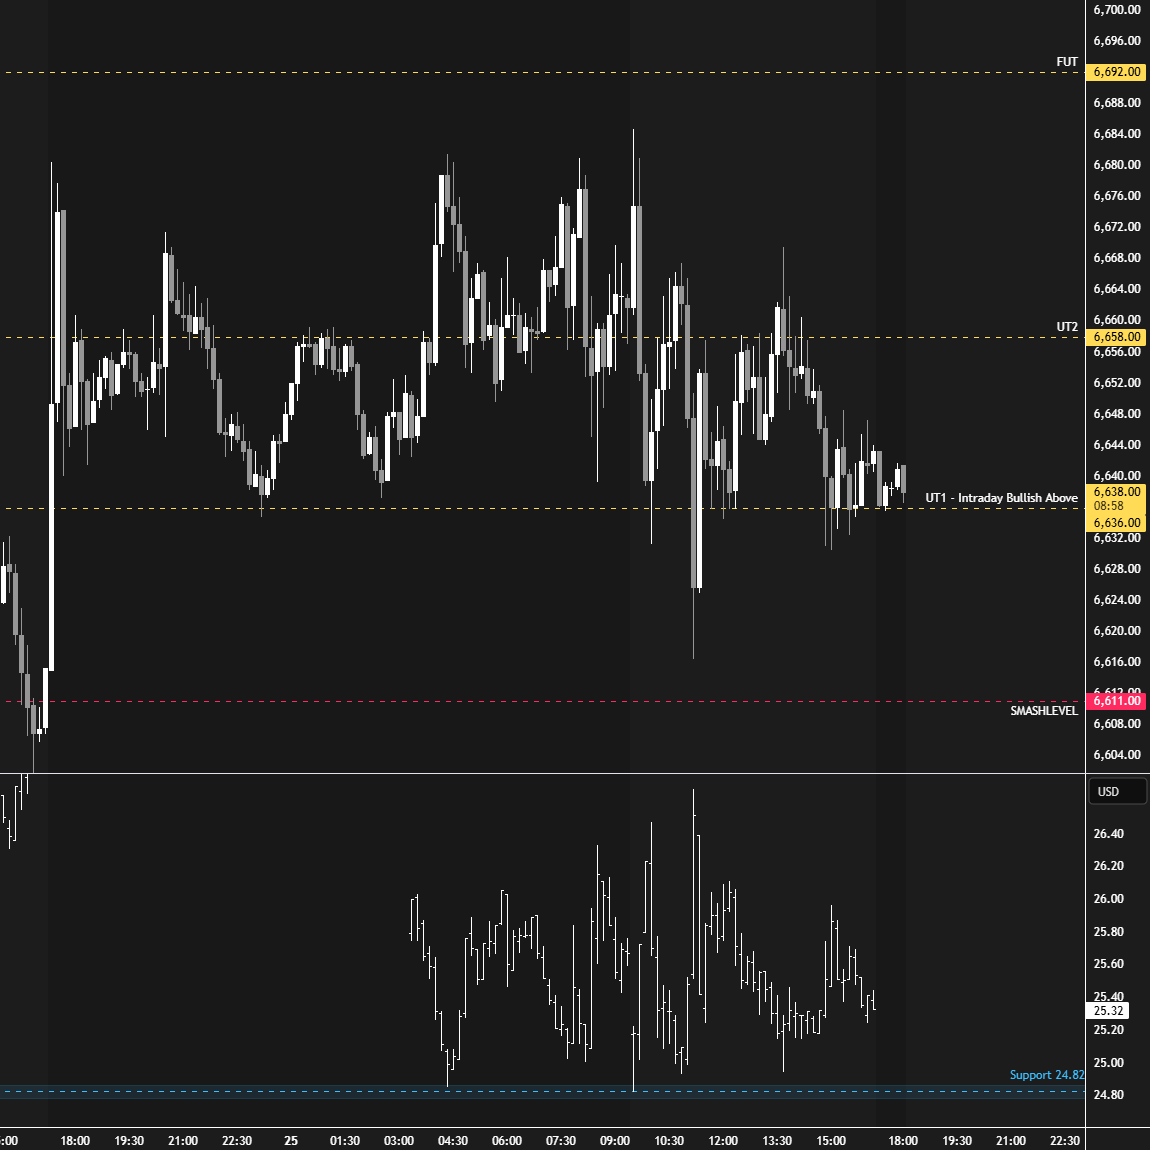
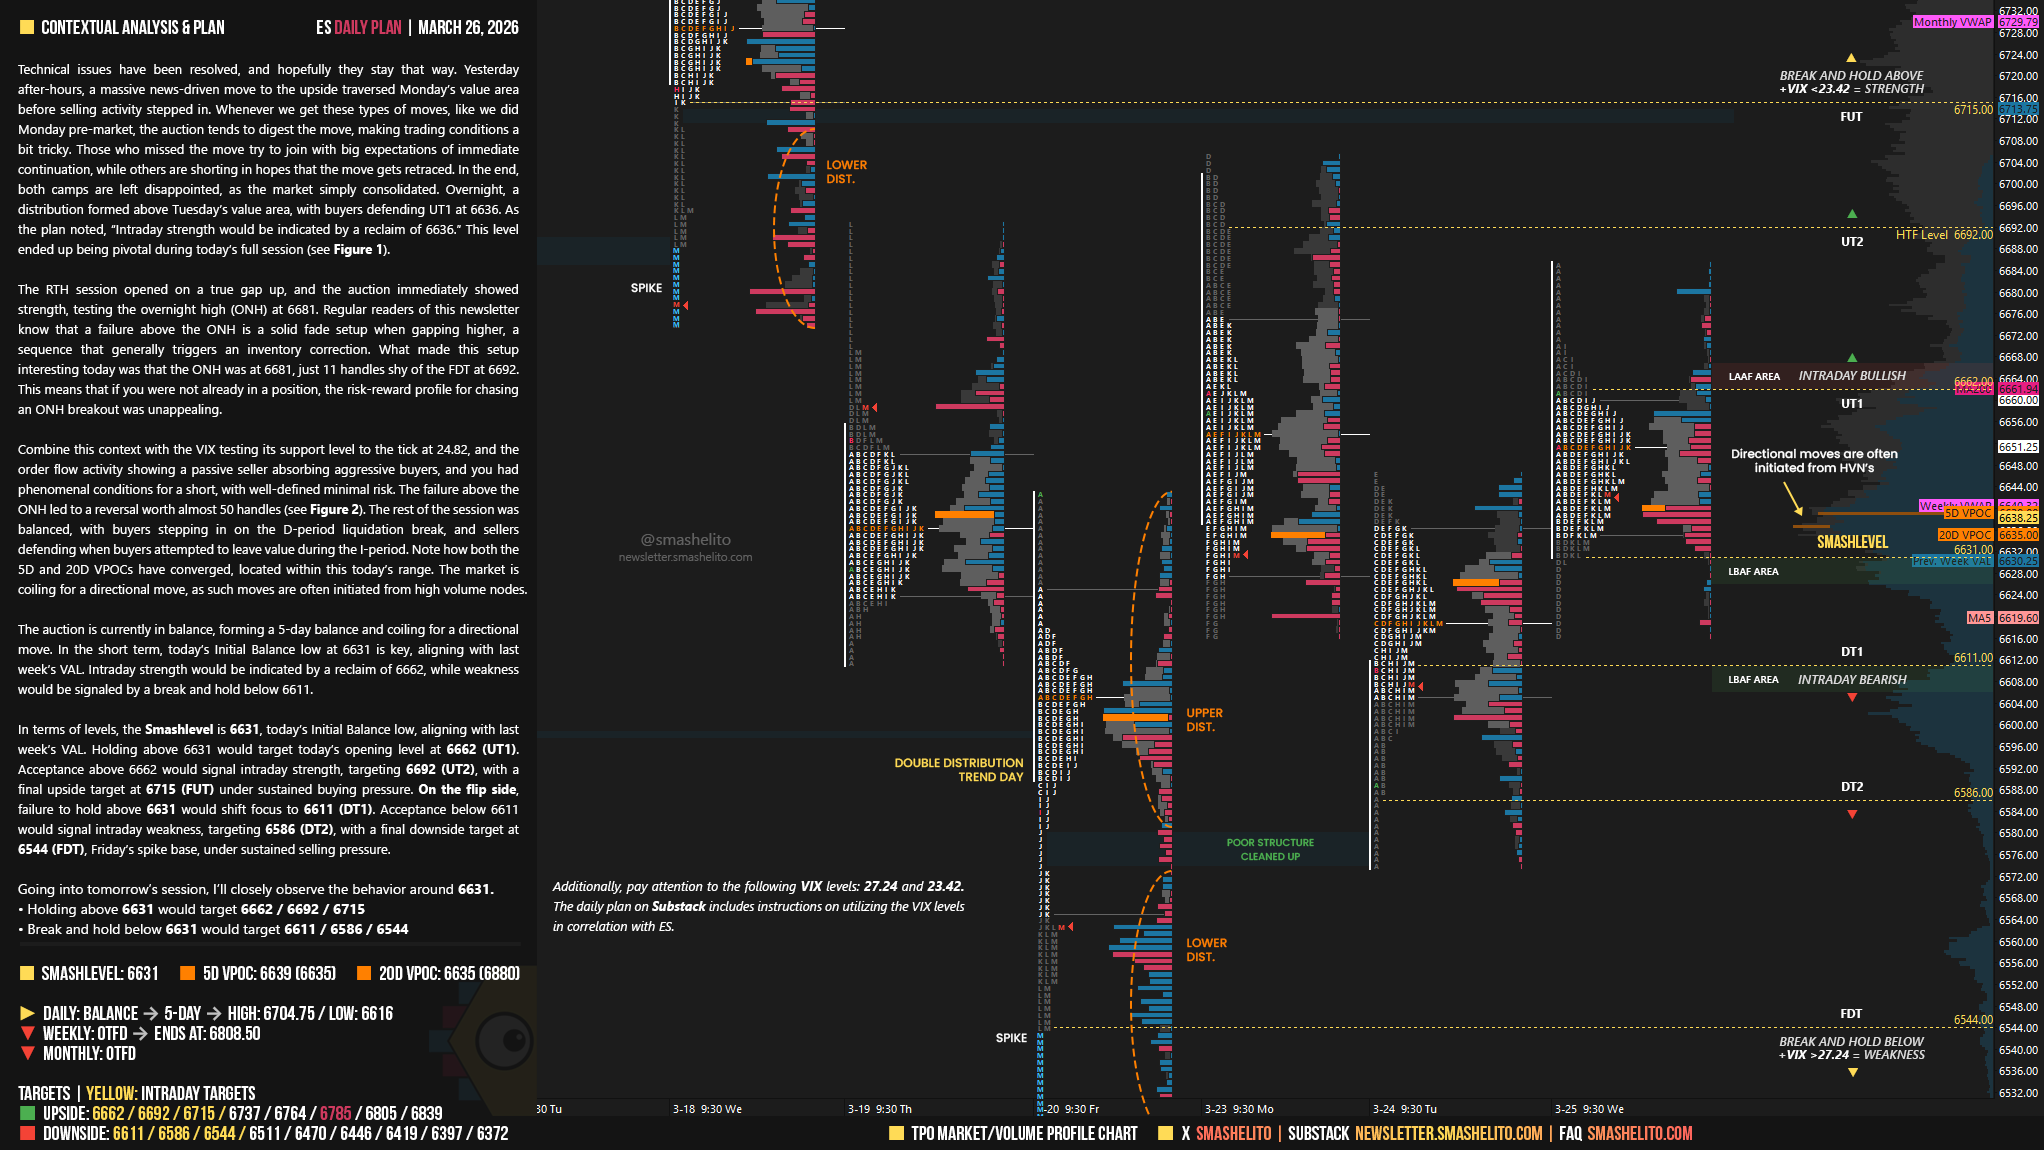
Combine this context with the VIX testing its support level to the tick at 24.82, and the order flow activity showing a passive seller absorbing aggressive buyers, and you had phenomenal conditions for a short, with well-defined minimal risk. The failure above the ONH led to a reversal worth almost 50 handles (see Figure 2). The rest of the session was balanced, with buyers stepping in on the D-period liquidation break, and sellers defending when buyers attempted to leave value during the I-period. Note how both the 5D and 20D VPOCs have converged, located within this today’s range. The market is coiling for a directional move, as such moves are often initiated from high volume nodes.
The auction is currently in balance, forming a 5-day balance and coiling for a directional move. In the short term, today’s Initial Balance low at 6631 is key, aligning with last week’s VAL. Intraday strength would be indicated by a reclaim of 6662, while weakness would be signaled by a break and hold below 6611.
In terms of levels, the Smashlevel is 6631, today’s Initial Balance low, aligning with last week’s VAL. Holding above 6631 would target today’s opening level at 6662 (UT1). Acceptance above 6662 would signal intraday strength, targeting 6692 (UT2), with a final upside target at 6715 (FUT) under sustained buying pressure.
On the flip side, failure to hold above 6631 would shift focus to 6611 (DT1). Acceptance below 6611 would signal intraday weakness, targeting 6586 (DT2), with a final downside target at 6544 (FDT), Friday’s spike base, under sustained selling pressure.
Levels of Interest
Going into tomorrow’s session, I’ll closely observe the behavior around 6631.
Holding above 6631 would target 6662 / 6692 / 6715
Break and hold below 6631 would target 6611 / 6586 / 6544
Additionally, pay attention to the following VIX levels: 27.24 and 23.42. These levels can provide confirmation of strength or weakness.
Break and hold above 6715 with VIX below 23.42 would confirm strength.
Break and hold below 6544 with VIX above 27.24 would confirm weakness.
Overall, it's important to exercise caution when trading outside of the highlighted yellow levels. A non-cooperative VIX may suggest possible reversals i.e trade setups.
I’m new and need time to backtest but you nailed today.
Thanks smash for everything, have a great session tomorrow, GO FOR IT!