
ES Weekly Plan | March 3-7, 2025
Key Levels & Market Context for the Upcoming Week.

Economic Calendar

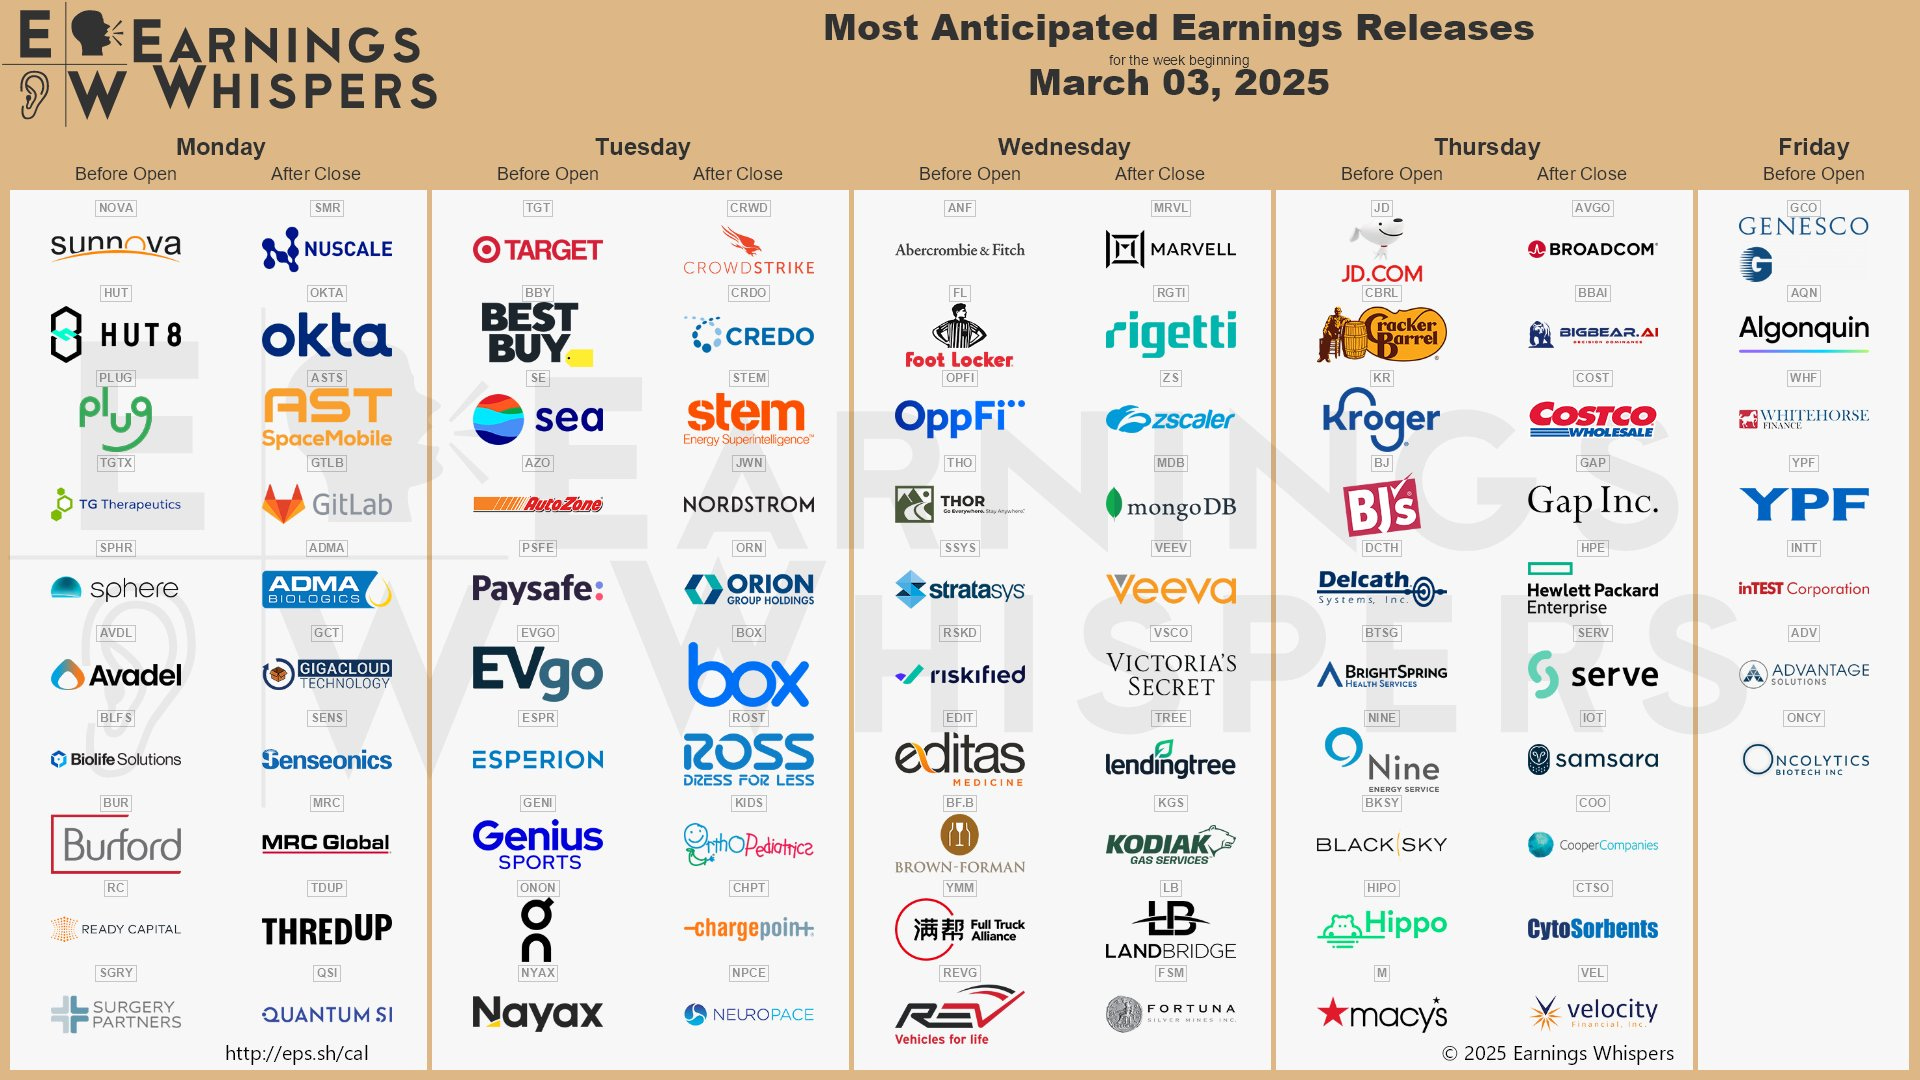
Earnings Calendar
Visual Representation

Market Structure
🟥 DAILY: OTFD | Ends: 5971
🟨 WEEKLY: BALANCE | 11W | 6166.50-5813
🟩 MONTHLY: OTFU | Ends: 5848
Contextual Analysis
Last week, the focus was on whether sellers could sustain the downside momentum after the notable multi-distribution trend day on February 21st. Monday’s session delivered an immediate continuation lower, breaking the key 6025 level in the process. On Tuesday, downside pressure continued early on, but buyers managed to bounce back after forming an excess low. The daily one-time framing down ended on Wednesday; however, failure to reclaim the 6025 level ultimately led to a continuation lower on Thursday, during which the unfilled daily gap at 5909.75—our primary downside target for some time—was filled. In the process, the Weekly Extreme Low at 5900 was tagged and exceeded. Friday’s session was notable, as it tested 5858 (the 5% correction level), established an excess low, and closed out with a vicious short-covering rally. The extent to which the closing spike is filled on the pullback, if at all, will provide valuable market-generated information moving forward.

For this week, the main focus early on will be monitoring whether the market accepts or rejects Friday’s closing strength. The closing session triggered a notable M-period spike higher, returning to the weekly VPOC, after forming an excess low near 5858—the 5% correction level. The key question now is whether a short-term low has formed. A weak market would reject Friday’s closing strength by retracing the spike and finding acceptance back within Friday’s value area, opening the door for a test of Friday’s excess low and potentially the January lows. Failure to do so—meaning the market struggles to fill the spike area or only partially fills it—would signal short-term strength.
The weekly Smashlevel is 5920/10, representing Friday’s M-period spike base and halfback, respectively. Holding above 5920/10 signals acceptance of Friday’s closing strength, targeting the 2025 opening level at 5967, which is closely aligned with the 5D VPOC at 5966. Break and hold above 5967 would target last week’s pivot at 6025, closely aligning with both the 2025 VWAP and the anchored VWAP from the 2025 low. Acceptance above 6025 signals strength, targeting the resistance area from 6075 to the Weekly Extreme High of 6105, where selling activity can be expected.
Break and hold below 5920/10 signals weakness, targeting the support area from 5845 to the Weekly Extreme Low of 5815, where buying activity can be expected. This support area is crucial for buyers to defend, as it marks both the low of the multi-week balance and the yearly low. Notably, NQ broke its January low but reclaimed it by Friday—another break could pull ES lower for a similar test.
As usual, a detailed daily plan will be published tomorrow. In the meantime, enjoy the rest of your weekend!
Levels of Interest
In the upcoming week, I will closely observe the behavior around 5920/10.
Holding above 5920/10 would target 5967 / 6025 / 6075 / 6105* / 6136
Break and hold below 5920/10 would target 5858 / 5845 / 5815* / 5780 / 5721
*Weekly Extremes. I exercise caution when initiating trades outside the Weekly Extremes to avoid making impulsive decisions at unfavorable locations. Essentially, the Weekly Extremes serve as a safeguard against emotionally-driven trades, a state that is less than ideal for making well-informed trading decisions.
Thanks, HAGW!
Thank you very much!