
ES Weekly Plan | June 22-26, 2026
Recap, Market Context & Key Levels for the Week Ahead

Welcome to this week’s plan. Inside, you’ll find a quick review of last week’s price action, key economic events, market structure, context for the week ahead, and the levels I’ll be focusing on. Let’s get prepared.
Contents
Last Week in Review
Economic & Earnings Calendar
Market Structure
Contextual Analysis & Plan
Key Levels of Interest
Last Week in Review
Last week’s plan:

Last week, we transitioned to the ESU26 (September) contract. As a reminder, my charts are not back-adjusted, meaning historical prices remain unchanged, resulting in a visible roll gap. This is a matter of personal preference, as both approaches have their pros and cons. For short-term traders, the impact is typically minimal since we focus on the auction one day at a time.
A peace deal triggered Monday’s session to open on a true gap up, tagging the non-back-adjusted ATH and the Weekly Extreme High at 7635 in the process. Completing the weekly targets as early as Monday typically makes the rest of the week very tricky to trade.
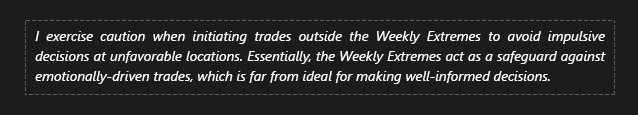
In the plan for Tuesday, we discussed how acceptance above 7635 was not favorable for fading, while failure to do so could open the door to a pullback. The tricky part was that even a sizable pullback would not necessarily be meaningfully bearish. Tuesday’s HOD was 7636.75, from which a pullback unfolded, as aggressive buyers were ultimately absorbed by passive sellers (see Figure 1).
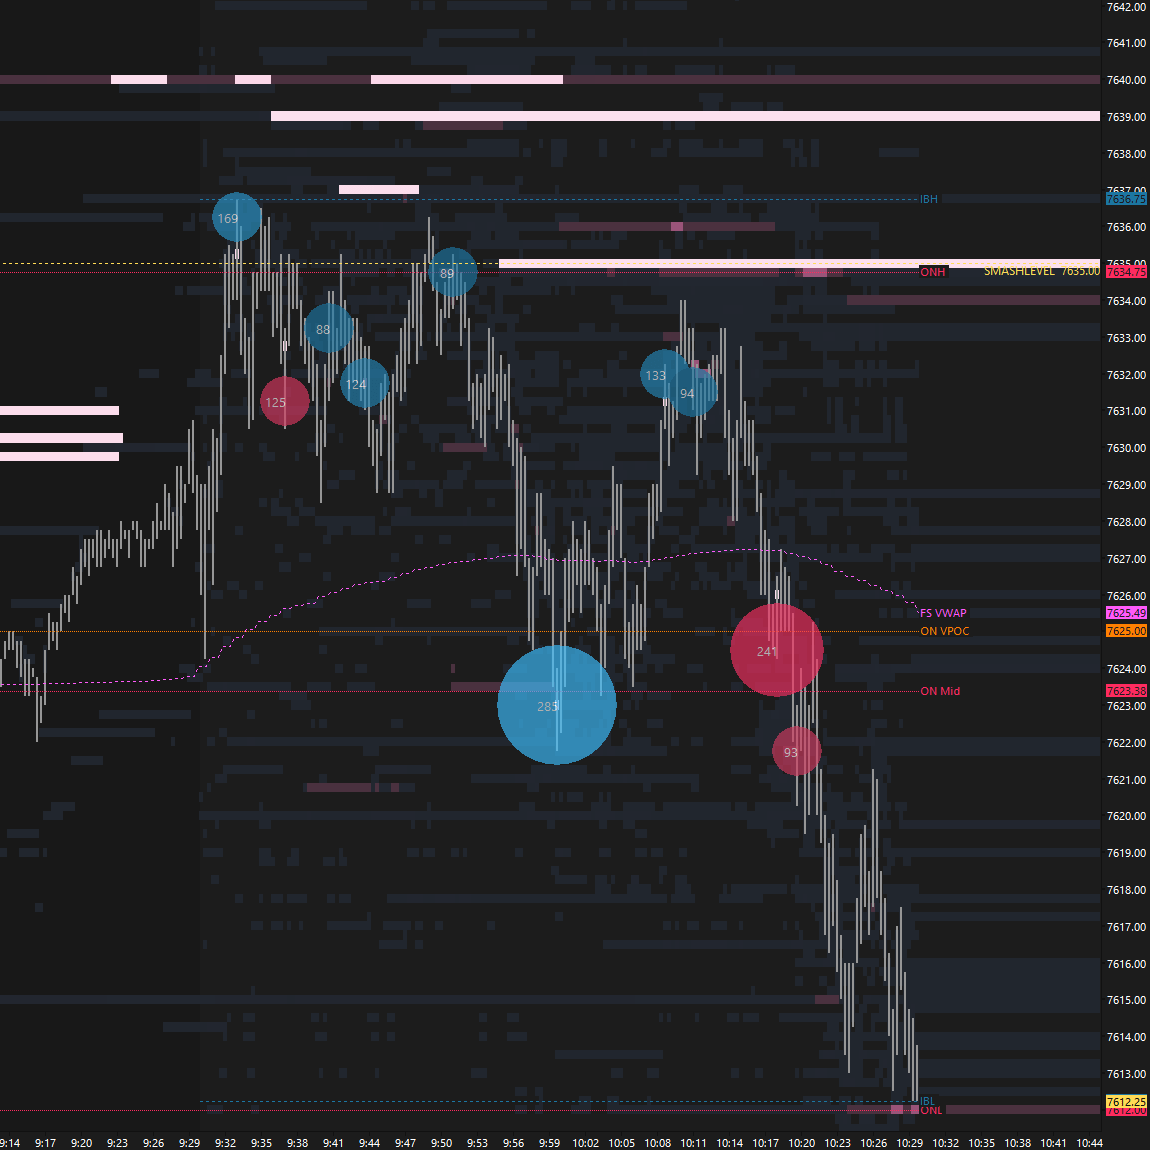
The daily structure of lower highs and lower lows continued on Wednesday. Following the FOMC meeting, the session closed weak, tagging the weekly Smashlevel at 7481 in the process. On Thursday, an inside day was established after rejecting Wednesday’s closing weakness (see Figure 2). The inside day now serves as the key short-term reference.
Last Week’s Levels in Review
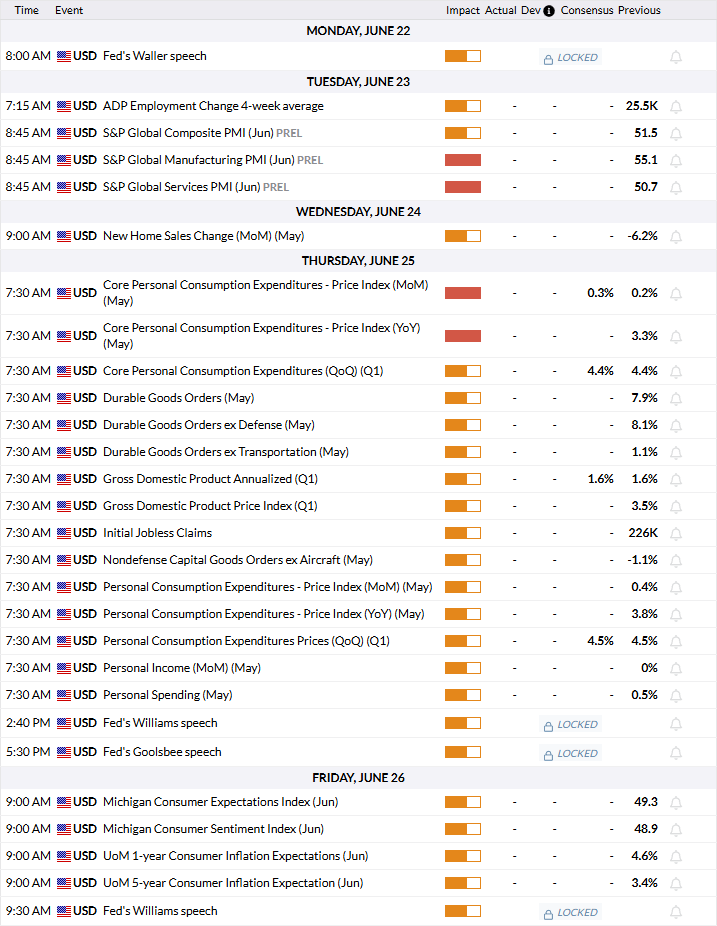
Economic & Earnings Calendar
Central Standard Time
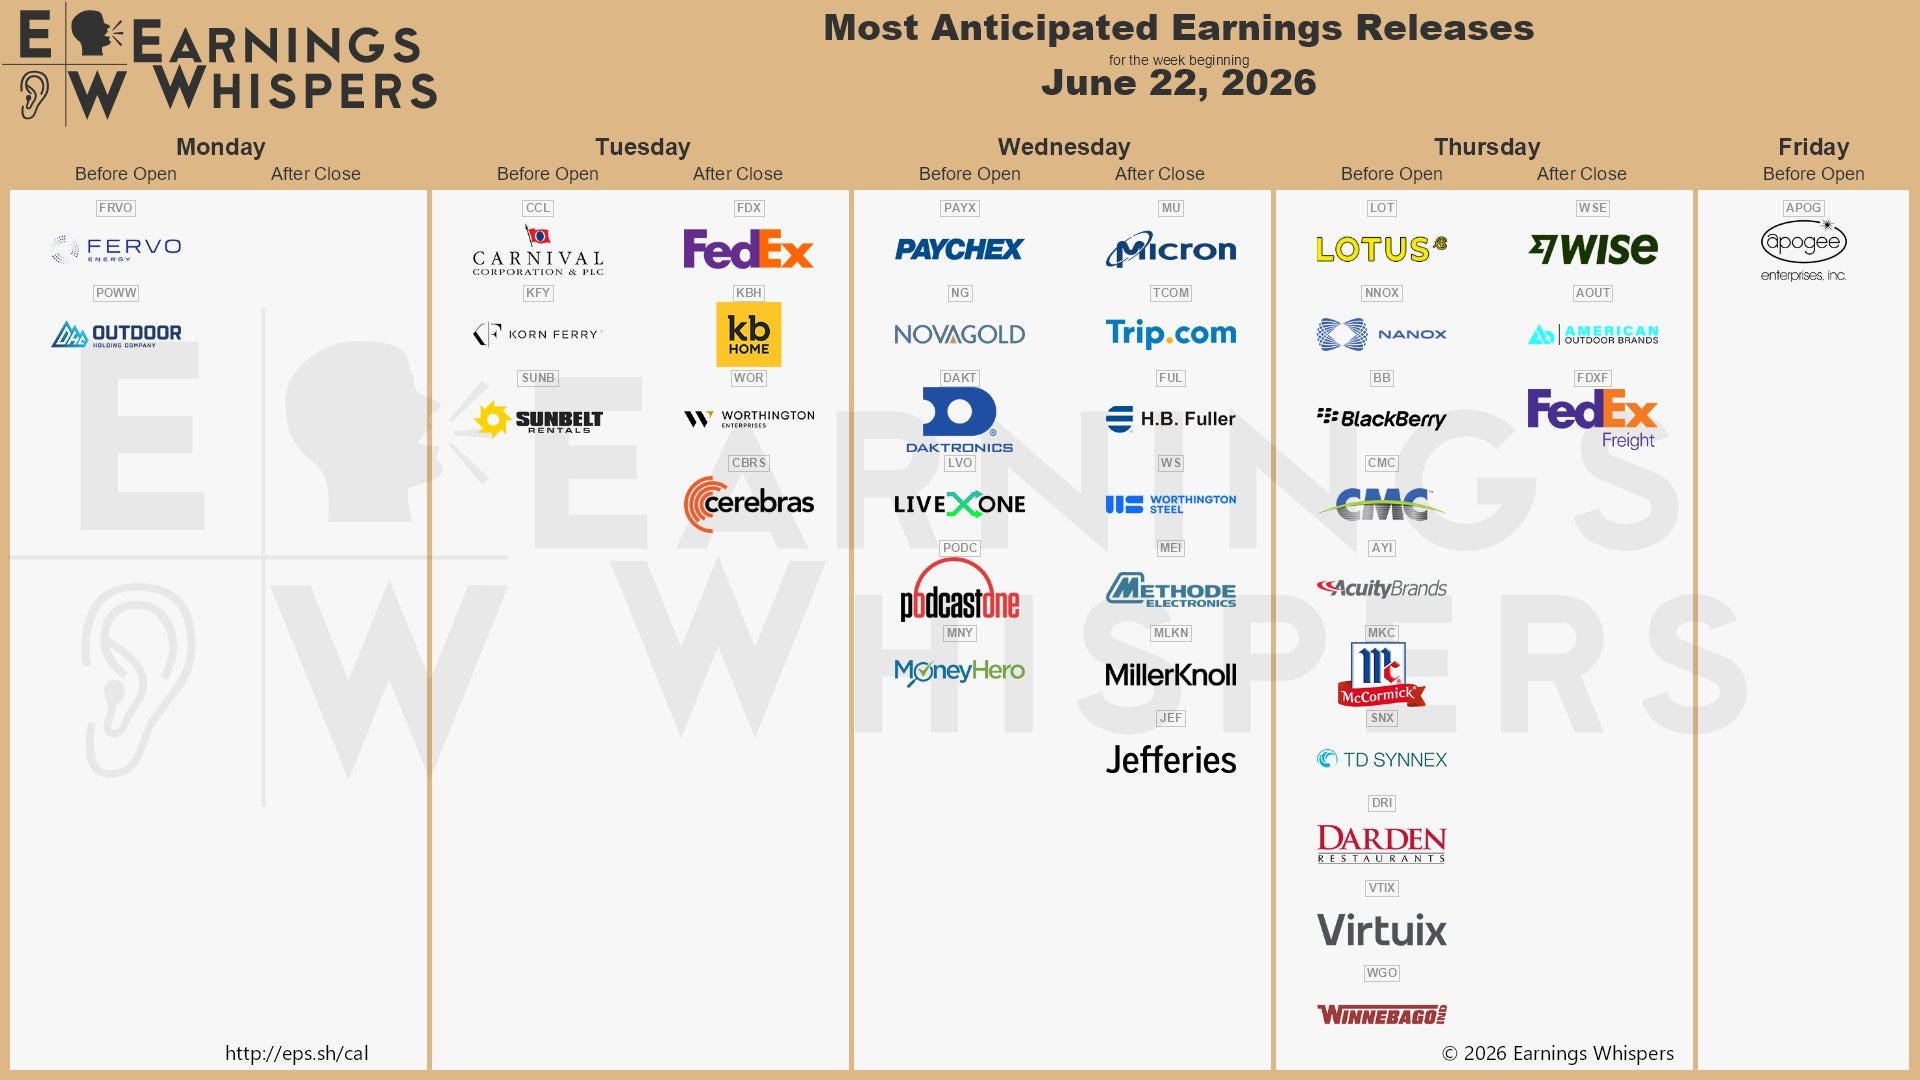
Earnings Whispers
Market Structure
FYI: During rollover, one-time framing and balance can look distorted because of the roll gap. I don’t back-adjust my charts, so expect these concepts to be temporarily skewed.
🟥 Daily: OTFD → Ends at: 7581.50
🟨 Weekly: BALANCE → 6-week → High: 7648.75 / Low: 7247.25
🟩 Monthly: OTFU → Ends at: 7199.50
Balance: A market condition where price consolidates within a defined range, reflecting indecision as the market awaits more market-generated information. We apply balance guidelines, favoring fade trades at range extremes (highs/lows) and preparing for breakout setups if balance resolves.
One-Time Framing Up (OTFU): A market condition where each subsequent bar forms a higher low, signaling a strong upward trend.
One-Time Framing Down (OTFD): A market condition where each subsequent bar forms a lower high, signaling a strong downward trend.
Contextual Analysis & Plan
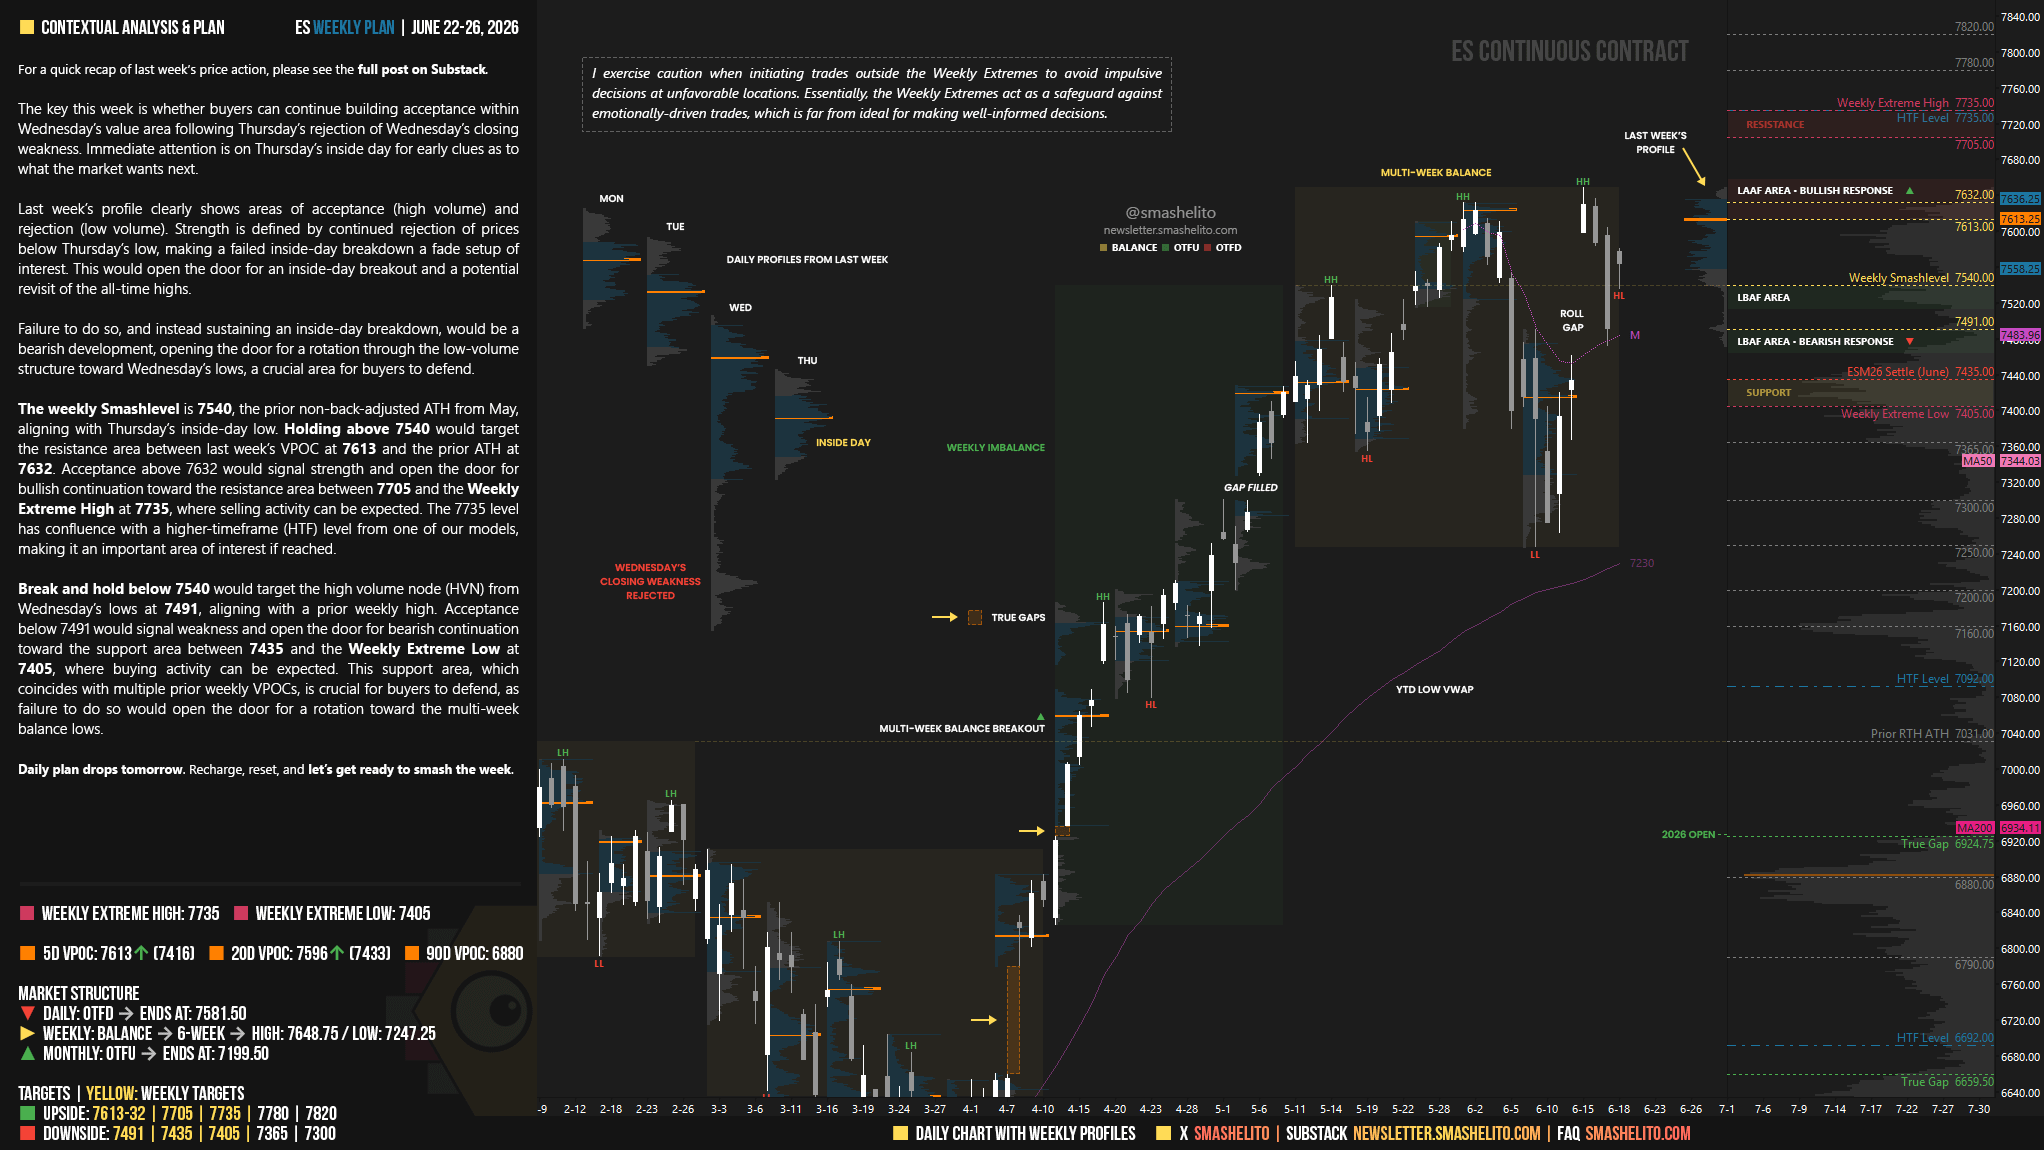
The key this week is whether buyers can continue building acceptance within Wednesday’s value area following Thursday’s rejection of Wednesday’s closing weakness. Immediate attention is on Thursday’s inside day for early clues as to what the market wants next.
Last week’s profile clearly shows areas of acceptance (high volume) and rejection (low volume). Strength is defined by continued rejection of prices below Thursday’s low, making a failed inside-day breakdown a fade setup of interest. This would open the door for an inside-day breakout and a potential revisit of the all-time highs.
Failure to do so, and instead sustaining an inside-day breakdown, would be a bearish development, opening the door for a rotation through the low-volume structure toward Wednesday’s lows, a crucial area for buyers to defend.
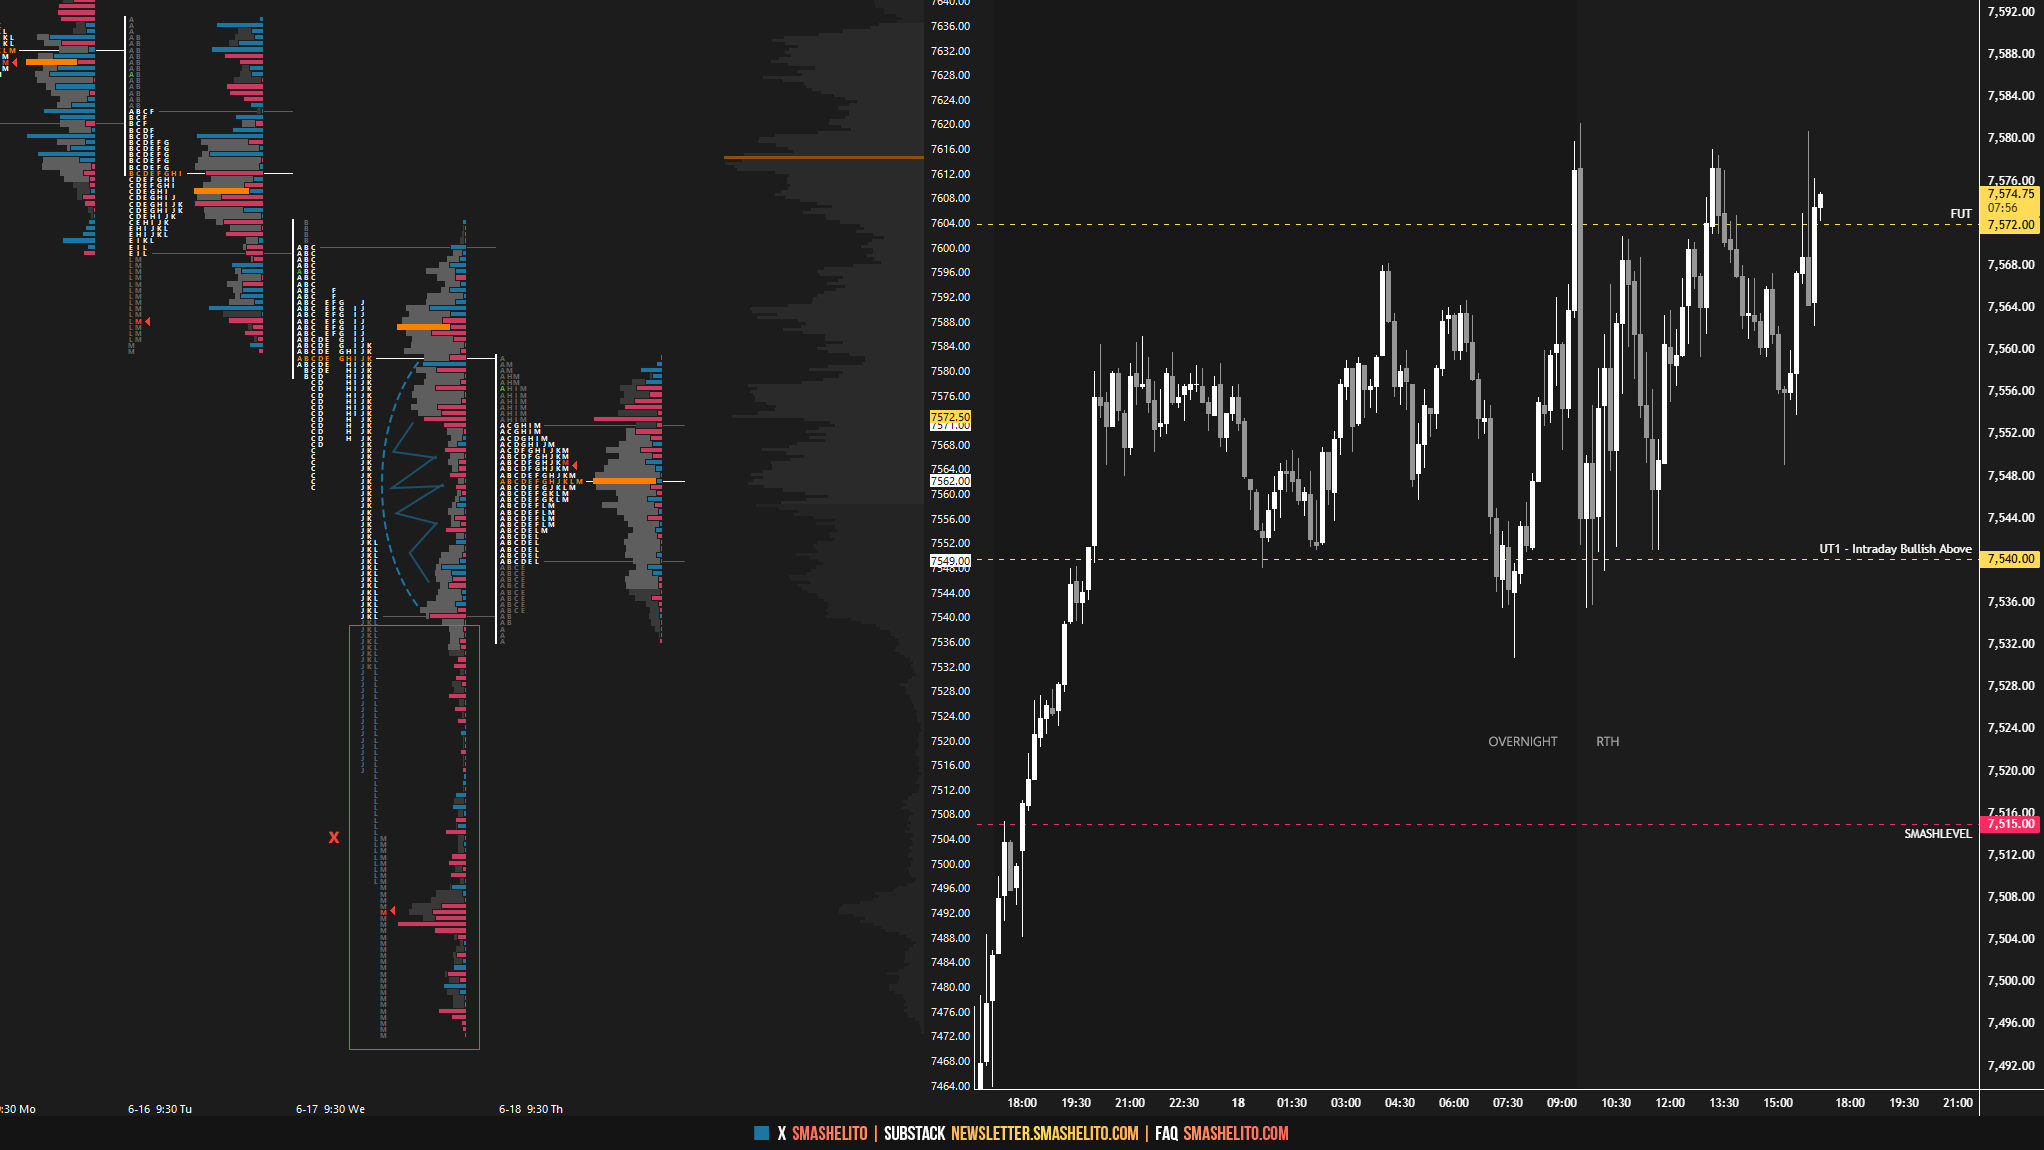
The weekly Smashlevel is 7540, the prior non-back-adjusted ATH from May, aligning with Thursday’s inside-day low. Holding above 7540 would target the resistance area between last week’s VPOC at 7613 and the prior ATH at 7632. Acceptance above 7632 would signal strength and open the door for bullish continuation toward the resistance area between 7705 and the Weekly Extreme High at 7735, where selling activity can be expected.
The 7735 level has confluence with a higher-timeframe (HTF) level from one of our models, making it an important area of interest if reached.
Break and hold below 7540 would target the high volume node (HVN) from Wednesday’s lows at 7491, aligning with a prior weekly high. Acceptance below 7491 would signal weakness and open the door for bearish continuation toward the support area between 7435 and the Weekly Extreme Low at 7405, where buying activity can be expected.
This support area, which coincides with multiple prior weekly VPOCs, is crucial for buyers to defend, as failure to do so would open the door for a rotation toward the multi-week balance lows.
Visual Representation
Key Levels of Interest
In the upcoming week, I will closely observe the behavior around 7540.
Holding above 7540 would target 7613-32 / 7705 / 7735* / 7780 / 7820
Break and hold below 7540 would target 7491 / 7435 / 7405* / 7365 / 7300
*Weekly Extremes (defined by proprietary models). I exercise caution when initiating trades outside the Weekly Extremes to avoid impulsive decisions at unfavorable locations. Essentially, the Weekly Extremes act as a safeguard against emotionally-driven trades, which is far from ideal for making well-informed decisions.
Daily plan drops tomorrow. Recharge, reset, and let’s get ready to smash the week.
Thanks a lot, Smash!
Thanks Smash!