
ES Weekly Plan | January 19-23, 2026
Recap, Market Context & Key Levels for the Week Ahead

Welcome to this week’s plan. Inside, you’ll find a quick review of last week’s price action, key economic events, market structure, context for the week ahead, and the levels I’ll be focusing on. Let’s get prepared.
Contents
Last Week in Review
Economic & Earnings Calendar
Market Structure
Contextual Analysis & Plan
Key Levels of Interest
Last Week in Review
Last week’s plan:

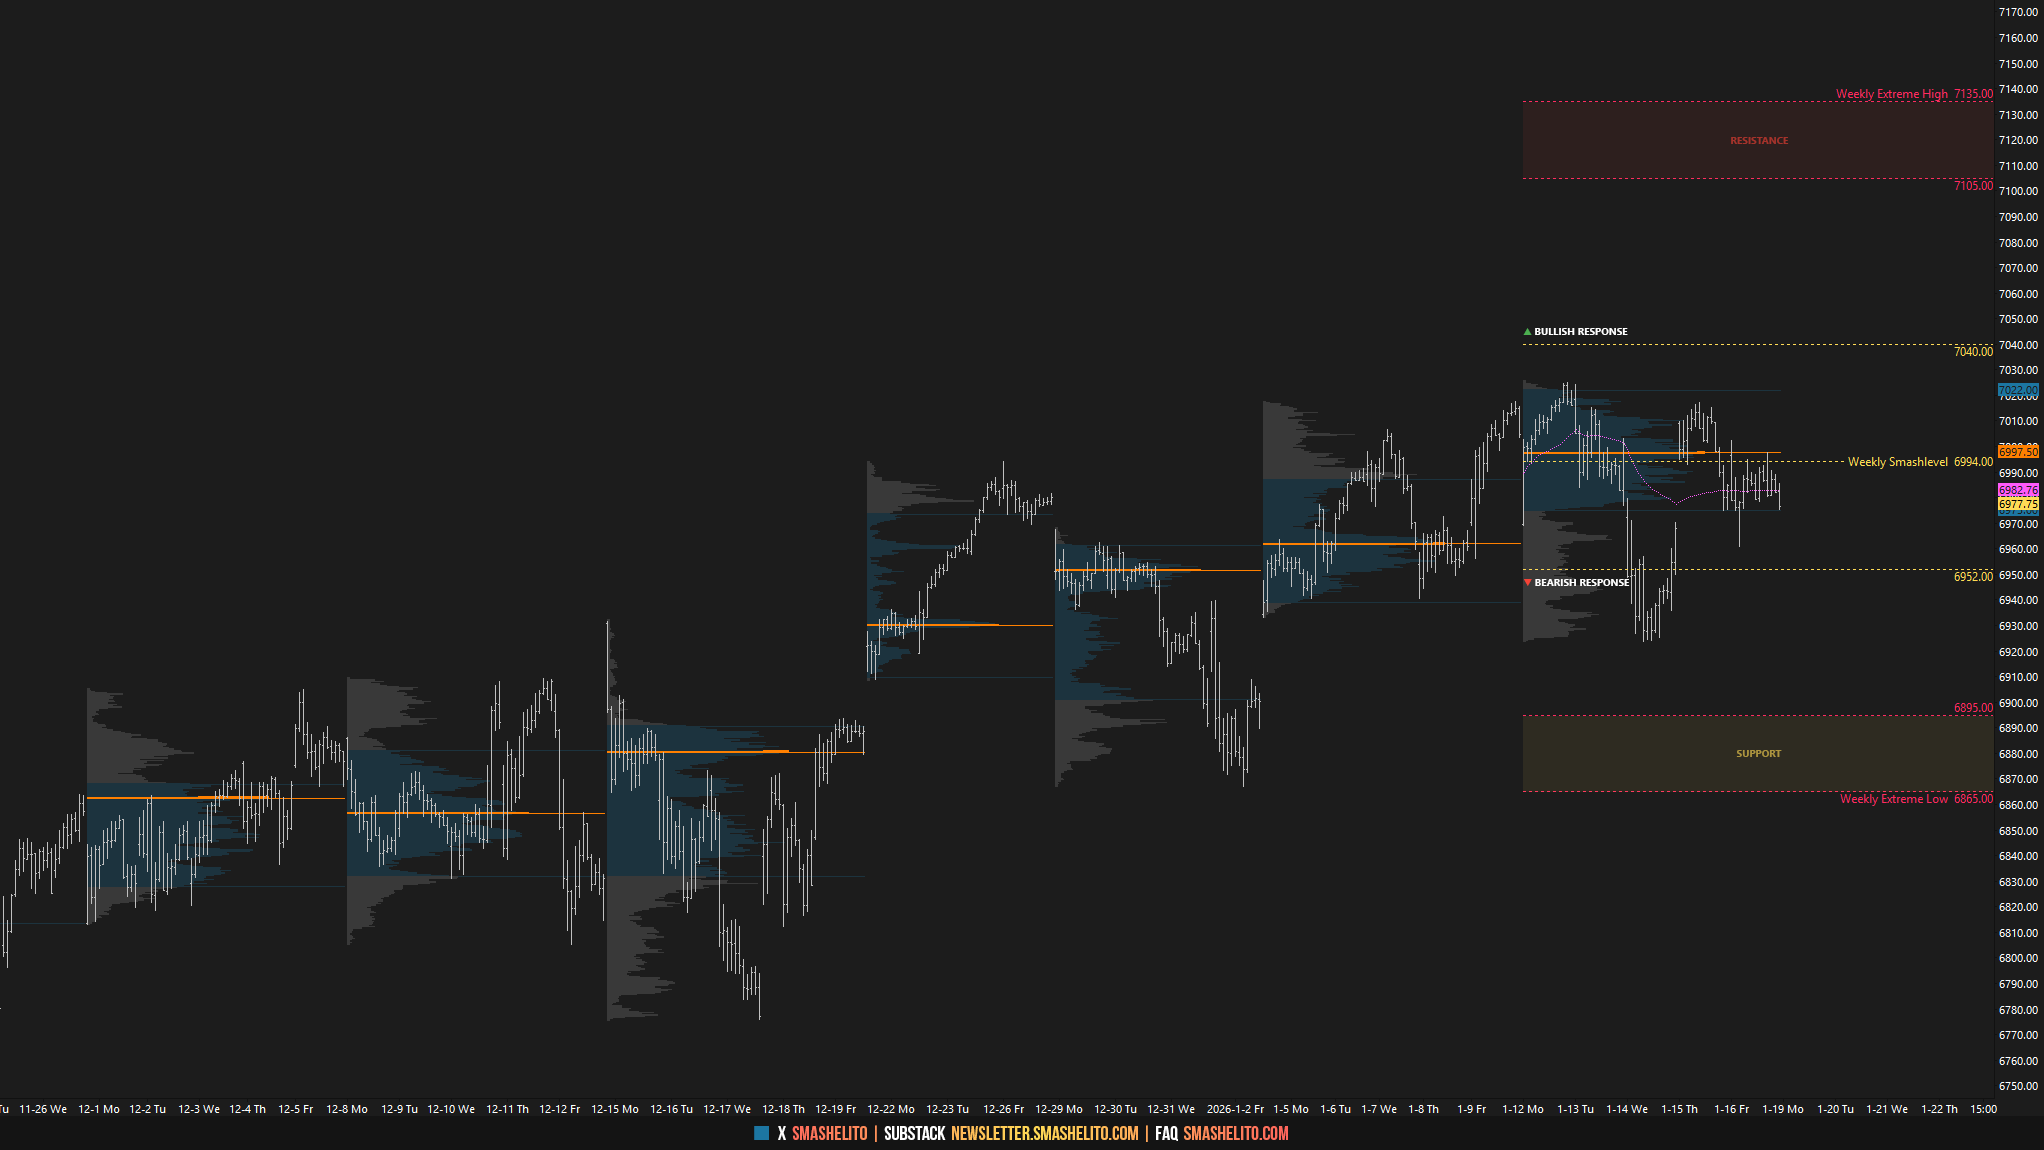
Coming into last week, the focus was on whether buyers could sustain upside momentum following the print of a new all-time high at 7017.50. All timeframes were one-time framing up, signaling strength until proven otherwise. Buyers were looking to build value above the prior ATH at 6994, favoring upside continuation, while failure to do so would target the previous ATH at 6952, where a high-volume node was situated.
Monday’s session kicked off with immediate overnight weakness, tagging the previous ATH at 6952, from which a significant reversal followed. The RTH session then printed a new all-time high at 7025.25. On Tuesday, the auction printed another all-time high at 7036.25; however, this occurred during the overnight session, meaning we carry that high forward as unfinished business, as it remained untested during RTH for the remainder of the week. Tuesday’s RTH session established an inside day, with its high closely aligned to Monday’s high, making it weak.
In the plan for Wednesday’s session, we discussed the potential for buyer exhaustion, which could trigger a liquidation break if sellers were able to gain traction within the prior week’s value area. Weakness did in fact emerge on Wednesday, as sellers were able to end both the daily and weekly one-time framing up.
The key question heading into Thursday’s session was whether Wednesday’s liquidation break represented a flush of weak-handed buyers or the involvement of stronger sellers. Thursday’s price action fully retraced Wednesday’s weakness, pointing to the former; however, closing weakness unfolded.
On Friday, as discussed in the daily plan, the conditions were straightforward: acceptance above 6994 would signal strength, while traction below 6968 would signal weakness. Both levels offered great opportunities (see Figure 1).
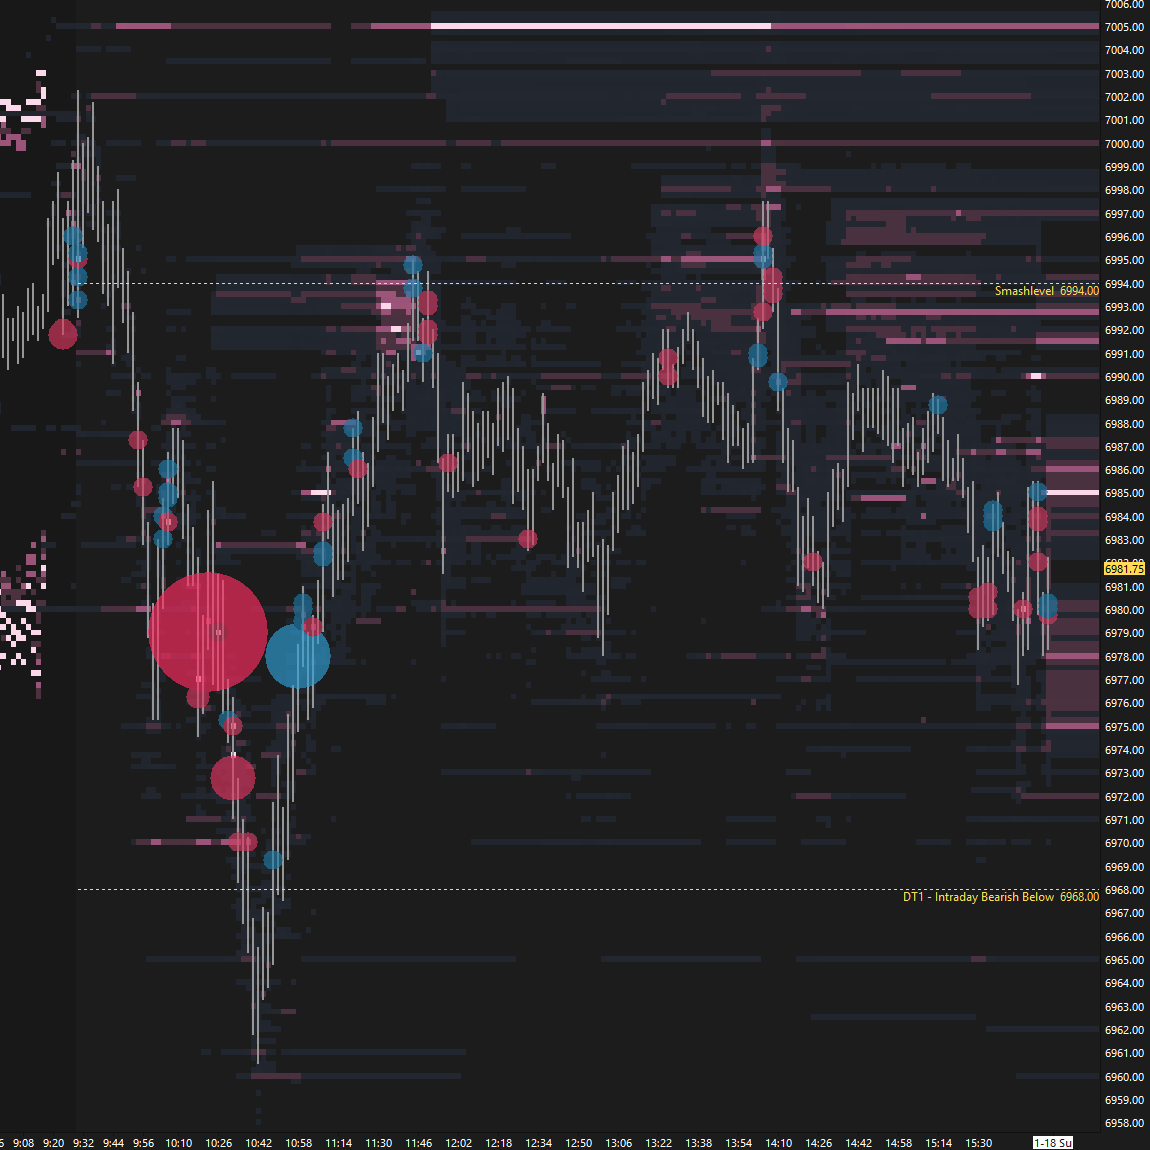
Price Action vs. Weekly Levels
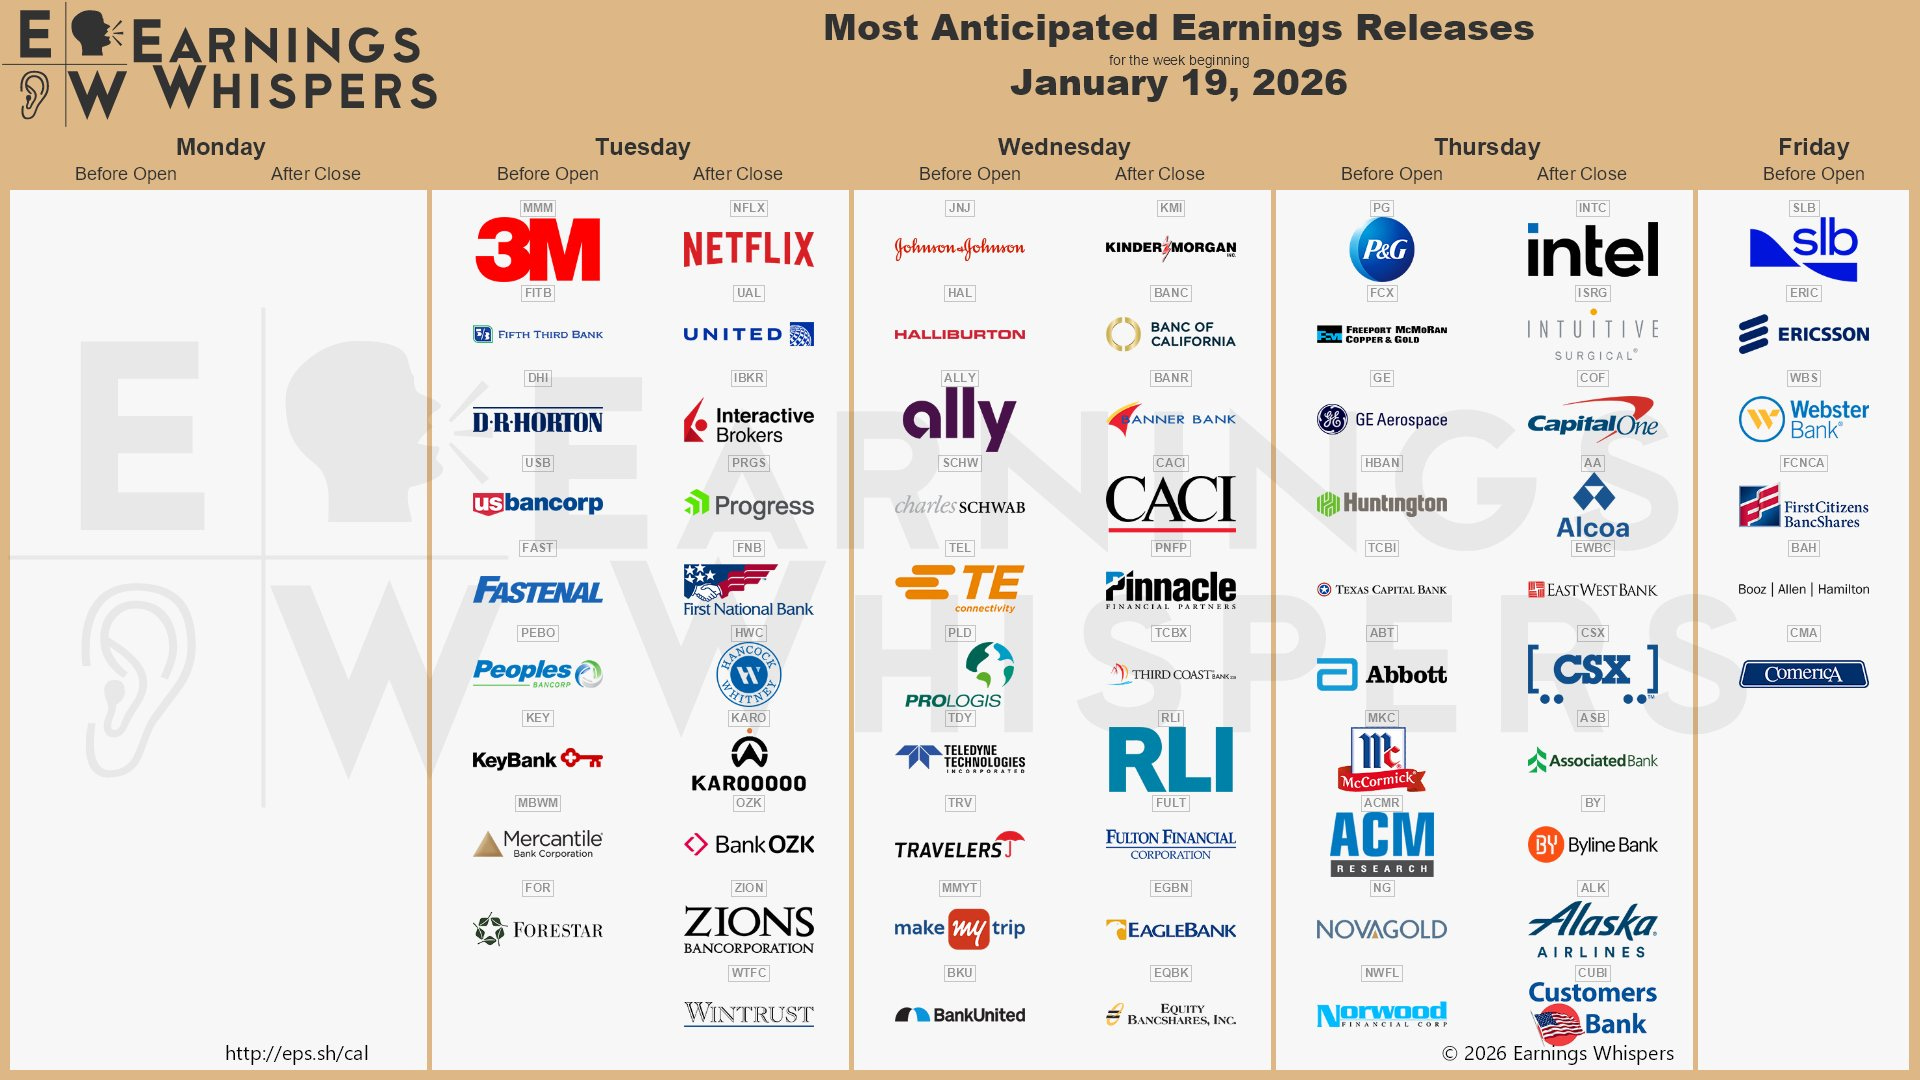
Economic & Earnings Calendar
Central Standard Time
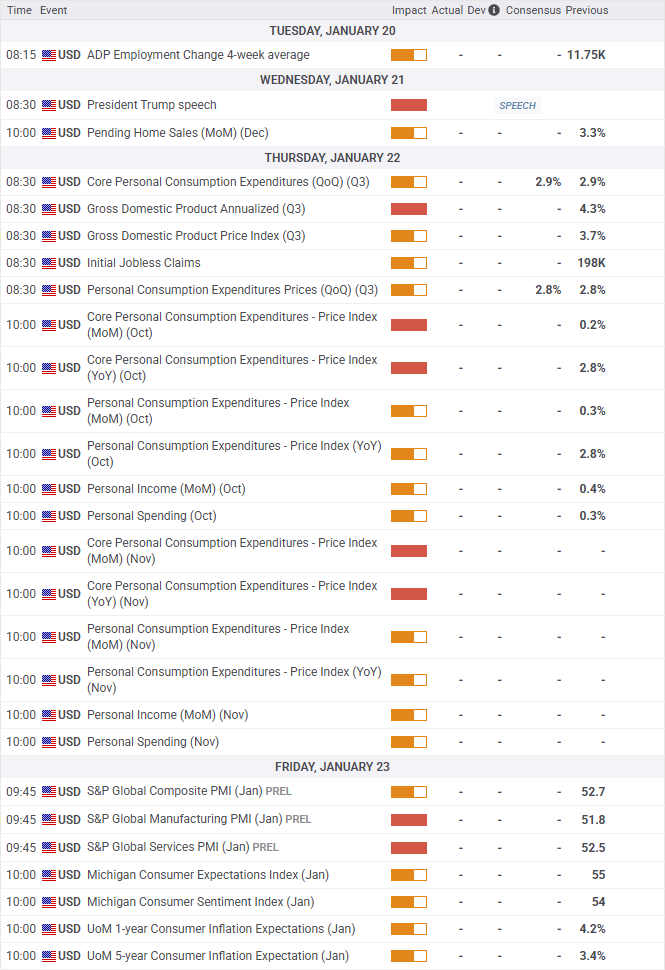
Earnings Whispers
Market Structure
🟨 Daily: BALANCE → 10-day → High: 7025.25 / 6923.25
🟨 Weekly: BALANCE → 2-week → High: 7025.25 / 6923.25
🟩 Monthly: OTFU → Ends at: 6775.50
Balance: A market condition where price consolidates within a defined range, reflecting indecision as the market awaits more market-generated information. We apply balance guidelines—favoring fade trades at range extremes (highs/lows) and preparing for breakout setups if balance resolves.
One-Time Framing Up (OTFU): A market condition where each subsequent bar forms a higher low, signaling a strong upward trend.
One-Time Framing Down (OTFD): A market condition where each subsequent bar forms a lower high, signaling a strong downward trend.
Contextual Analysis & Plan
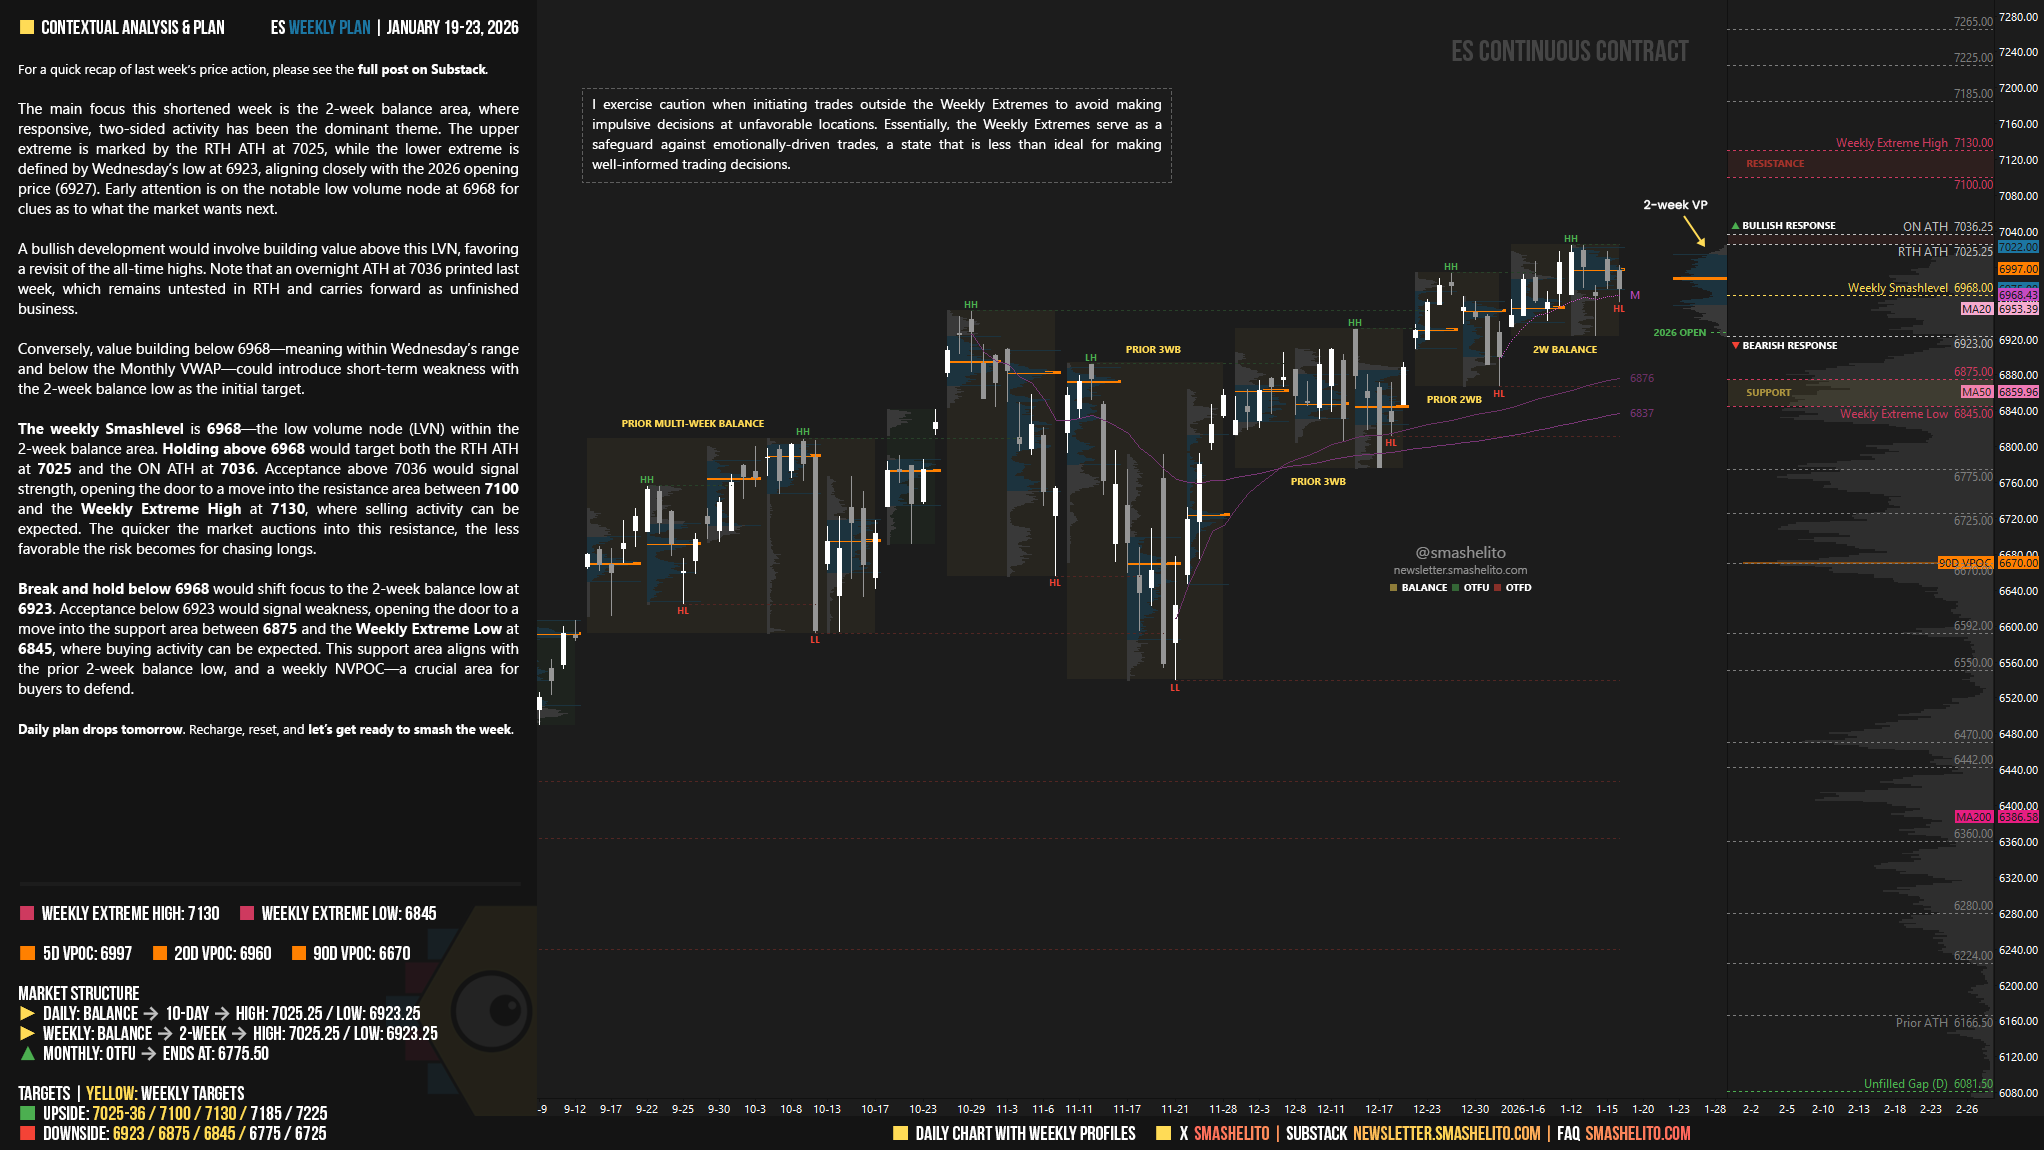
The main focus this shortened week is the 2-week balance area, where responsive, two-sided activity has been the dominant theme. The upper extreme is marked by the RTH ATH at 7025, while the lower extreme is defined by Wednesday’s low at 6923, aligning closely with the 2026 opening price (6927). Early attention is on the notable low volume node at 6968 for clues as to what the market wants next.
A bullish development would involve building value above this LVN, favoring a revisit of the all-time highs. Note that an overnight ATH at 7036 printed last week, which remains untested in RTH and carries forward as unfinished business.
Conversely, value building below 6968—meaning within Wednesday’s range and below the Monthly VWAP—could introduce short-term weakness with the 2-week balance low as the initial target.
The weekly Smashlevel is 6968—the low volume node (LVN) within the 2-week balance area. Holding above 6968 would target both the RTH ATH at 7025 and the ON ATH at 7036. Acceptance above 7036 would signal strength, opening the door to a move into the resistance area between 7100 and the Weekly Extreme High at 7130, where selling activity can be expected. The quicker the market auctions into this resistance, the less favorable the risk becomes for chasing longs.
Break and hold below 6968 would shift focus to the 2-week balance low at 6923. Acceptance below 6923 would signal weakness, opening the door to a move into the support area between 6875 and the Weekly Extreme Low at 6845, where buying activity can be expected. This support area aligns with the prior 2-week balance low, and a weekly NVPOC—a crucial area for buyers to defend.
Key Levels of Interest
In the upcoming week, I will closely observe the behavior around 6968.
Holding above 6968 would target 7025-36 / 7100 / 7130* / 7185 / 7225
Break and hold below 6968 would target 6923 / 6875 / 6845* / 6775 / 6725
*Weekly Extremes. I exercise caution when initiating trades outside the Weekly Extremes to avoid making impulsive decisions at unfavorable locations. Essentially, the Weekly Extremes serve as a safeguard against emotionally-driven trades, a state that is less than ideal for making well-informed trading decisions.
Daily plan drops tomorrow. Recharge, reset, and let’s get ready to smash the week.
Thanks Smash!
Thank you Smash!