
ES Weekly Plan | February 16-20, 2026
Recap, Market Context & Key Levels for the Week Ahead

Welcome to this week’s plan. Inside, you’ll find a quick review of last week’s price action, key economic events, market structure, context for the week ahead, and the levels I’ll be focusing on. Let’s get prepared.
Contents
Last Week in Review
Economic & Earnings Calendar
Market Structure
Contextual Analysis & Plan
Key Levels of Interest
Last Week in Review
Last week’s plan:

Last week, the market did exactly what it did on Monday the week before: it kicked off with a short-covering rally, forming a P-shaped profile. Over the next two sessions, Tuesday and Wednesday, the auction built acceptance at higher prices above the spike base at 6944 from Friday, February 6, which served as our weekly pivot. The expectation was for an upside continuation, as this represented a bullish consolidation until proven otherwise. Only acceptance below 6944 had the potential to shift the tone, as discussed in Thursday’s plan.
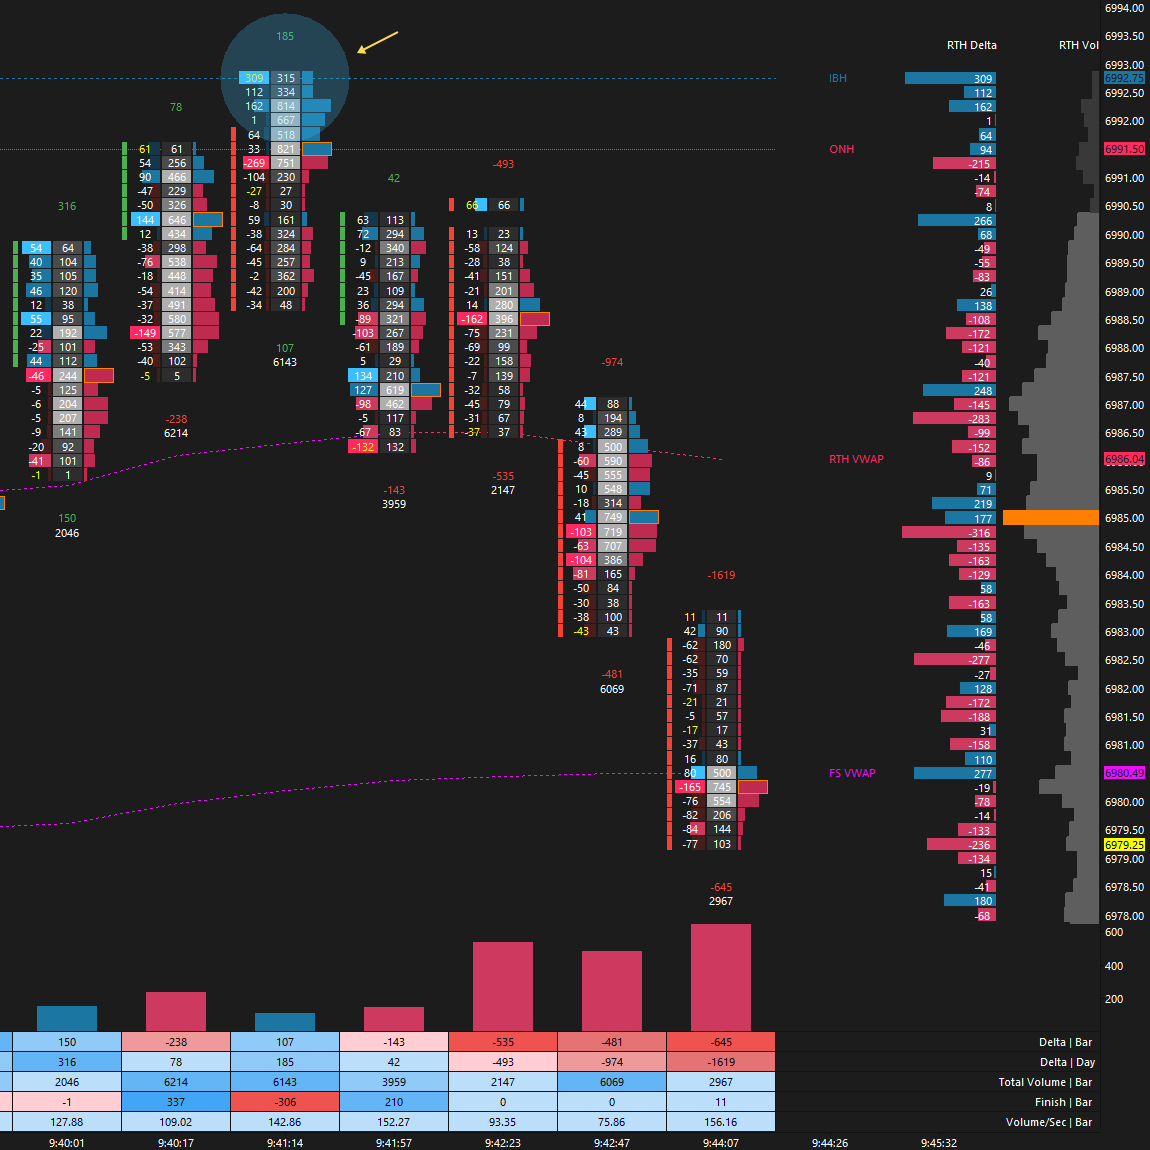
On Thursday, the auction moved counter to expectations, gaining traction below the 6944 level after a look-above-and-fail of the overnight high in the A-period (see Figure 1). This triggered a notable liquidation break and led to the formation of a double-distribution profile. It was a clear reminder of the importance of staying nimble in today’s tricky market conditions—trading is about adapting.
Friday’s session attempted an immediate downside continuation, which failed, triggering short-covering. However, sellers stepped in exactly where they needed to—at the upper end of Thursday’s lower distribution (see Figure 2). Value for the session was slightly overlapping to lower, signaling a bearish development in the context of Thursday’s trend day down.
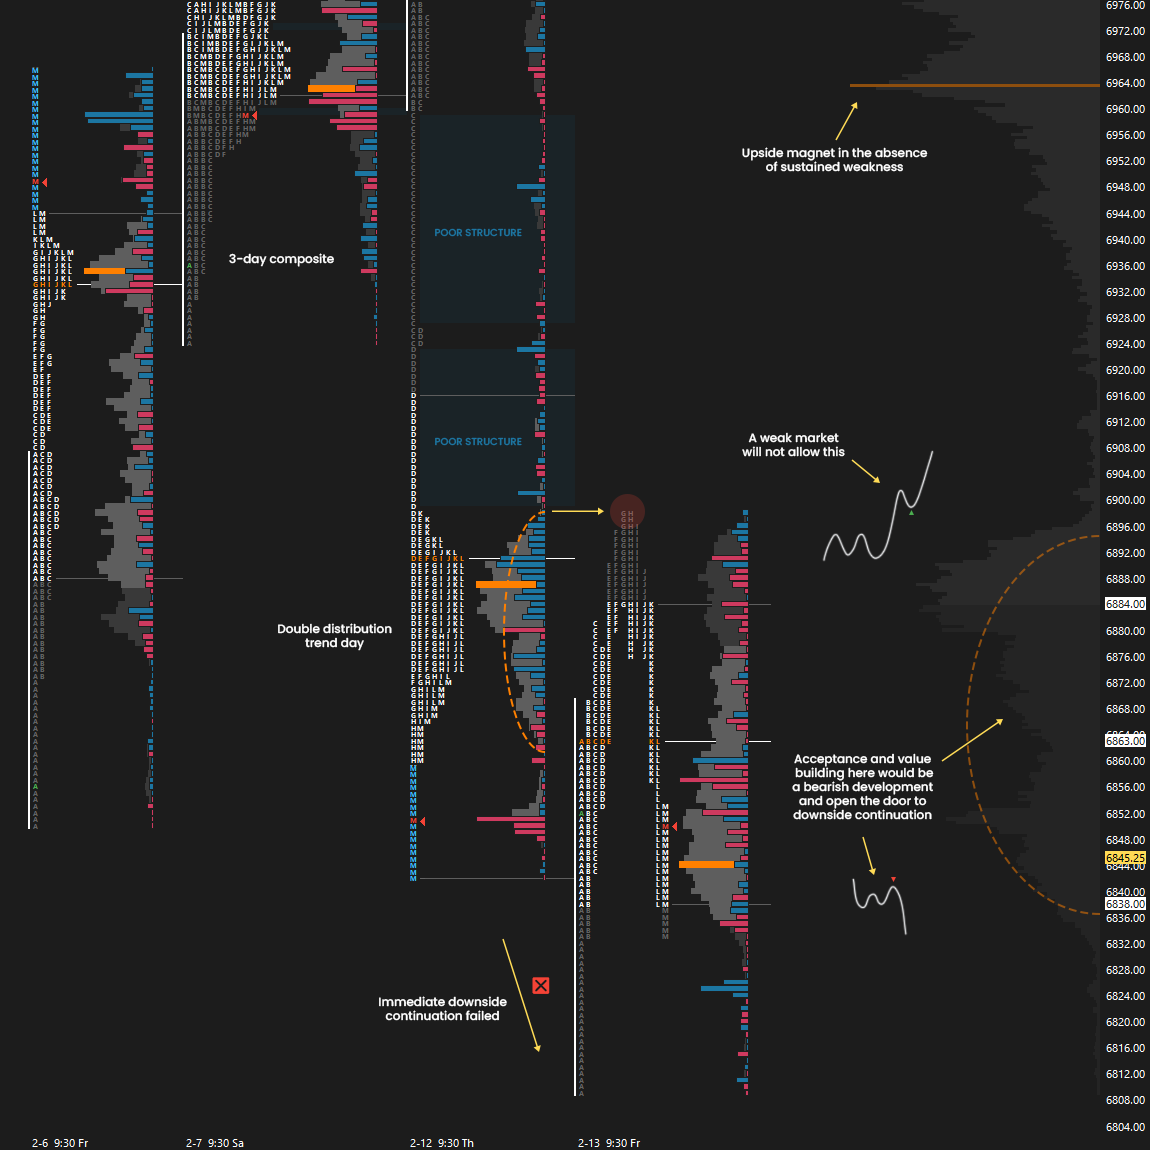
The question now is simple: can sellers continue building value here to favor downside continuation? Failure to do so opens the door to cleaning up Thursday’s notable poor structure.
Last Week’s Levels in Review
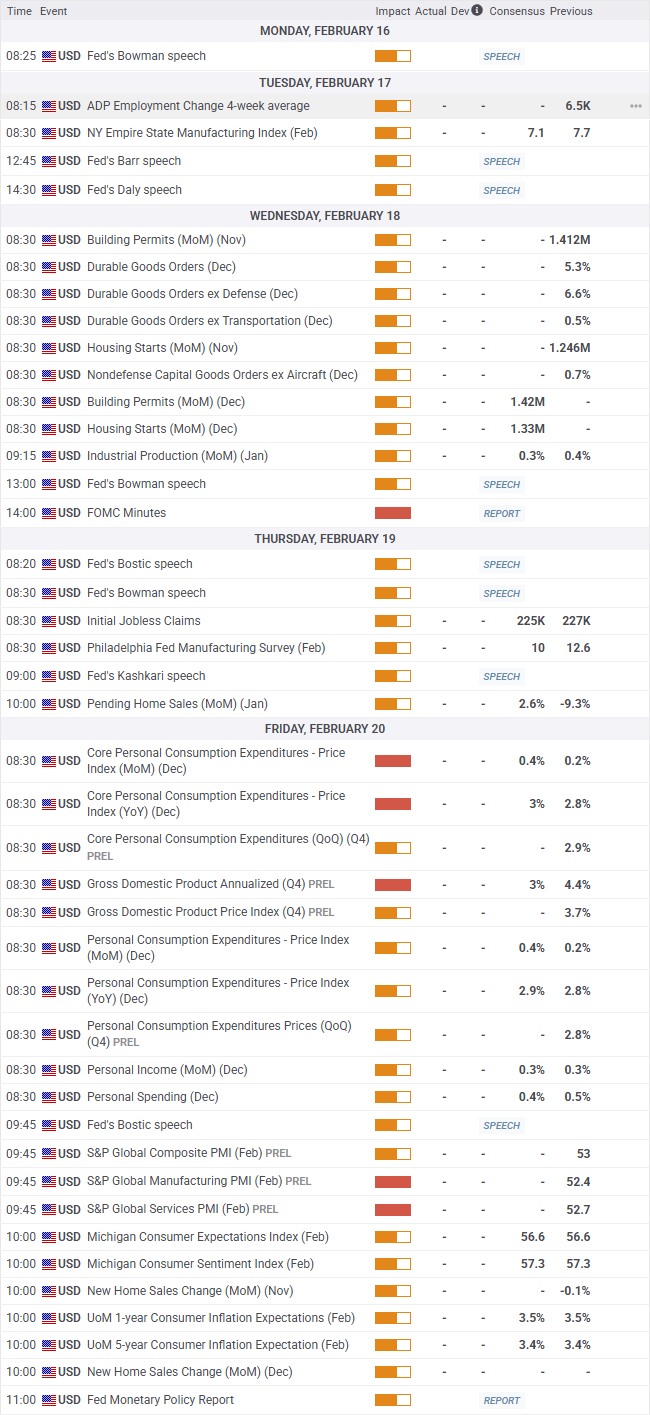
Economic & Earnings Calendar
Central Standard Time
Earnings Whispers

Market Structure
🟥 Daily: OTFD → Ends at: 6897.75
🟨 Weekly: BALANCE → 8-week → High: 7031 / Low: 6801.50
🟨 Monthly: BALANCE → TBD
Balance: A market condition where price consolidates within a defined range, reflecting indecision as the market awaits more market-generated information. We apply balance guidelines—favoring fade trades at range extremes (highs/lows) and preparing for breakout setups if balance resolves.
One-Time Framing Up (OTFU): A market condition where each subsequent bar forms a higher low, signaling a strong upward trend.
One-Time Framing Down (OTFD): A market condition where each subsequent bar forms a lower high, signaling a strong downward trend.
Contextual Analysis & Plan
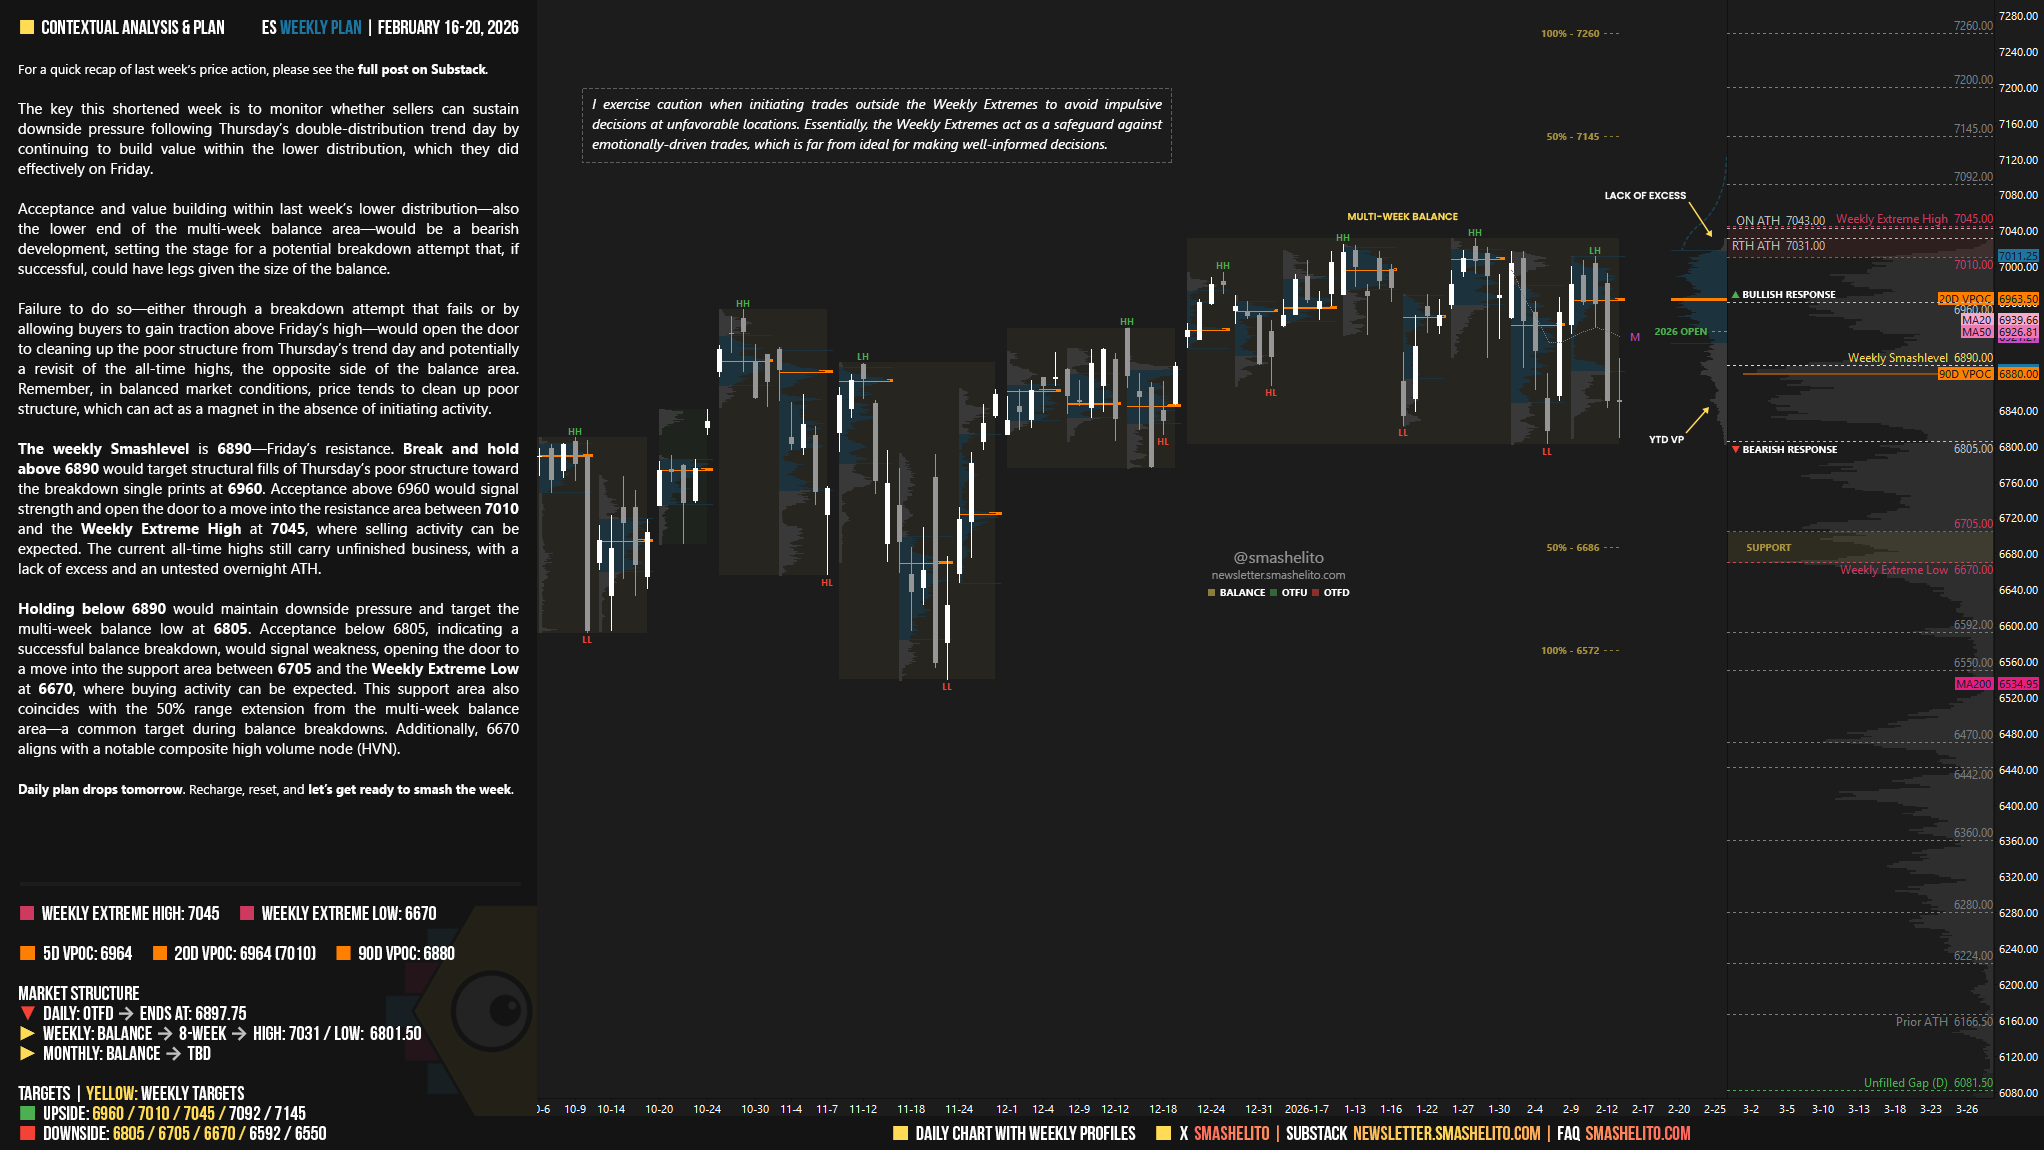
The key this shortened week is to monitor whether sellers can sustain downside pressure following Thursday’s double-distribution trend day by continuing to build value within the lower distribution, which they did effectively on Friday.
Acceptance and value building within last week’s lower distribution—also the lower end of the multi-week balance area—would be a bearish development, setting the stage for a potential breakdown attempt that, if successful, could have legs given the size of the balance.
Failure to do so—either through a breakdown attempt that fails or by allowing buyers to gain traction above Friday’s high—would open the door to cleaning up the poor structure from Thursday’s trend day and potentially a revisit of the all-time highs, the opposite side of the balance area. Remember, in balanced market conditions, price tends to clean up poor structure, which can act as a magnet in the absence of initiating activity.
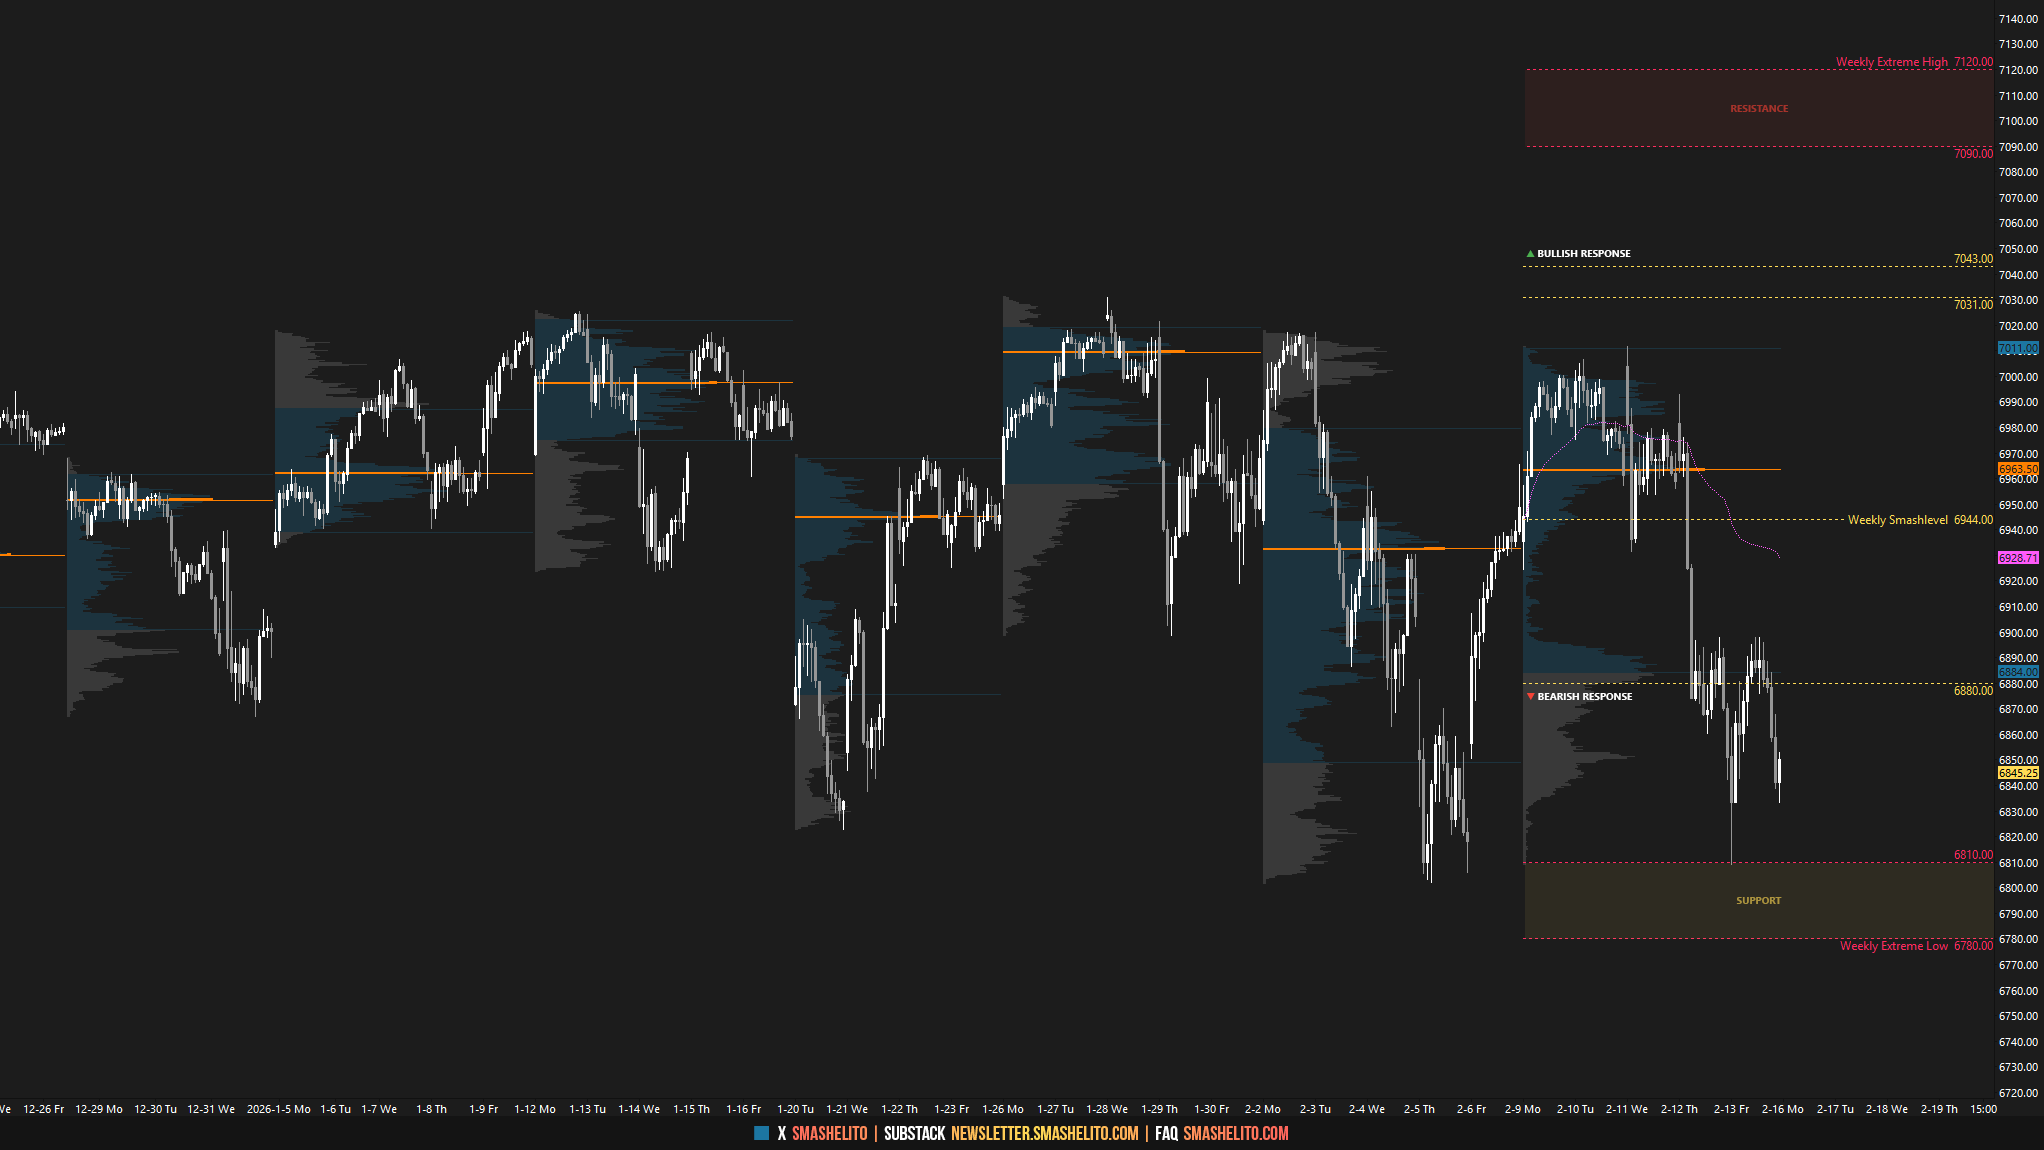
The weekly Smashlevel is 6890—Friday’s resistance. Break and hold above 6890 would target structural fills of Thursday’s poor structure toward the breakdown single prints at 6960. Acceptance above 6960 would signal strength and open the door to a move into the resistance area between 7010 and the Weekly Extreme High at 7045, where selling activity can be expected. The current all-time highs still carry unfinished business, with a lack of excess and an untested overnight ATH.
Holding below 6890 would maintain downside pressure and target the multi-week balance low at 6805. Acceptance below 6805, indicating a successful balance breakdown, would signal weakness, opening the door to a move into the support area between 6705 and the Weekly Extreme Low at 6670, where buying activity can be expected. This support area also coincides with the 50% range extension from the multi-week balance area—a common target during balance breakdowns. Additionally, 6670 aligns with a notable composite high volume node (HVN).
Key Levels of Interest
In the upcoming week, I will closely observe the behavior around 6890.
Break and hold above 6890 would target 6960 / 7010 / 7045* / 7092 / 7145
Holding below 6890 would target 6805 / 6705 / 6670* / 6592 / 6550
*Weekly Extremes (defined by proprietary models). I exercise caution when initiating trades outside the Weekly Extremes to avoid impulsive decisions at unfavorable locations. Essentially, the Weekly Extremes act as a safeguard against emotionally-driven trades, which is far from ideal for making well-informed decisions.
Daily plan drops tomorrow. Recharge, reset, and let’s get ready to smash the week.
Much appreciated
Thanks Smash. New reader