
ES Weekly Plan | February 9-13, 2026
Recap, Market Context & Key Levels for the Week Ahead

Welcome to this week’s plan. Inside, you’ll find a quick review of last week’s price action, key economic events, market structure, context for the week ahead, and the levels I’ll be focusing on. Let’s get prepared.
Contents
Last Week in Review
Economic & Earnings Calendar
Market Structure
Contextual Analysis & Plan
Key Levels of Interest
Last Week in Review
Last week’s plan:

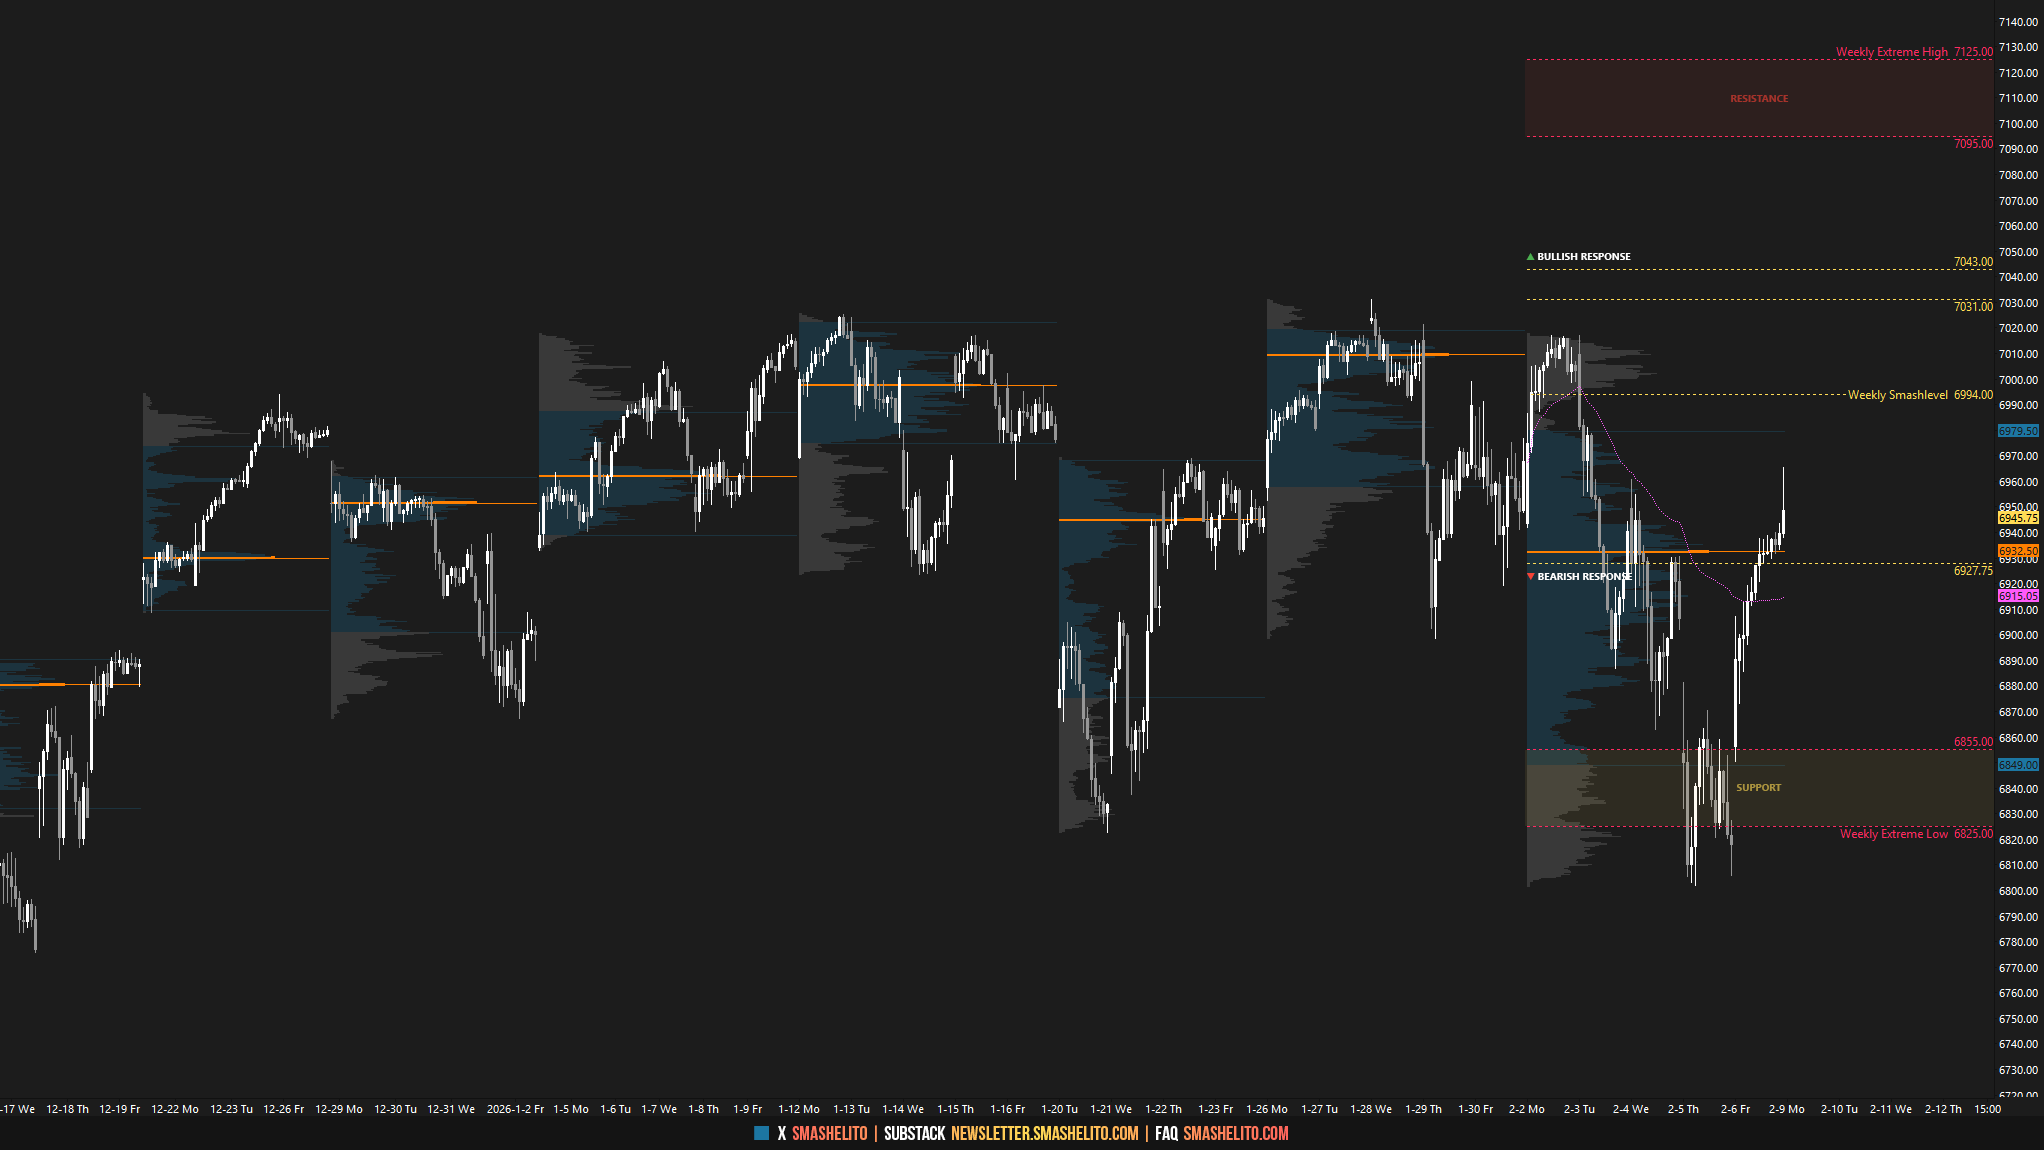
Last week, the market kicked off with a short-covering rally on Monday, forming a P-shaped profile with a poor high roughly 15 handles shy of the RTH all-time high at 7031. Heading into Tuesday’s session, the key was to monitor for continuation or lack thereof. Tuesday’s session ultimately lacked fresh initiative buyers at the multi-week balance highs, forming a weak high against Monday’s high, which triggered notable weakness.
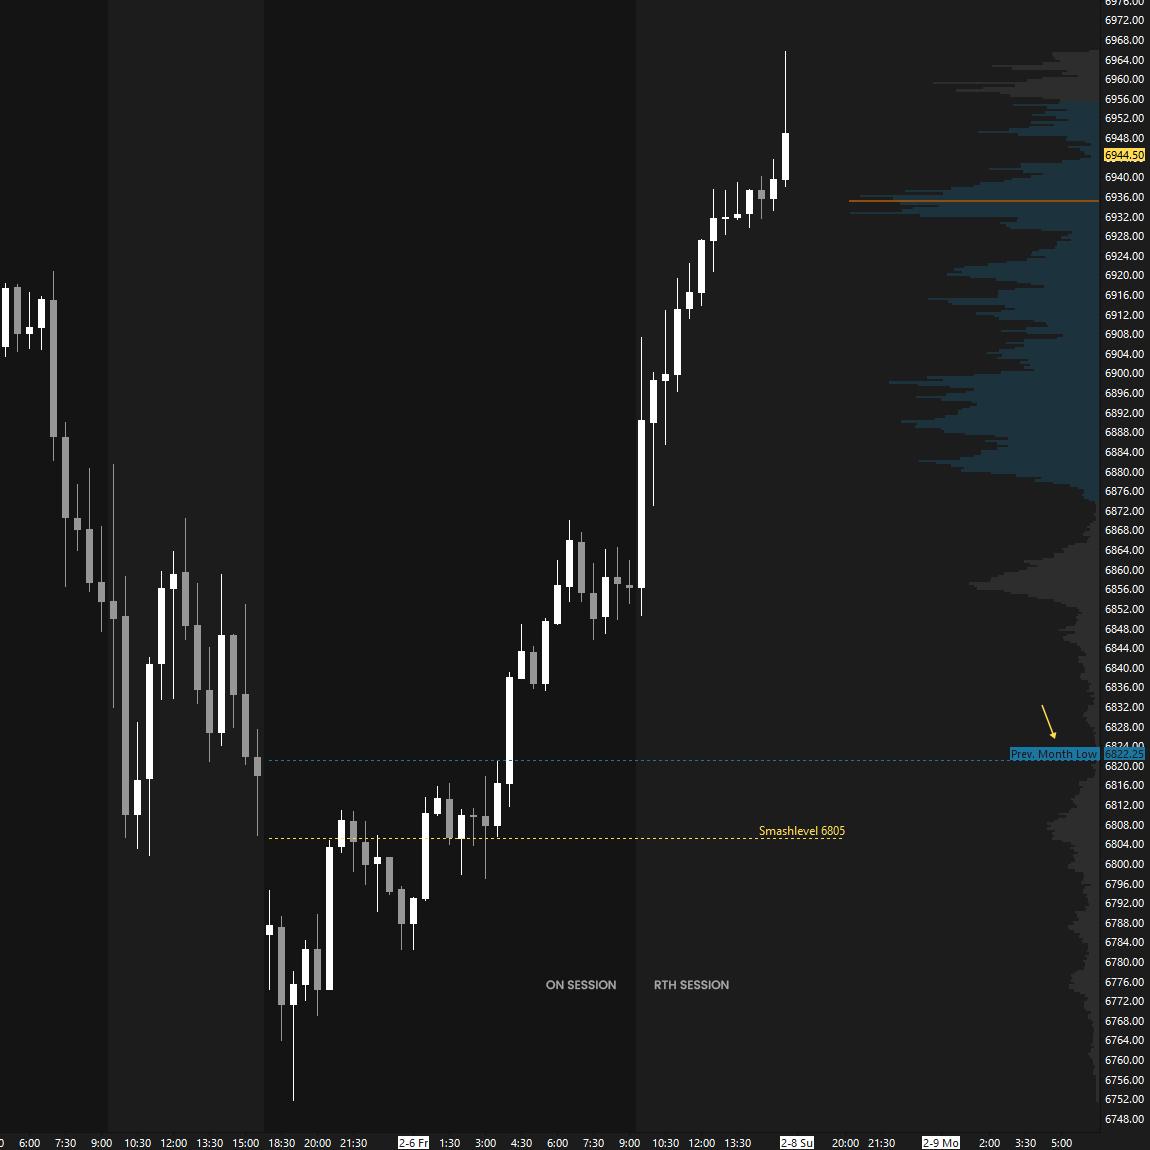
The downside momentum was sustained through Wednesday and Thursday, during which the market tagged the Weekly Extreme Low at 6825 and simultaneously ended the monthly one-time framing up. The key on Friday, as outlined in the session preparations, was to monitor whether sellers could hold below the previous month’s low at 6822, as failure to do so could trigger a short-covering rally. Sellers ultimately failed to hold below 6822, resulting in a significant squeeze that closed 150 handles above Thursday’s LOD (see Figure 1).
This served as a prime example of how tricky it can be to remain overly bearish below the Weekly Extreme Low. While failing to reclaim a Weekly Extreme Low can sometimes lead to sustained downside continuation, it’s not an outcome you want to anticipate, as the risk-reward is unfavorable and it usually involves highly emotional price action—something I personally always aim to avoid.
Technically, the weekly shifted to one-time framing down after last week; however, I will continue to interpret it as balanced, given the close back in the middle of the multi-week balance area.
This is a tricky, non-directional market environment, meaning traders should stay nimble as long as acceptance is not established outside the balance range. As always, the longer the consolidation, the more significant the breakout tends to be, which essentially gives traders enough time to join a breakout or breakdown once it forms, rather than trying to anticipate it.
Last Week’s Levels in Review
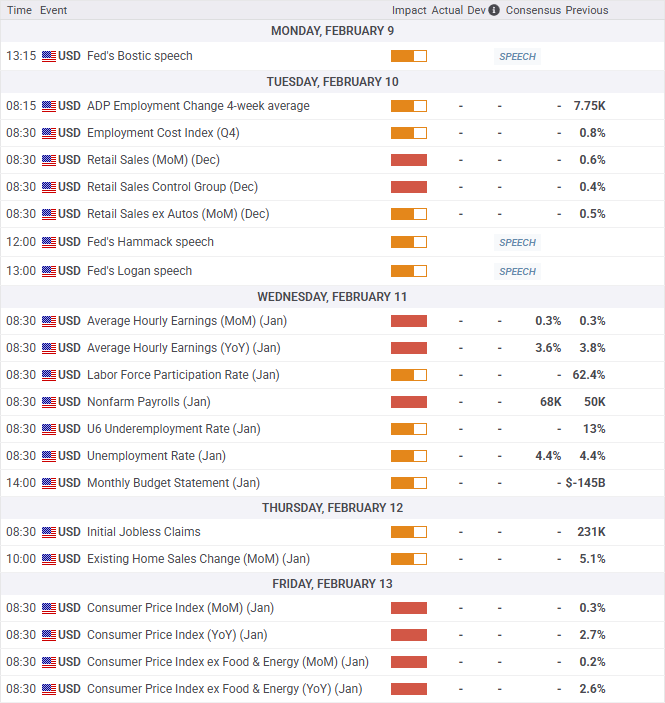
Economic & Earnings Calendar
Central Standard Time
Earnings Whispers

Market Structure
🟨 Daily: BALANCE → 3-day → High: 6965.50 / Low: 6801.50
🟨 Weekly: BALANCE → 7-week → High: 7031 / Low: 6801.50
🟨 Monthly: BALANCE → TBD
Balance: A market condition where price consolidates within a defined range, reflecting indecision as the market awaits more market-generated information. We apply balance guidelines—favoring fade trades at range extremes (highs/lows) and preparing for breakout setups if balance resolves.
One-Time Framing Up (OTFU): A market condition where each subsequent bar forms a higher low, signaling a strong upward trend.
One-Time Framing Down (OTFD): A market condition where each subsequent bar forms a lower high, signaling a strong downward trend.
Contextual Analysis & Plan
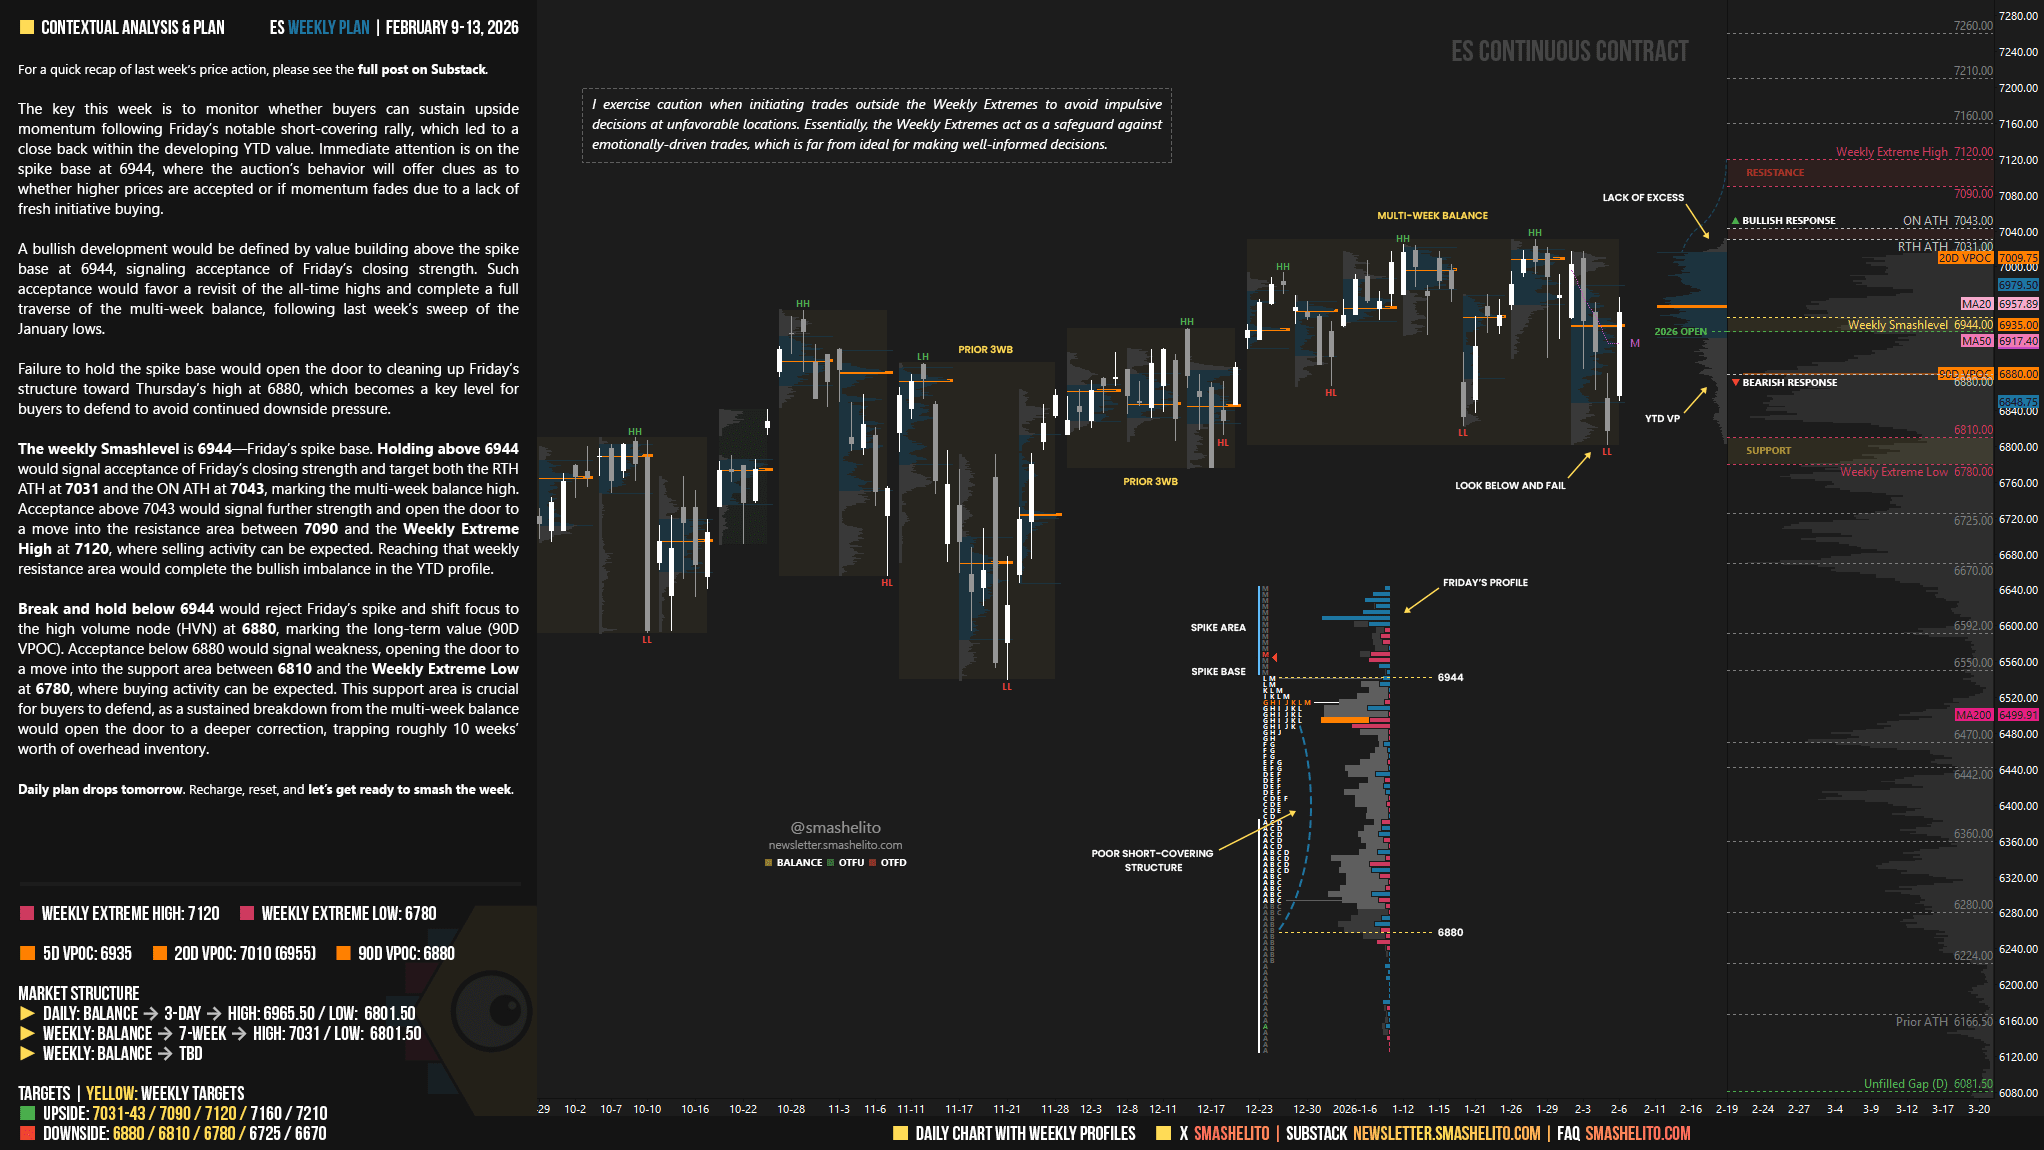
The key this week is to monitor whether buyers can sustain upside momentum following Friday’s notable short-covering rally, which led to a close back within the developing YTD value. Immediate attention is on the spike base at 6944, where the auction’s behavior will offer clues as to whether higher prices are accepted or if momentum fades due to a lack of fresh initiative buying.
A bullish development would be defined by value building above the spike base at 6944, signaling acceptance of Friday’s closing strength. Such acceptance would favor a revisit of the all-time highs and complete a full traverse of the multi-week balance, following last week’s sweep of the January lows.
Failure to hold the spike base would open the door to cleaning up Friday’s structure toward Thursday’s high at 6880, which becomes a key level for buyers to defend to avoid continued downside pressure.
The weekly Smashlevel is 6944—Friday’s spike base. Holding above 6944 would signal acceptance of Friday’s closing strength and target both the RTH ATH at 7031 and the ON ATH at 7043, marking the multi-week balance high. Acceptance above 7043 would signal further strength and open the door to a move into the resistance area between 7090 and the Weekly Extreme High at 7120, where selling activity can be expected. Reaching that weekly resistance area would complete the bullish imbalance in the YTD profile.
Break and hold below 6944 would reject Friday’s spike and shift focus to the high volume node (HVN) at 6880, marking the long-term value (90D VPOC). Acceptance below 6880 would signal weakness, opening the door to a move into the support area between 6810 and the Weekly Extreme Low at 6780, where buying activity can be expected. This support area is crucial for buyers to defend, as a sustained breakdown from the multi-week balance would open the door to a deeper correction, trapping roughly 10 weeks’ worth of overhead inventory.
Key Levels of Interest
In the upcoming week, I will closely observe the behavior around 6944.
Holding above 6944 would target 7031-43 / 7090 / 7120* / 7160 / 7210
Break and hold below 6944 would target 6880 / 6810 / 6780* / 6725 / 6670
*Weekly Extremes (defined by proprietary models). I exercise caution when initiating trades outside the Weekly Extremes to avoid impulsive decisions at unfavorable locations. Essentially, the Weekly Extremes act as a safeguard against emotionally-driven trades, which is far from ideal for making well-informed decisions.
Daily plan drops tomorrow. Recharge, reset, and let’s get ready to smash the week.
Thanks Smash!
Thank you as always!