

— For new subscribers
The yellow levels highlighted at the bottom left of the chart are the primary intraday levels I focus on. To avoid impulsive decisions at poor trade locations, I follow a simple but effective rule: exercise caution when initiating trades outside of these yellow levels.
This means I’m cautious about chasing longs above the Final Upside Target (FUT) and shorts below the Final Downside Target (FDT). It’s important to understand that not chasing does not imply initiating a trade in the opposite direction. Discipline over impulse.
Be sure to review the Weekly Plan for a broader perspective, key levels, and market expectations for the week ahead.

Contract Rollover
A quick reminder: I’ve switched to the ESZ26 (December) contract. As always, I do not back-adjust my charts. I recommend marking 7659.50 on your chart, as roll gaps often tend to get filled.
Contract rollovers can be confusing. While some traders back-adjust their charts, I prefer to leave historical levels unchanged, resulting in a visible roll gap. This is purely a matter of personal preference; neither approach is inherently superior, and both have their pros and cons.
For short-term traders, the impact is minimal, since we navigate the market day by day. During rollover periods, I typically scale back activity because order flow becomes noticeably less reliable.
Contextual Analysis & Plan
We kicked off the week with the overnight session gapping lower, opening below both 7711 (Smashlevel) and 7690 (DT1). Sellers maintained control below 7690 throughout the overnight session, with the exception of a brief price exploration above the level during Asia. Failure to find acceptance above 7690 led to downside continuation, with the auction coming a few handles shy of tagging the final downside target at 7659 (FDT).
As frequently discussed, once the auction approaches an FDT level, chasing further downside generally becomes unfavorable from a risk/reward perspective. This doesn’t mean the market can’t continue lower, but rather that the potential reward no longer justifies the risk of initiating a new short position at such an extended location.
Both the overnight and RTH sessions found responsive buyers around the 7659 level. Sellers initially defended 7690 during RTH, triggering a solid reversal, but ultimately failed to break the overnight lows after a Look Below and Fail (LBAF) of the Initial Balance range. The roll gap remains unfilled (7659.50). Buyers managed to gain traction above 7690 in the E-period, leading to a test of 7711, and this test coincided with VIX testing it’s broken resistance from above. The market saw a Look Above and Fail (LAAF) of 7711, ultimately resulting in a return to 7690 following weakness into the close.
Note how, despite the contract rollover, the auction has found its way back to 7690, which has been the fairest price to do business this month. This is one of the reasons I don’t back-adjust my charts, as prior composite high volume nodes like this often remain magnets.
Session Recap
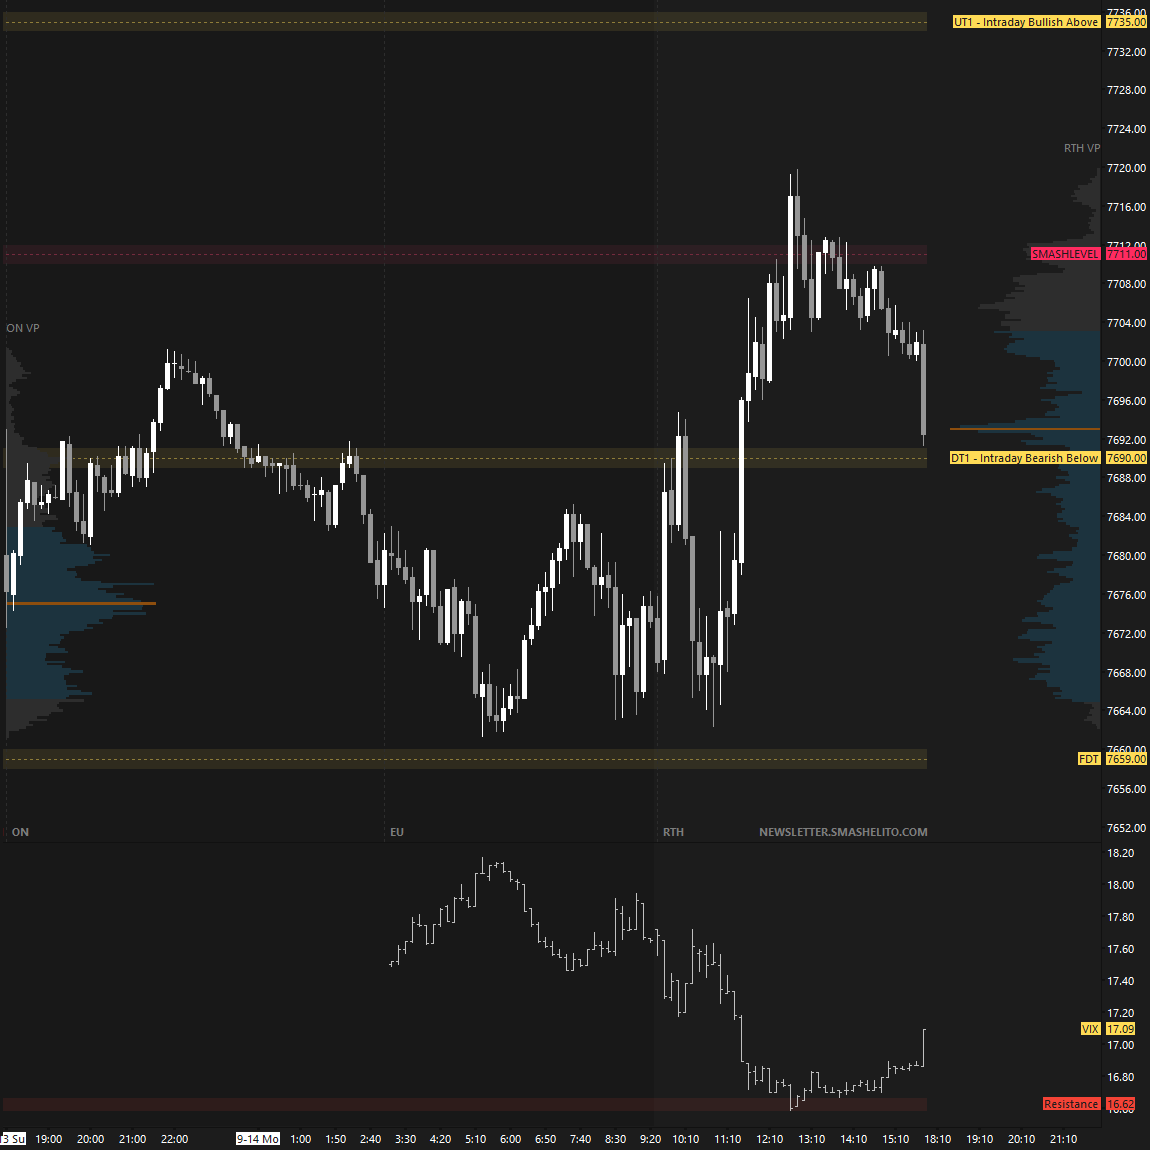
The auction has found its way back to the composite HVN at 7690 following early weakness that came a few ticks shy of the roll gap at 7659.50, while the RTH session saw selling activity at the 7711 pivot. Keep in mind that TradingView rolls to the Z contract tonight, so don’t freak out.
Intraday strength would be indicated by a reclaim of 7711 (UT1), while weakness would be signaled by a break and hold below 7659 (DT1).
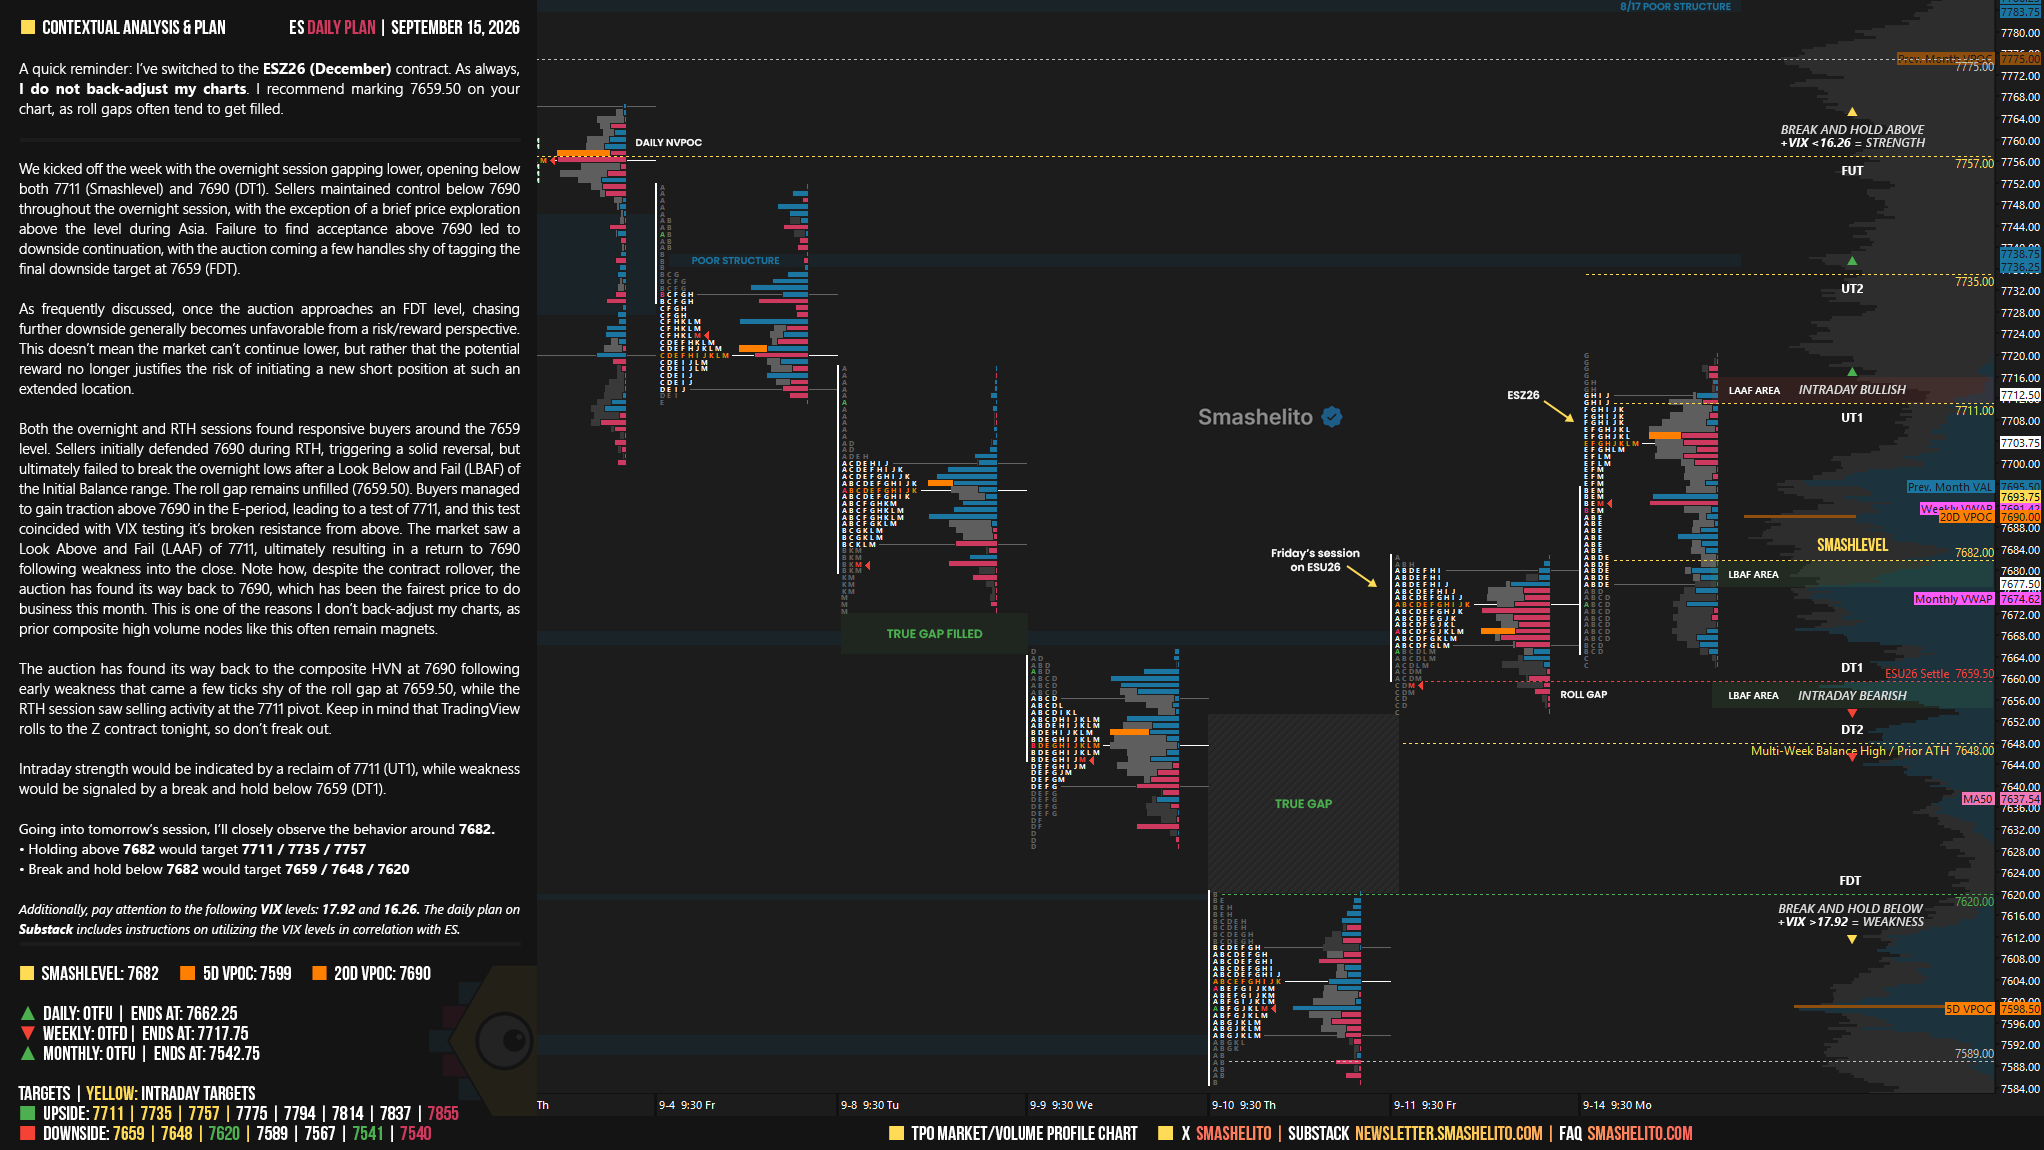
In terms of levels, the Smashlevel is at 7682, Friday’s high (on ESU26), which is also an LVN on the 5D profile. Holding above 7682 would signal stability, targeting 7711 (UT1). Acceptance above 7711 would signal intraday strength, targeting 7735 (UT2), with 7757 (FUT), the daily NVPOC, serving as the final upside target under sustained buying pressure.
On the flip side, failure to hold 7682 shifts focus to the roll gap at 7659 (DT1). Acceptance below 7659 would signal intraday weakness, targeting the prior ATH at 7648 (DT2), with 7620 (FDT), the unfilled bull gap, serving as the final downside target under sustained selling pressure.
Visual Representation
Levels of Interest
Going into tomorrow’s session, I’ll closely observe the behavior around 7682.
Holding above 7682 would target 7711 / 7735 / 7757
Break and hold below 7682 would target 7659 / 7648 / 7620
Additionally, pay attention to the following VIX levels: 17.92 and 16.26. These levels can provide confirmation of strength or weakness.
Break and hold above 7757 with VIX below 16.26 would confirm strength.
Break and hold below 7620 with VIX above 17.92 would confirm weakness.
Overall, it's important to exercise caution when trading outside of the highlighted yellow levels. A non-cooperative VIX may suggest possible reversals i.e trade setups.
7660-5 was a great area to start longs. Sellers tried to go there overnight, and could not break it in the first hour and a half after multiple attempts - then came a providential tweet about Iran that brought the 10y below 5% and WTI oil below 104, with equities short covering. Can't imagine much upside before FOMC, and downside seems contained as well for the moment
Bookmap & IRT. Thinking about switching from IRT to Sierra and buying your charts.