

Welcome to this week’s plan. Inside, you’ll find a quick review of last week’s price action, key economic events, market structure, context for the week ahead, and the levels I’ll be focusing on. Let’s get prepared.
Contents
Last Week in Review
Economic & Earnings Calendar
Market Structure
Contract Rollover
Contextual Analysis & Plan
Key Levels of Interest
Last Week in Review
Last week’s plan:

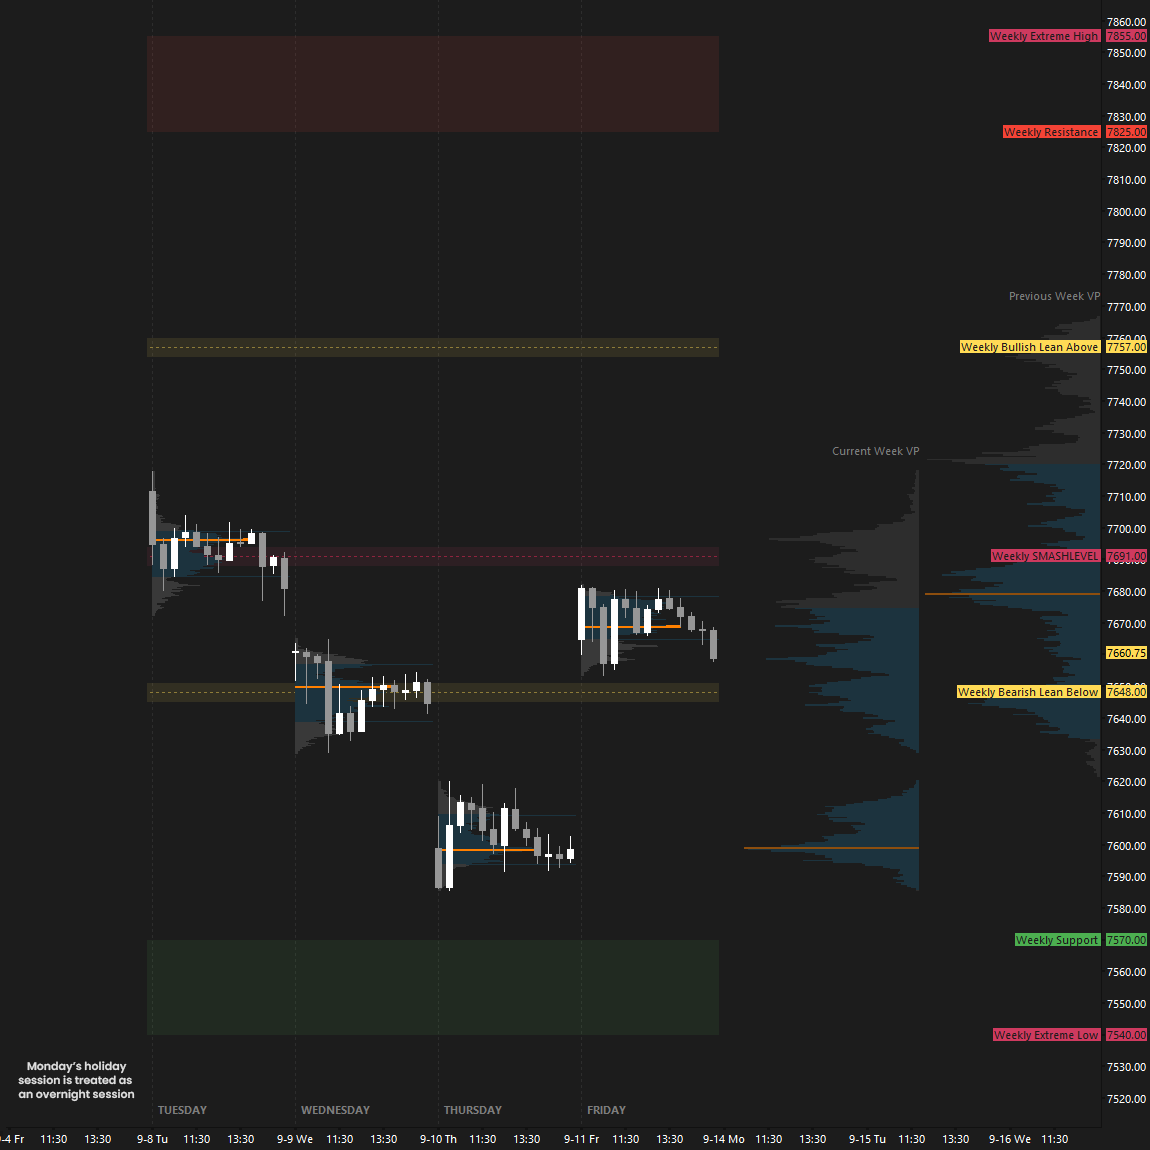
Last week kicked off with weakness on Tuesday following Monday’s holiday session. Sellers took control of the 7711 level overnight, resulting in a fill of the bull gap at 7691.25 during RTH. Failure to defend 7691 was short-term bearish, opening the door to another test of the prior ATH at 7648, as outlined in last week’s plan.
“If we open with weakness, the key for buyers will be to defend Thursday’s true gap at 7691.25. Failure to defend this area, effectively rejecting Thursday’s shift in tone, would be short-term bearish and open the door to another test of the prior ATH at 7648.”
The 7691 level played a pivotal role on Wednesday, as the auction found sellers there overnight, leading to significant weakness (see Figure 1). In the process, the auction retested the prior ATH at 7648, which produced some good reactions.
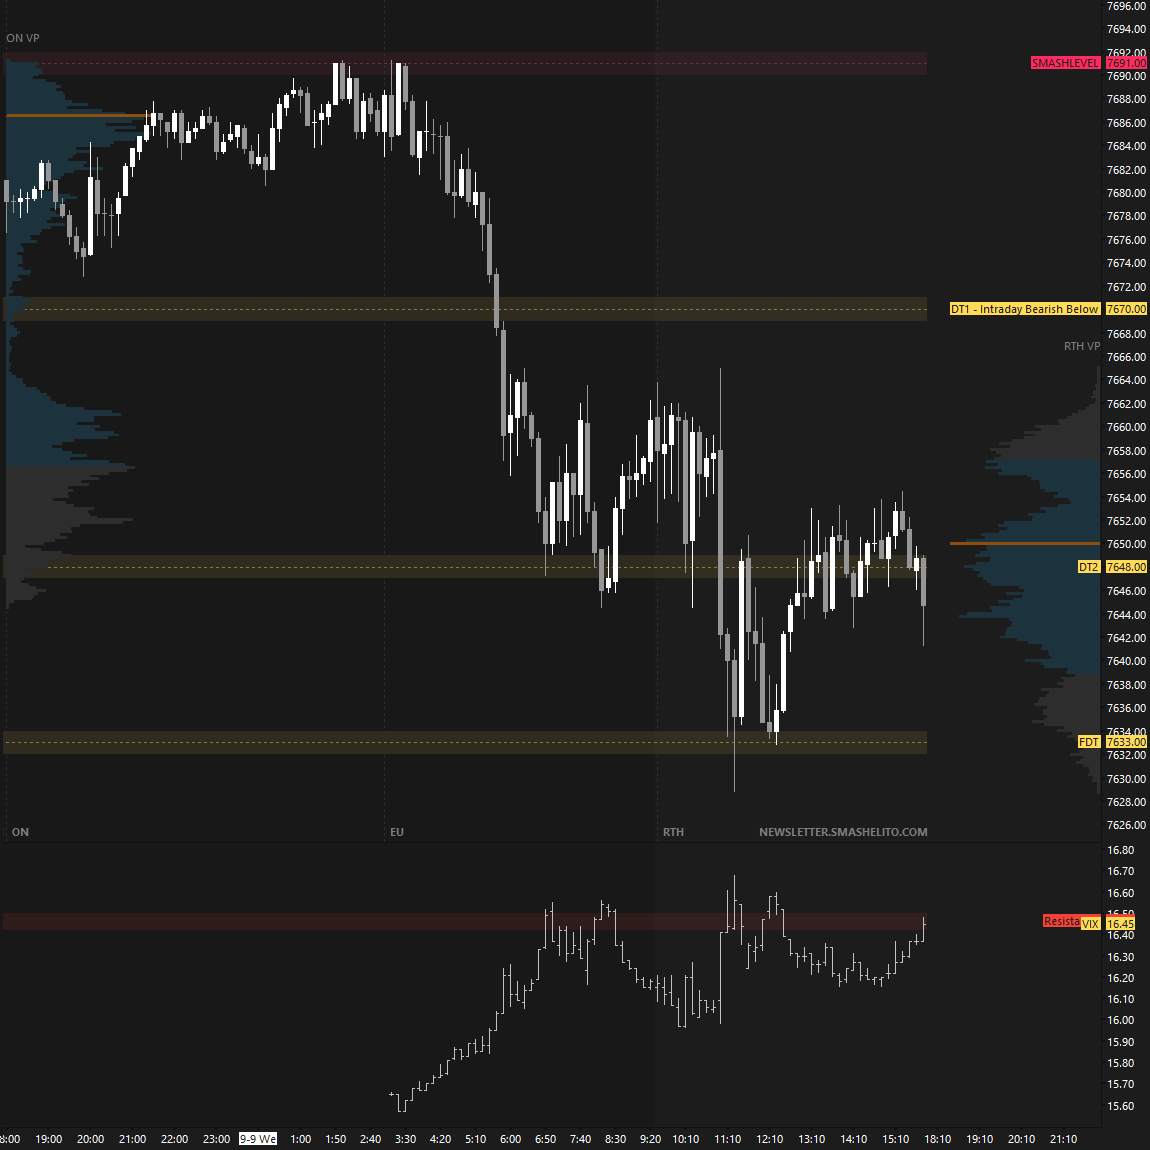
Both Wednesday and Thursday opened with true gaps to the downside following big overnight moves, but the actual RTH sessions were notably uneventful. Trading can be very tricky under these conditions if you are an RTH-only trader. The expectation is that the market will follow through on the overnight activity, only for the RTH session to deliver very little.
This is where the intraday levels provided in each daily plan become invaluable. Each day, you are provided with FUT and FDT levels, derived from our models, which represent the final upside and downside targets for the session. FUT/FDT are generally unfavorable locations to chase, which can help keep you out of emotional trades after big overnight moves.
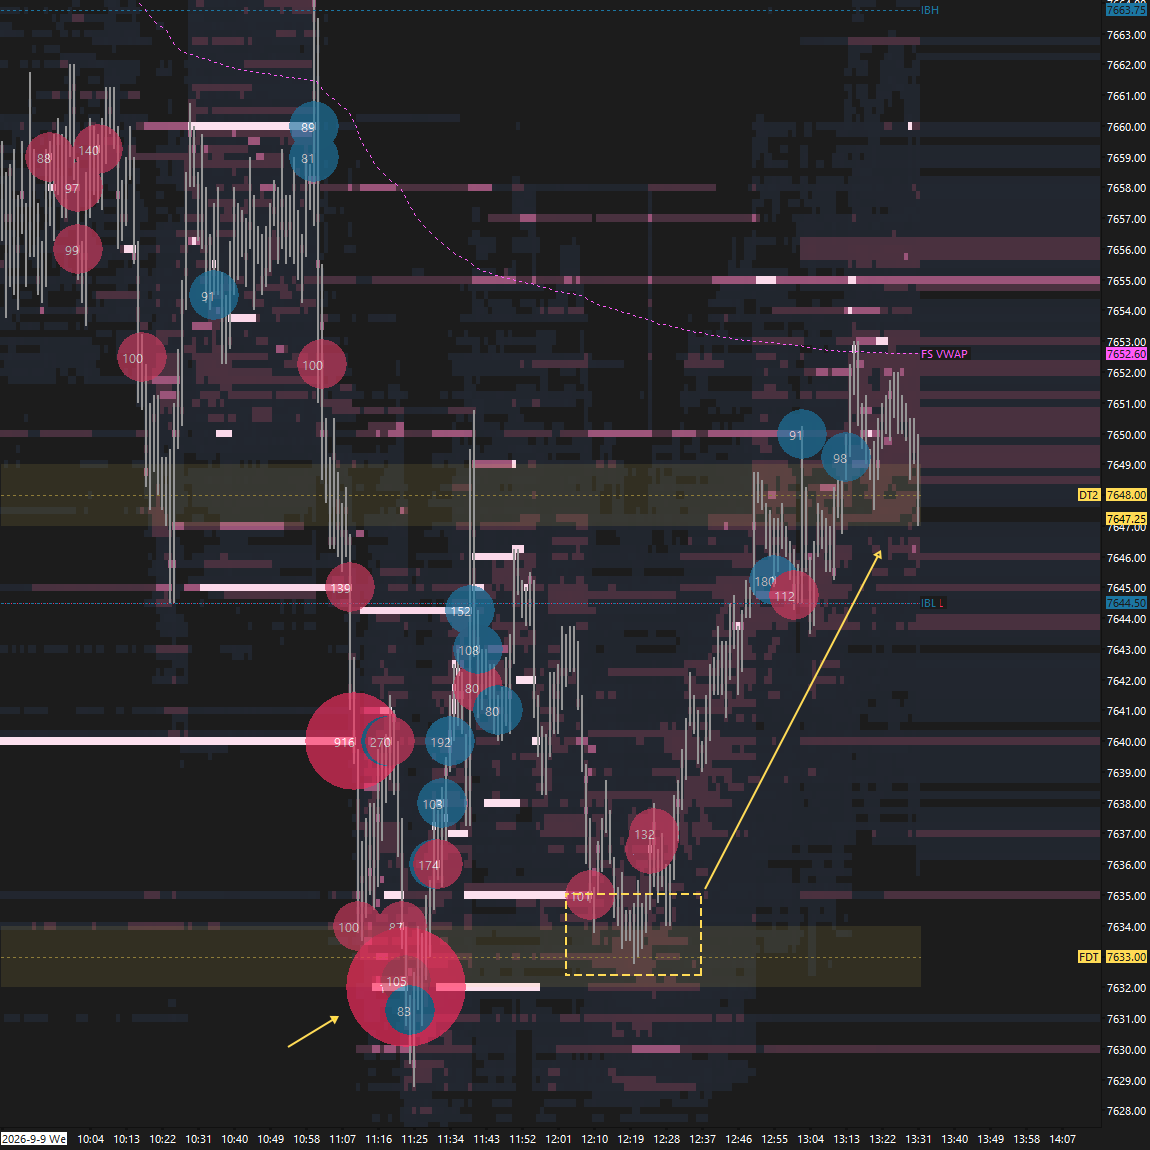
On Wednesday, the downside was capped by the FDT at 7633, which in turn delivered a great reversal from an order flow perspective (see Figure 2). Aggressive selling was initiated at a poor location. That doesn’t mean sellers can’t be right and that the market can’t continue lower, but when their effort is absorbed, it can create a great reversal opportunity by playing against those trapped sellers. That is ultimately what unfolded.
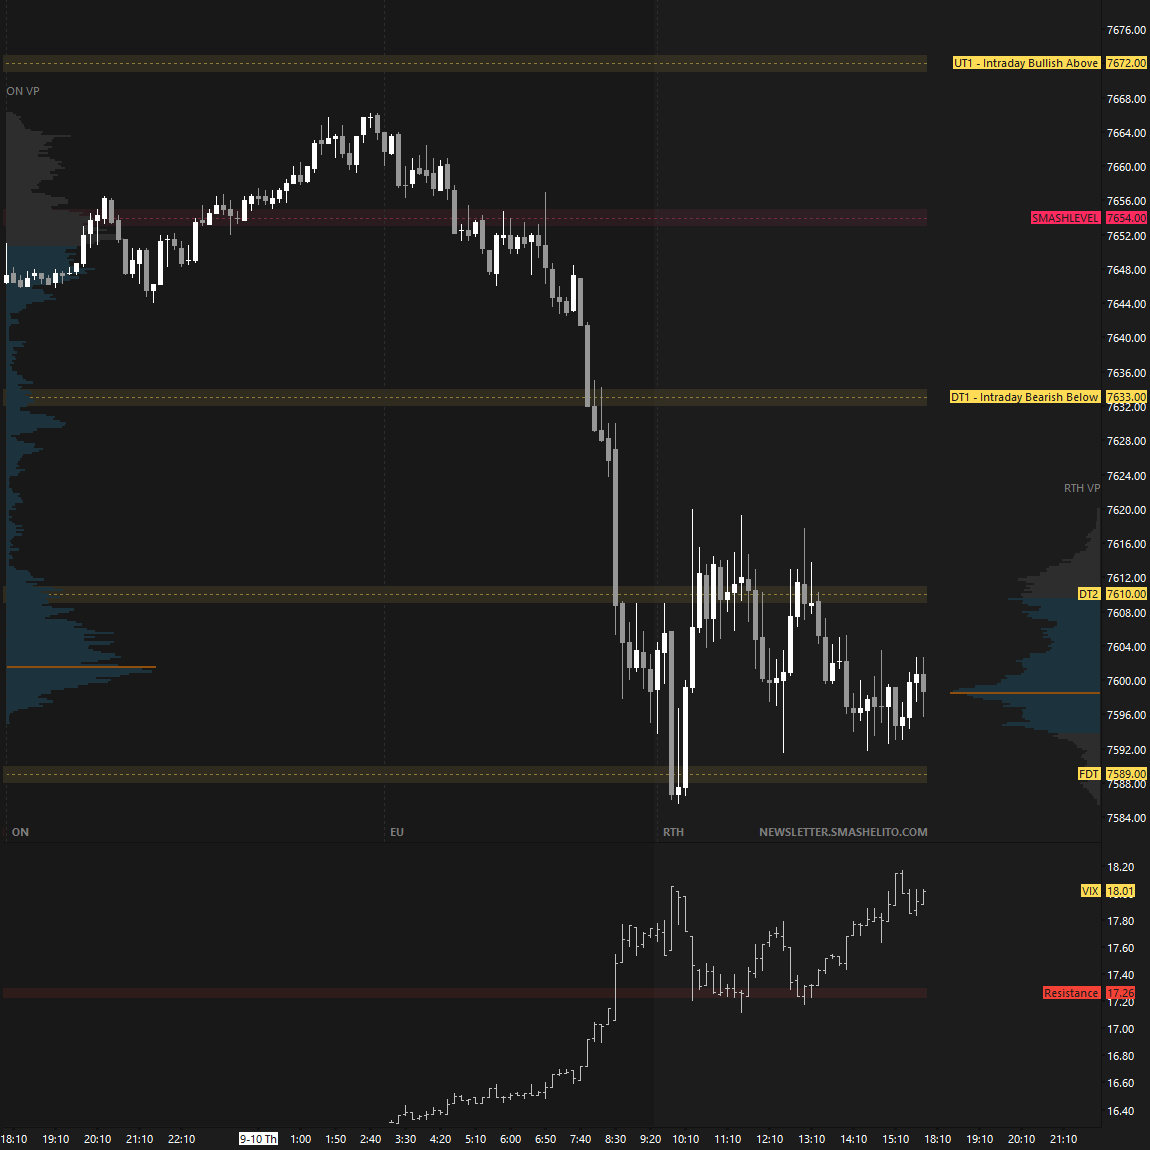
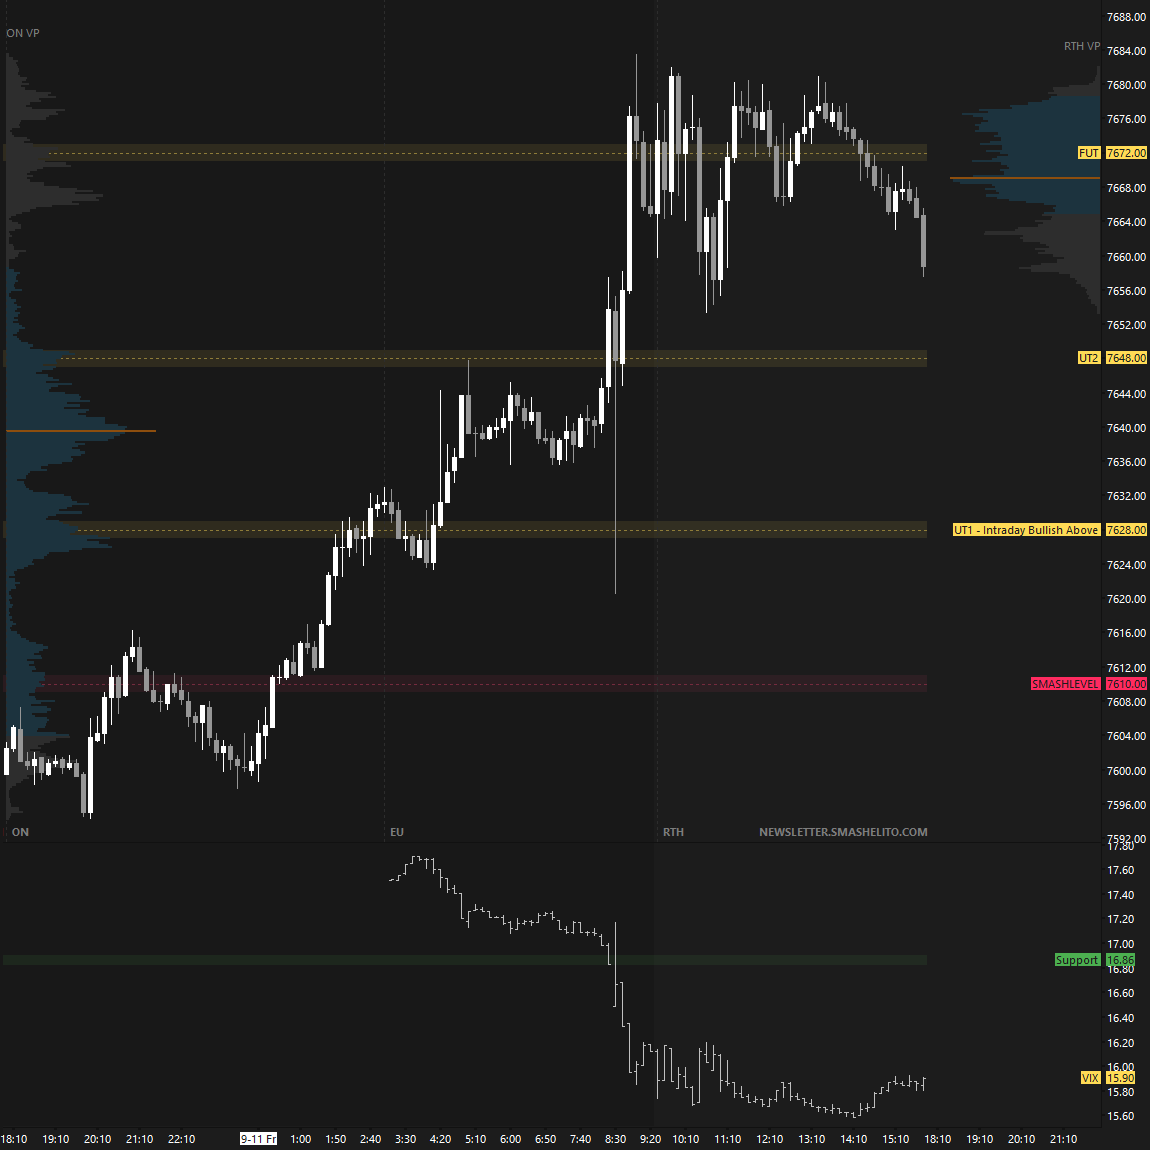
On Thursday, the downside momentum was capped by the FDT at 7589 (see Figure 3), while Friday’s short-covering rally stalled at the FUT at 7672 (see Figure 4).
If we take a look at the weekly levels, we can see how early weakness resulted in a fill of the gap at 7691. Failure to defend 7691 resulted in a test of the prior ATH at 7648, a level sellers attempted to build value below on Thursday. This failed notably, resulting in a short-covering rally on Friday.
Weekly Levels in Review
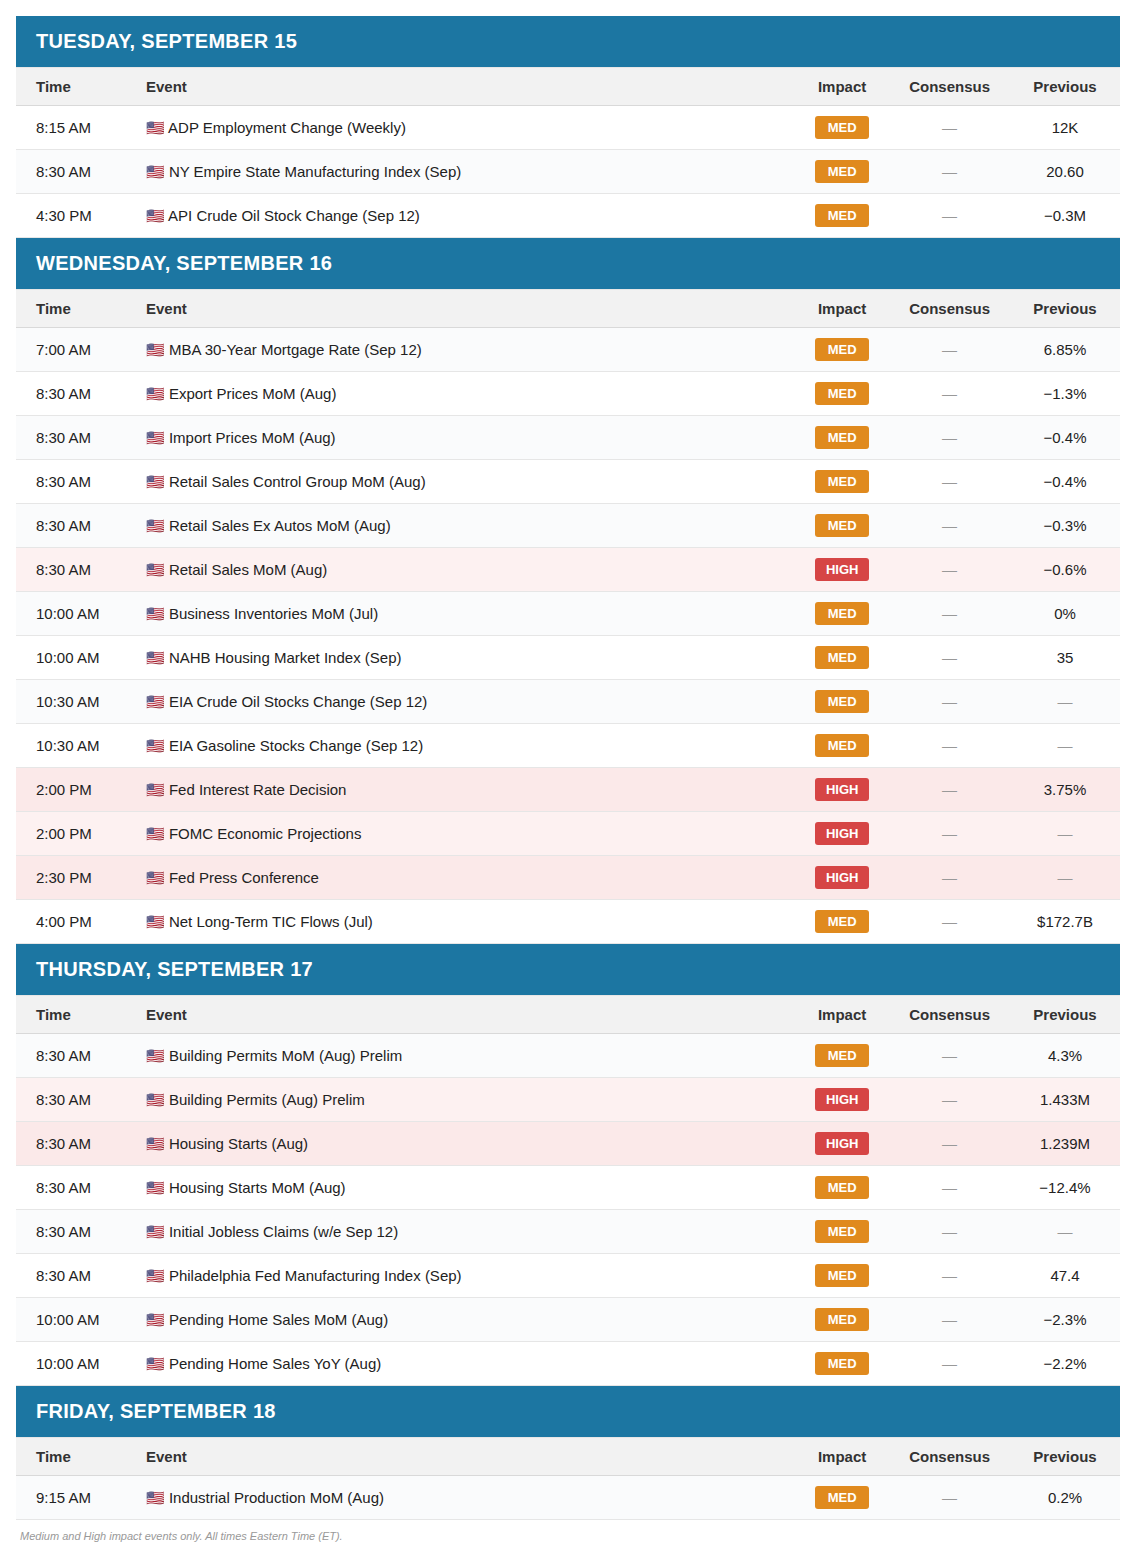
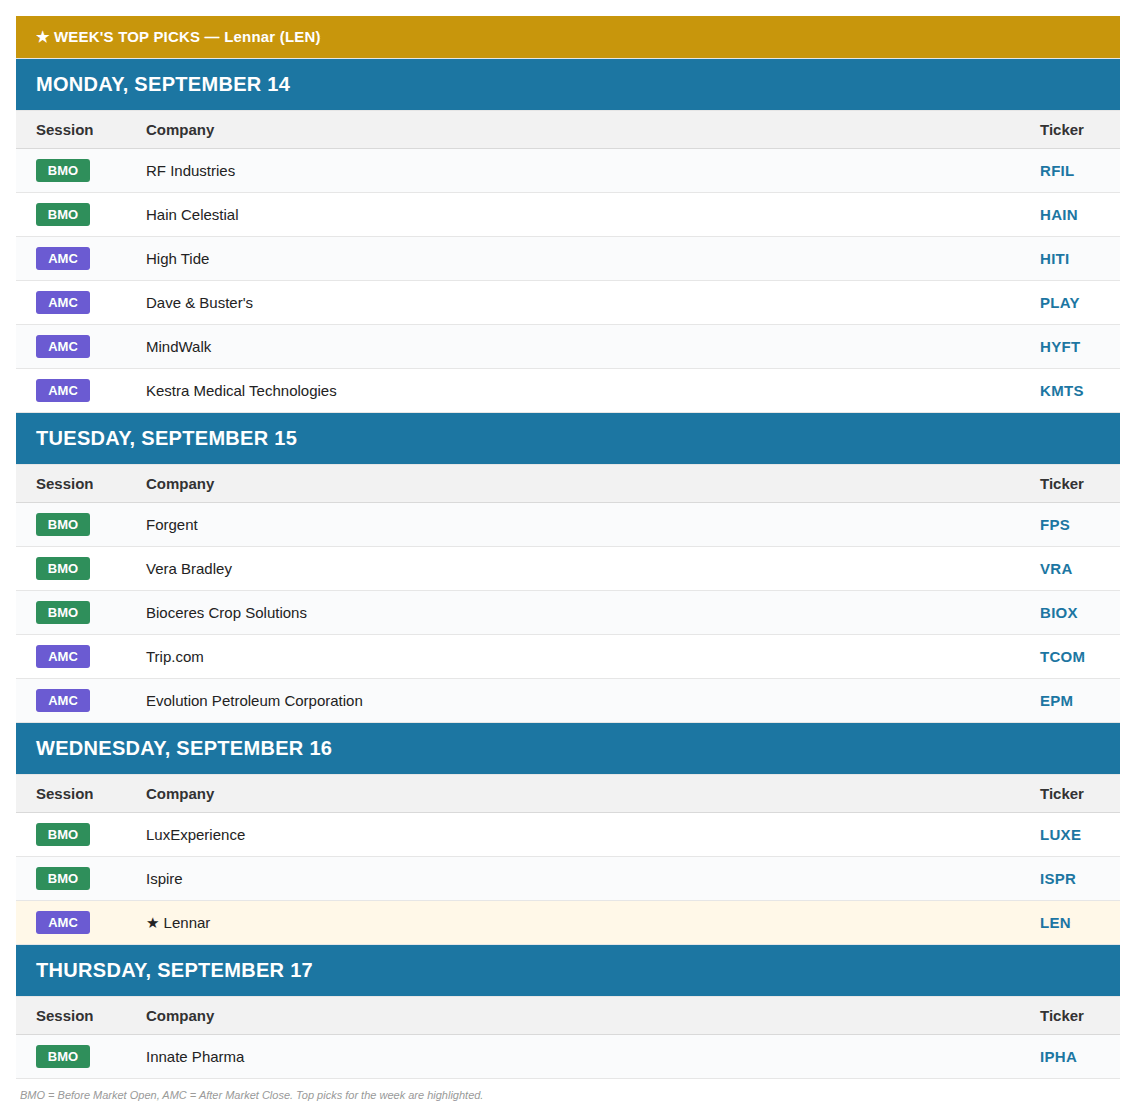
Economic & Earnings Calendar
Market Structure
NOTE: During rollover, one-time framing and balance can appear distorted due to the roll gap. Since I do not back-adjust my charts, expect these concepts to be temporarily skewed during the transition.
🟨 Daily: BALANCE | 3-Day | High: 7682 / Low: 7585.50
🟥 Weekly: OTFD | Ends at: 7717.75
🟩 Monthly: OTFU | Ends at: 7542.75
Balance: A market condition where price consolidates within a defined range, reflecting indecision as the market awaits more market-generated information. We apply balance guidelines, favoring fade trades at range extremes (highs/lows) and preparing for breakout setups if balance resolves.
One-Time Framing Up (OTFU): A market condition where each subsequent bar forms a higher low, signaling a strong upward trend.
One-Time Framing Down (OTFD): A market condition where each subsequent bar forms a lower high, signaling a strong downward trend.
Contract Rollover
Starting Monday, I will transition to the ESZ26 (December) contract.
As always, I do not back-adjust my charts. I’ve marked Friday’s settlements on the chart for both ESU26 (September) at 7659.50 and ESZ26 (December) at 7727.25, reflecting a +67.75 point difference (roll gap).
I recommend marking 7659.50 on your chart, as roll gaps often tend to get filled.
Contract rollovers can be confusing. While some traders back-adjust their charts, I prefer to leave historical levels unchanged, resulting in a visible roll gap. This is purely a matter of personal preference; neither approach is inherently superior, and both have their pros and cons.
For short-term traders, the impact is minimal, since we navigate the market day by day. During rollover periods, I typically scale back activity because order flow becomes noticeably less reliable.
Contextual Analysis & Plan
For this week, the main focus is to stay nimble, as options and VIX expirations, the FOMC meeting, and contract rollover are all on deck—conditions that typically make order flow less reliable.
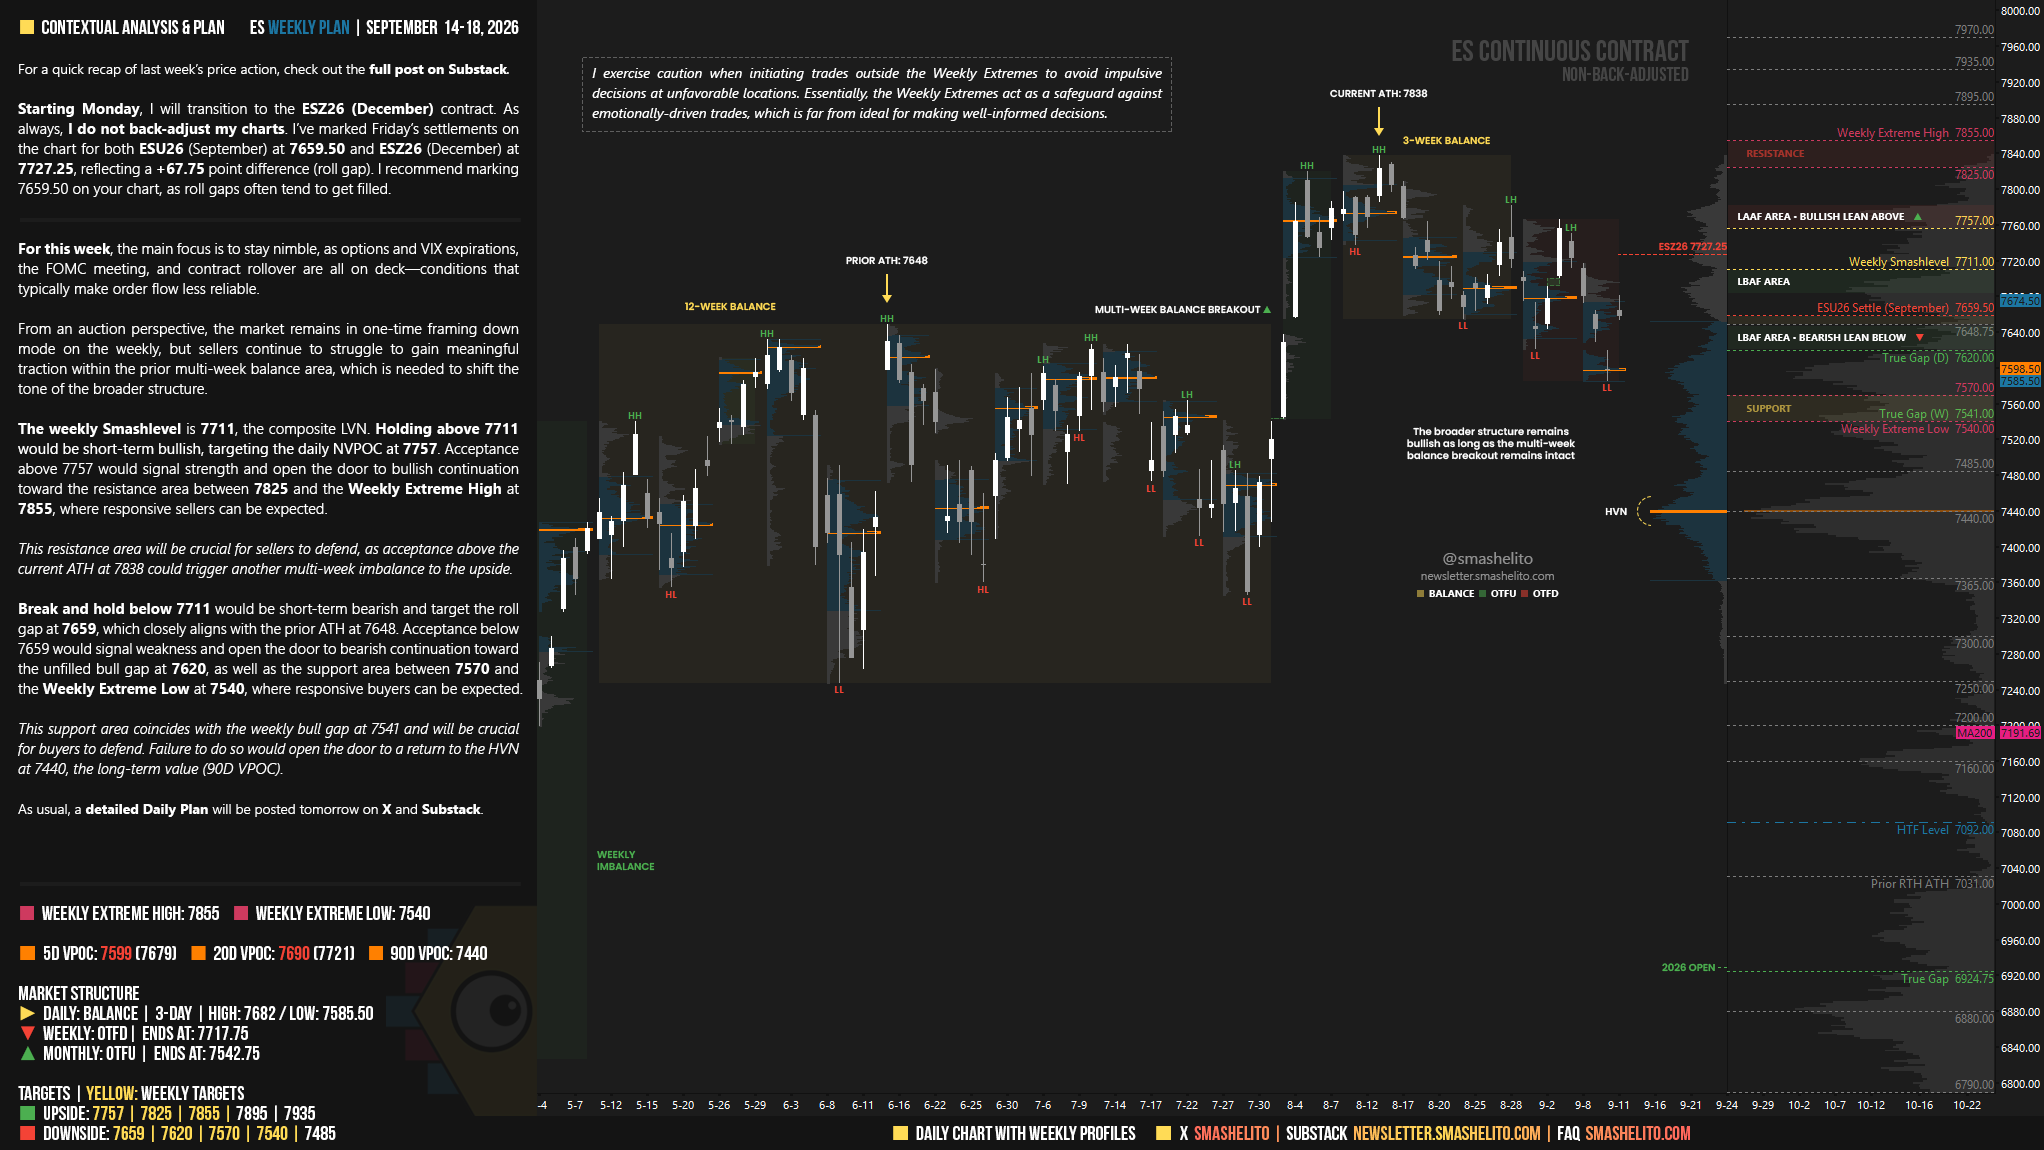
From an auction perspective, the market remains in one-time framing down mode on the weekly, but sellers continue to struggle to gain meaningful traction within the prior multi-week balance area, something they need to achieve to shift the tone of the broader structure.
If we open with weakness, the key for buyers will be to defend the composite LVN at 7711. Failure to defend this area would be short-term bearish and open the door to filling the roll gap at 7659 (ESU26).
If we open with strength, the key for sellers will be to defend the daily NVPOC at 7757. Failure to defend this area would set the stage for a revisit of the all-time highs.
The weekly Smashlevel is 7711, the composite LVN. Holding above 7711 would be short-term bullish, targeting the daily NVPOC at 7757. Acceptance above 7757 would signal strength and open the door to bullish continuation toward the resistance area between 7825 and the Weekly Extreme High at 7855, where responsive sellers can be expected.
This resistance area will be crucial for sellers to defend, as acceptance above the current ATH at 7838 could trigger another multi-week imbalance to the upside.
Break and hold below 7711 would be short-term bearish and target the roll gap at 7659, which closely aligns with the prior ATH at 7648. Acceptance below 7659 would signal weakness and open the door to bearish continuation toward the unfilled bull gap at 7620, as well as the support area between 7570 and the Weekly Extreme Low at 7540, where responsive buyers can be expected.
This support area coincides with the weekly bull gap at 7541 and will be crucial for buyers to defend. Failure to do so would open the door to a return to the HVN at 7440, the long-term value (90D VPOC).
Visual Representation
Key Levels of Interest
In the upcoming week, I will closely observe the behavior around 7711.
Holding above 7711 would target 7757 / 7825 / 7855* / 7895 / 7935
Break and hold below 7711 would target 7659 / 7620 / 7570 / 7540* / 7485
*Weekly Extremes (defined by proprietary models). I exercise caution when initiating trades outside the Weekly Extremes to avoid impulsive decisions at unfavorable locations. Essentially, the Weekly Extremes act as a safeguard against emotionally-driven trades, which is far from ideal for making well-informed decisions.
As usual, a detailed Daily Plan will be posted tomorrow. Hope you all enjoy the rest of the weekend!
Insane squeeze move after the conference. Shorts are getting squeezed early in the ETH
Thank you Smash!