
ES Daily Plan | October 27, 2025
Market Context & Key Levels for the Day Ahead

— For new subscribers
The yellow levels highlighted at the bottom left of the chart are the primary intraday levels I focus on. To avoid impulsive decisions at poor trade locations, I follow a simple but effective rule: exercise caution when initiating trades outside of these yellow levels.
This means I’m cautious about chasing longs above the Final Upside Target (FUT) and shorts below the Final Downside Target (FDT). It’s important to understand that not chasing does not imply initiating a trade in the opposite direction — discipline over impulse.
Be sure to review the Weekly Plan for a broader perspective, key levels, and market expectations for the week ahead.

Contextual Analysis & Plan
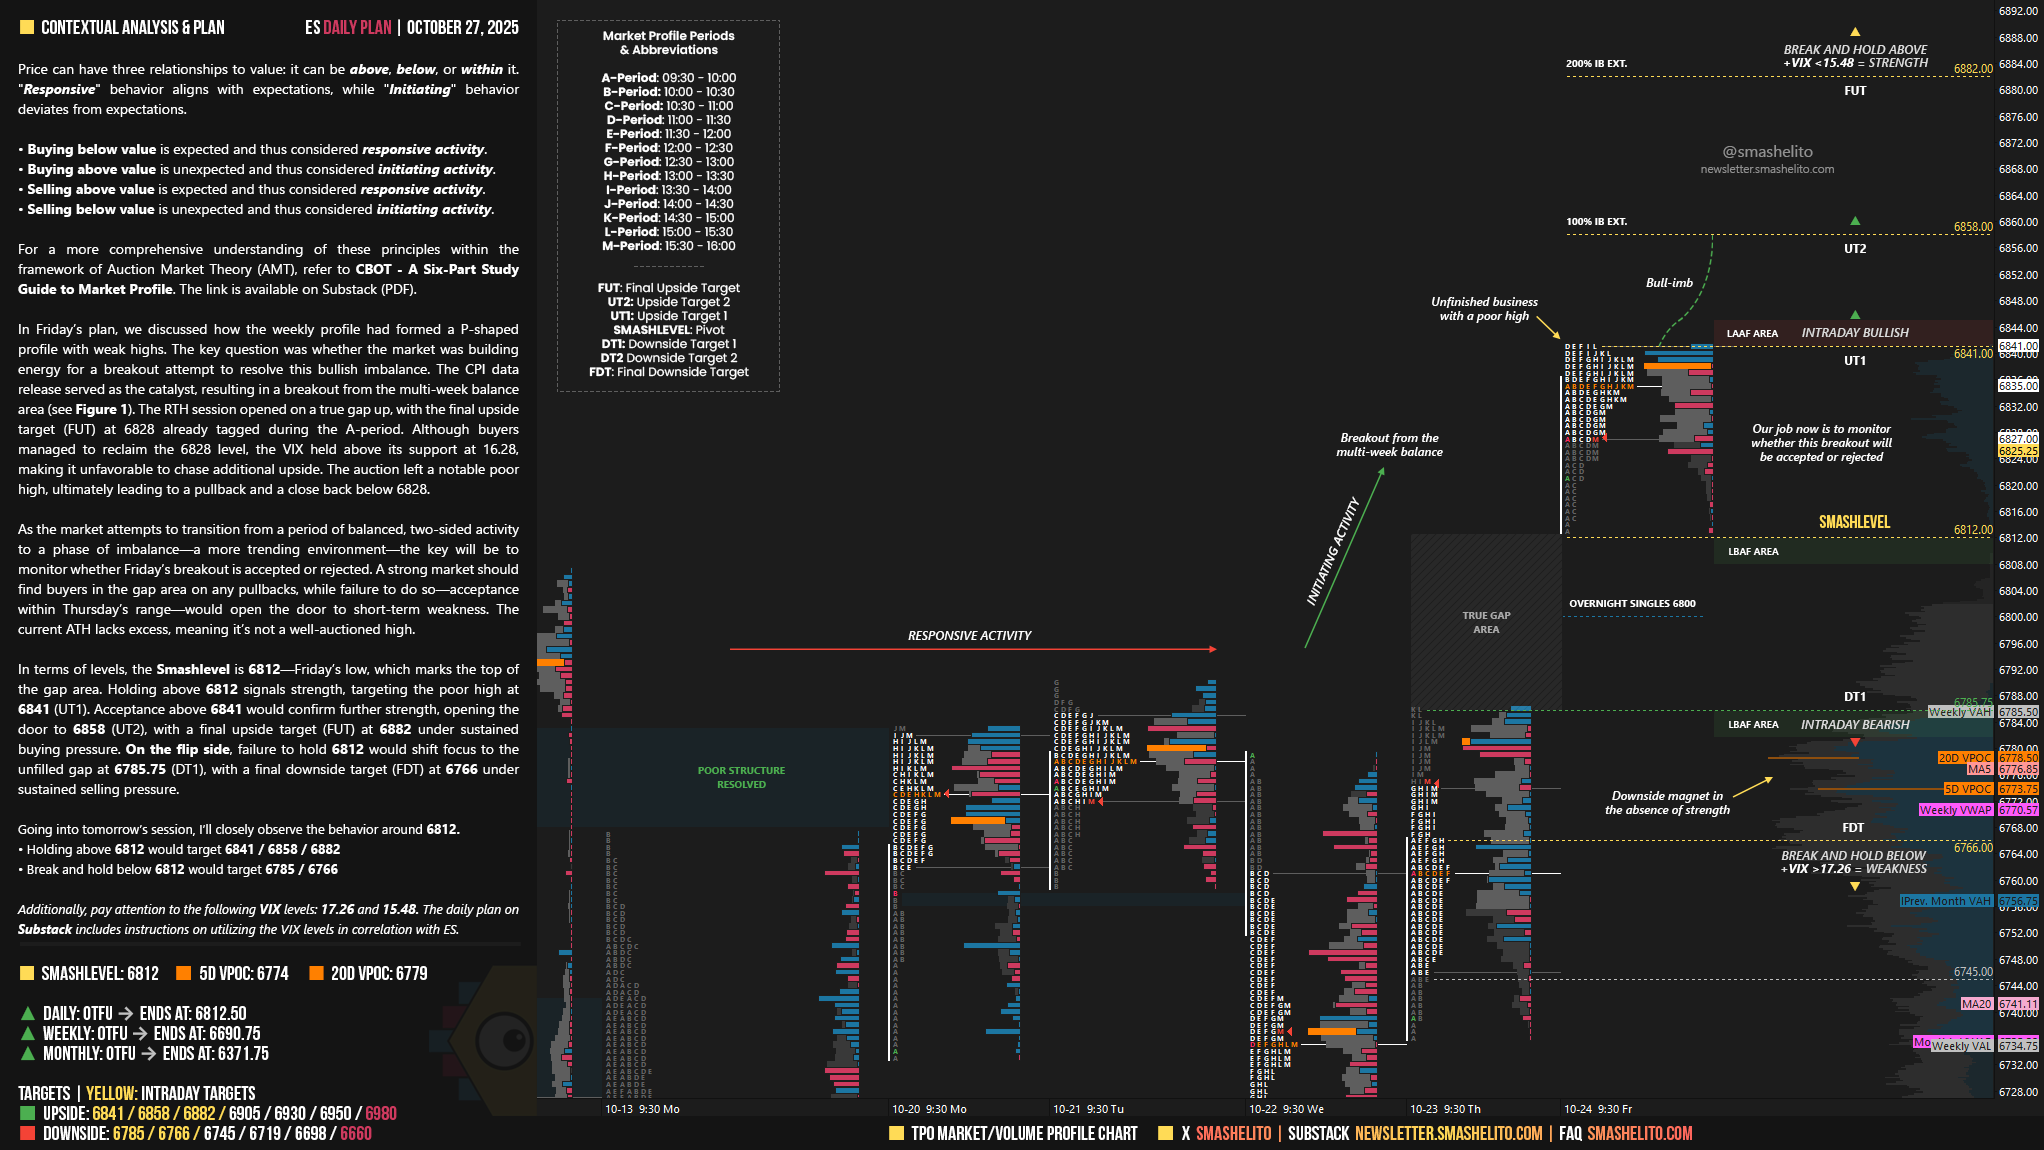
Price can have three relationships to value: it can be above, below, or within it. “Responsive“ behavior aligns with expectations, while “Initiating“ behavior deviates from expectations.
Buying below value is expected and thus considered responsive activity.
Buying above value is unexpected and thus considered initiating activity.
Selling above value is expected and thus considered responsive activity.
Selling below value is unexpected and thus considered initiating activity.
For a more comprehensive understanding of these principles within the framework of Auction Market Theory (AMT), refer to CBOT - A Six-Part Study Guide to Market Profile.
In Friday’s plan, we discussed how the weekly profile had formed a P-shaped profile with weak highs. The key question was whether the market was building energy for a breakout attempt to resolve this bullish imbalance. The CPI data release served as the catalyst, resulting in a breakout from the multi-week balance area (see Figure 1).
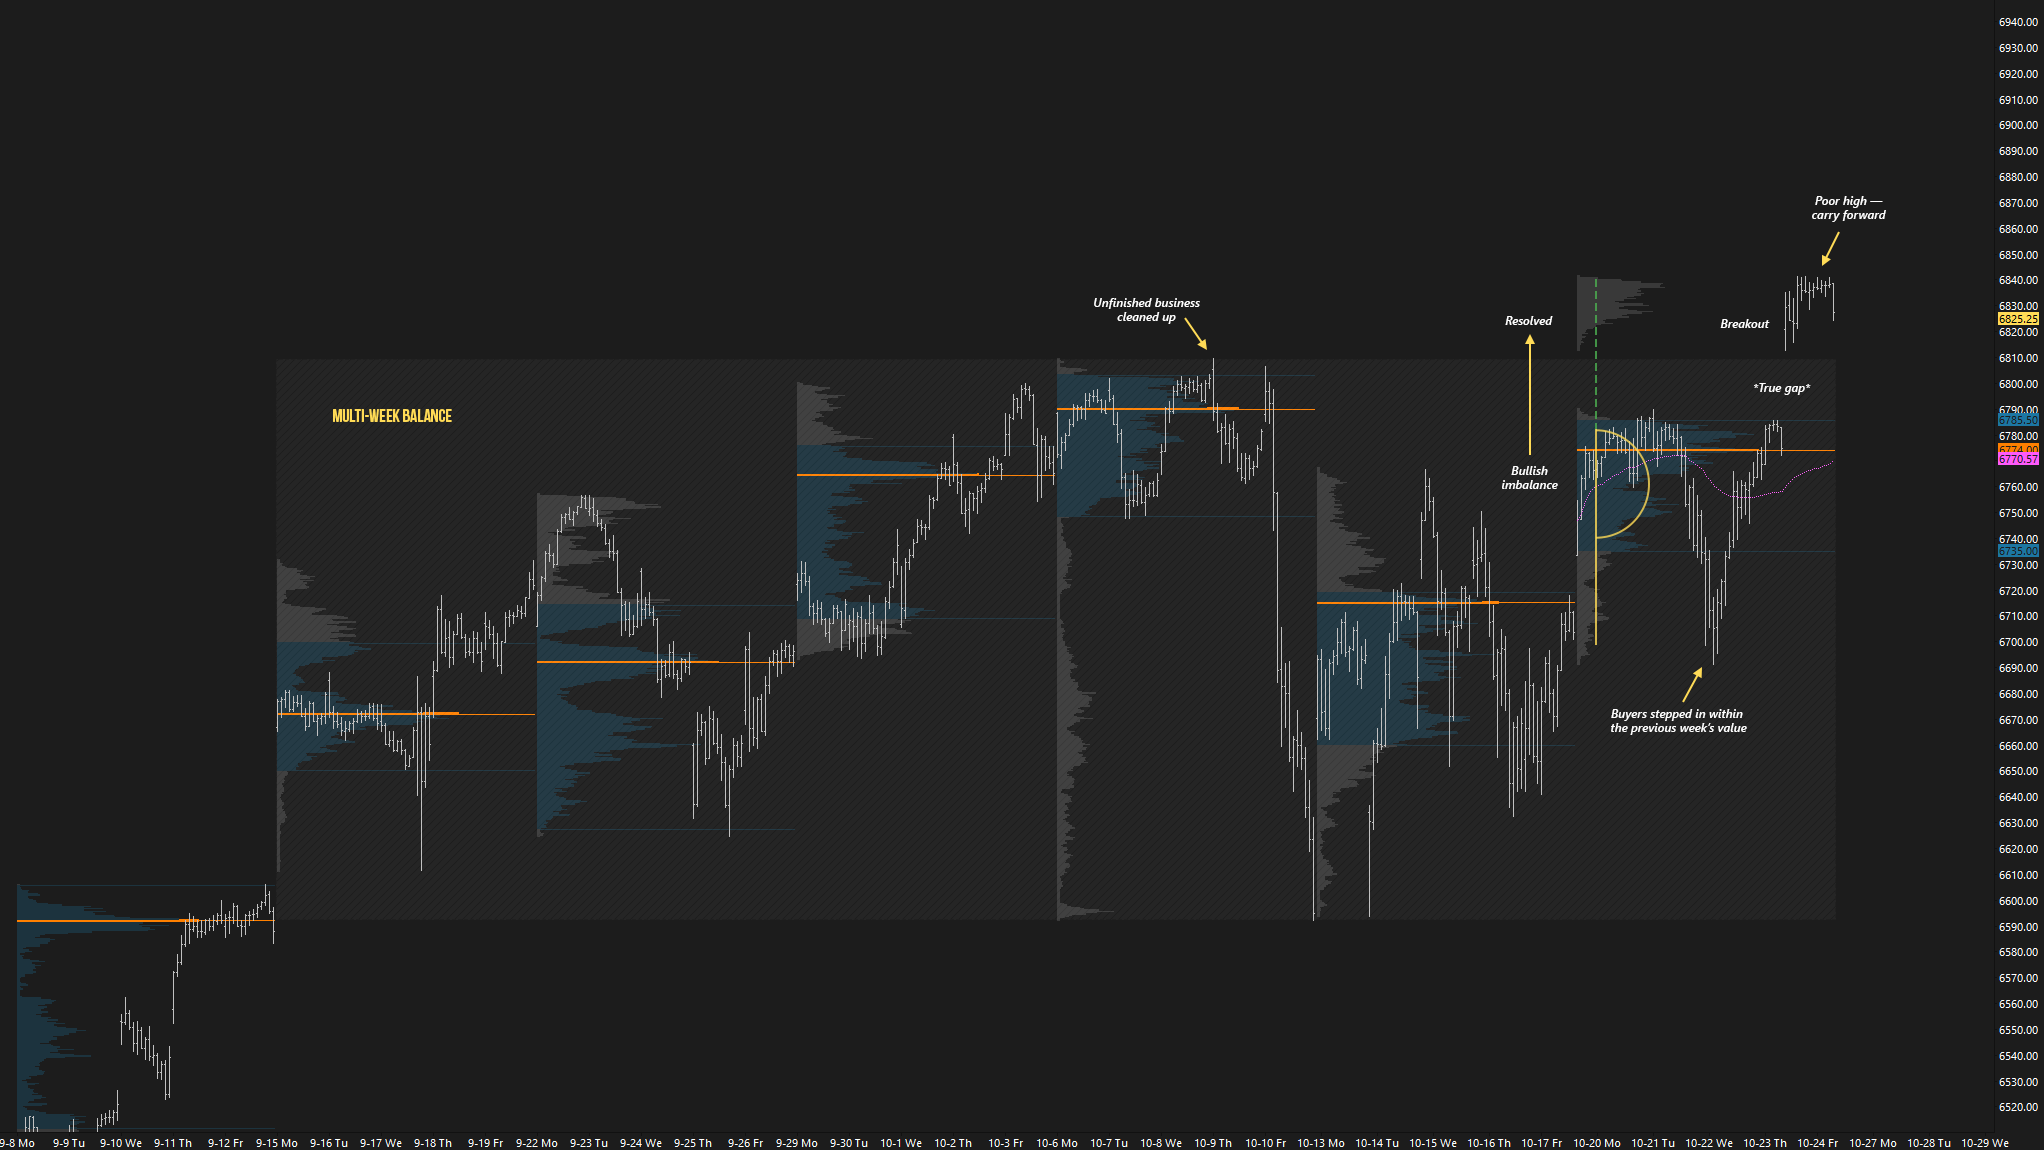
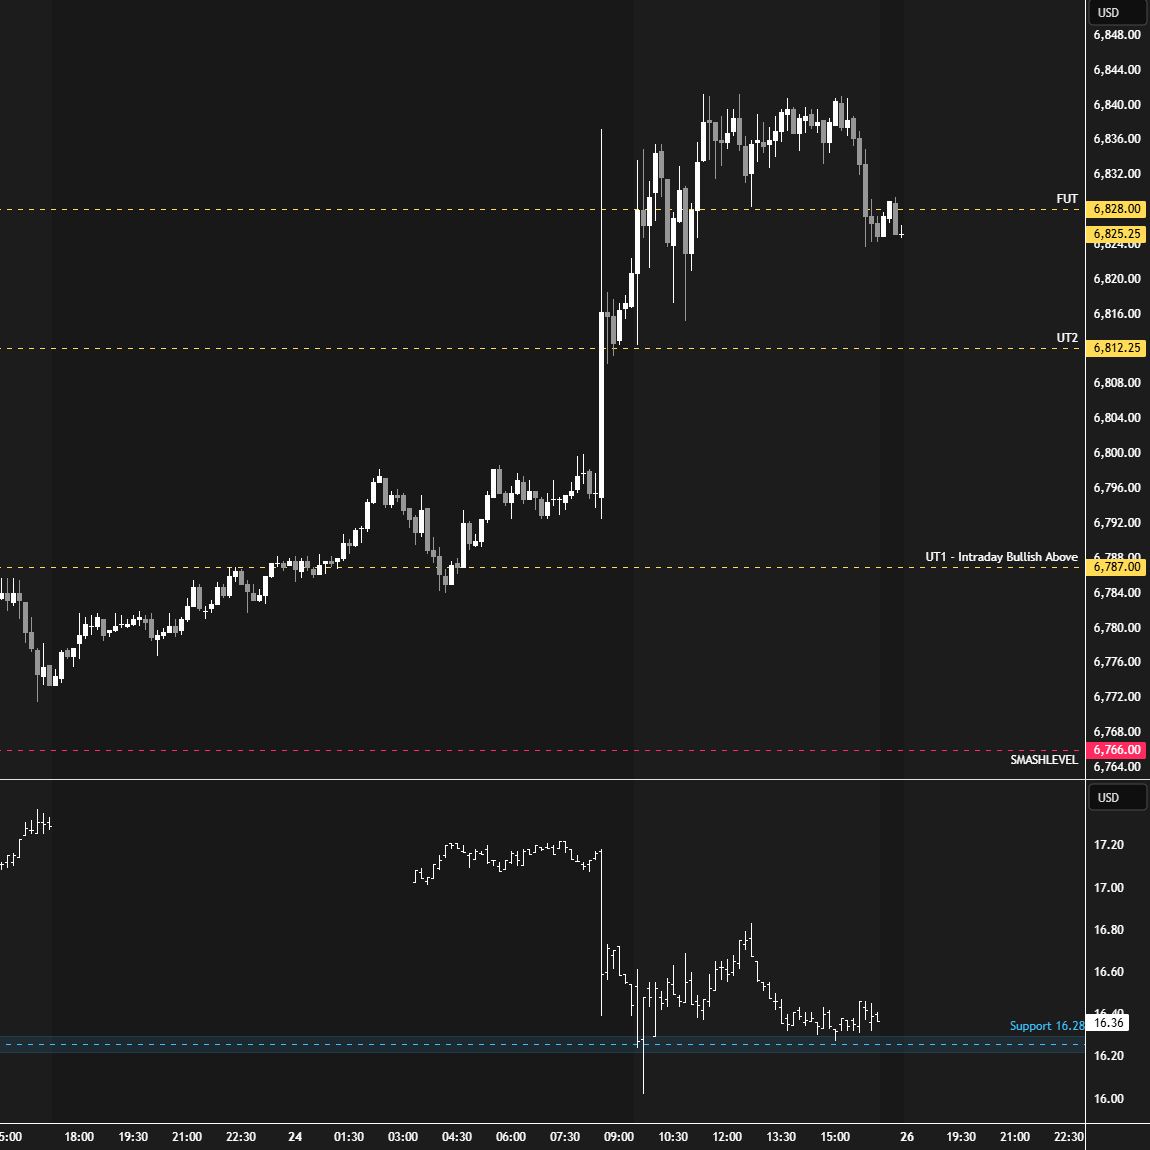
The RTH session opened on a true gap up, with the final upside target (FUT) at 6828 already tagged during the A-period. Although buyers managed to reclaim the 6828 level, the VIX held above its support at 16.28, making it unfavorable to chase additional upside. The auction left a notable poor high, ultimately leading to a pullback and a close back below 6828.
As the market attempts to transition from a period of balanced, two-sided activity to a phase of imbalance—a more trending environment—the key will be to monitor whether Friday’s breakout is accepted or rejected. A strong market should find buyers in the gap area on any pullbacks, while failure to do so—acceptance within Thursday’s range—would open the door to short-term weakness. The current ATH lacks excess, meaning it’s not a well-auctioned high.
In terms of levels, the Smashlevel is 6812—Friday’s low, which marks the top of the gap area. Holding above 6812 signals strength, targeting the poor high at 6841 (UT1). Acceptance above 6841 would confirm further strength, opening the door to 6858 (UT2), with a final upside target (FUT) at 6882 under sustained buying pressure.
On the flip side, failure to hold 6812 would shift focus to the unfilled gap at 6785.75 (DT1), with a final downside target (FDT) at 6766 under sustained selling pressure.
Levels of Interest
Going into tomorrow’s session, I’ll closely observe the behavior around 6812.
Holding above 6812 would target 6841 / 6858 / 6882
Break and hold below 6812 would target 6785 / 6766
Additionally, pay attention to the following VIX levels: 17.26 and 15.48. These levels can provide confirmation of strength or weakness.
Break and hold above 6882 with VIX below 15.48 would confirm strength.
Break and hold below 6766 with VIX above 17.26 would confirm weakness.
Overall, it's important to exercise caution when trading outside of the highlighted yellow levels. A non-cooperative VIX may suggest possible reversals i.e trade setups.
ES already touched FUT 😭😭😭
Thanks for sharing the CBOT guide!
Looking forward to Wednesday!!