
ES Daily Plan | October 24, 2025
Market Context & Key Levels for the Day Ahead

— For new subscribers
The yellow levels highlighted at the bottom left of the chart are the primary intraday levels I focus on. To avoid impulsive decisions at poor trade locations, I follow a simple but effective rule: exercise caution when initiating trades outside of these yellow levels.
This means I’m cautious about chasing longs above the Final Upside Target (FUT) and shorts below the Final Downside Target (FDT). It’s important to understand that not chasing does not imply initiating a trade in the opposite direction — discipline over impulse.
Be sure to review the ES Weekly Plan | October 20-24, 2025 for a broader perspective, key levels, and market expectations for the week ahead.
Contextual Analysis & Plan
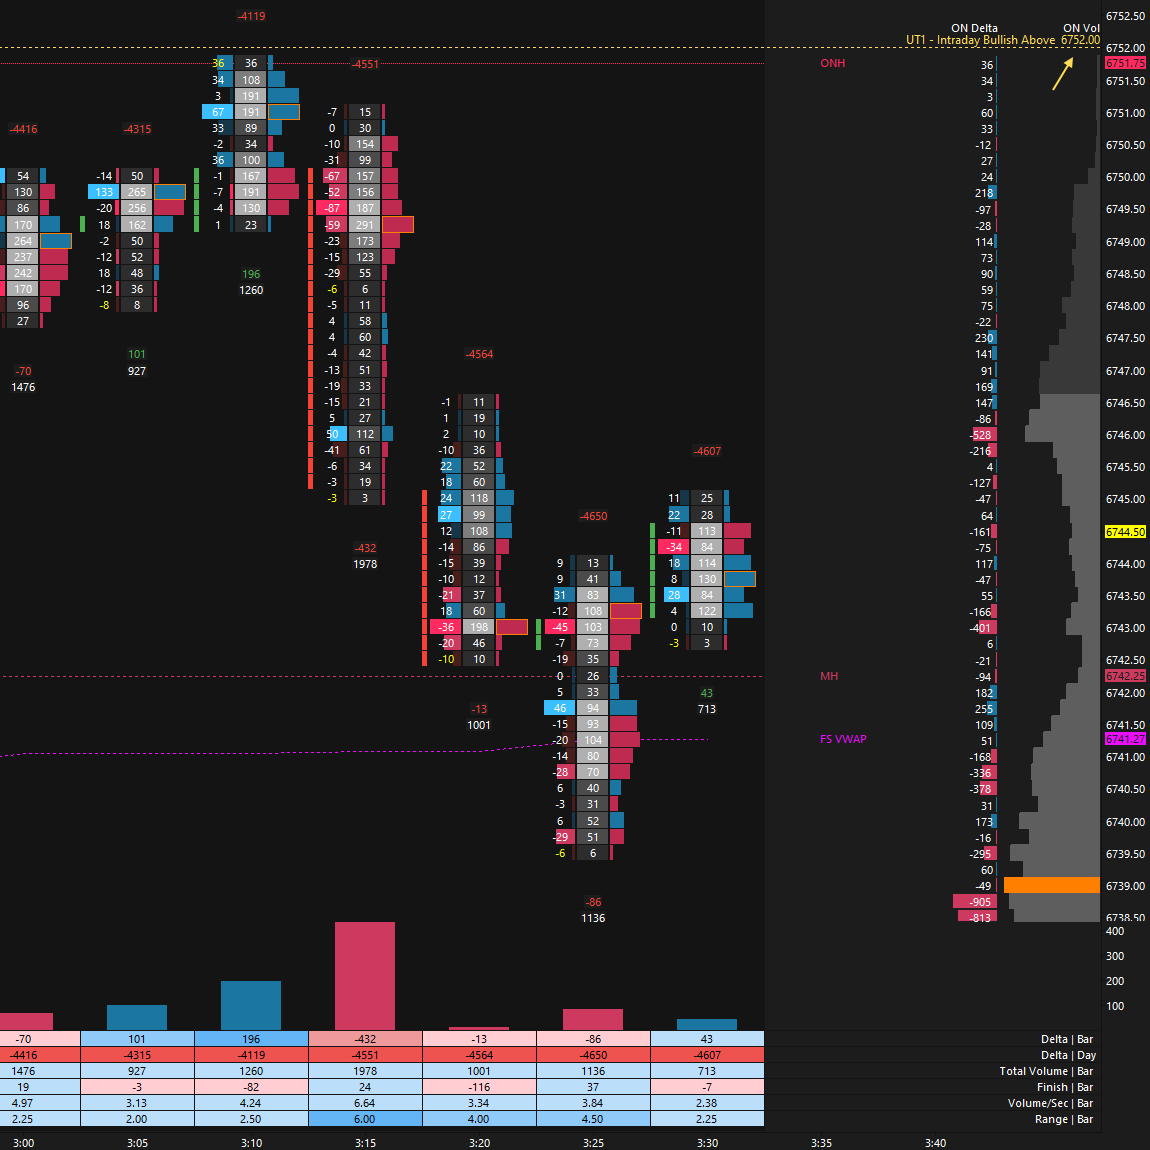
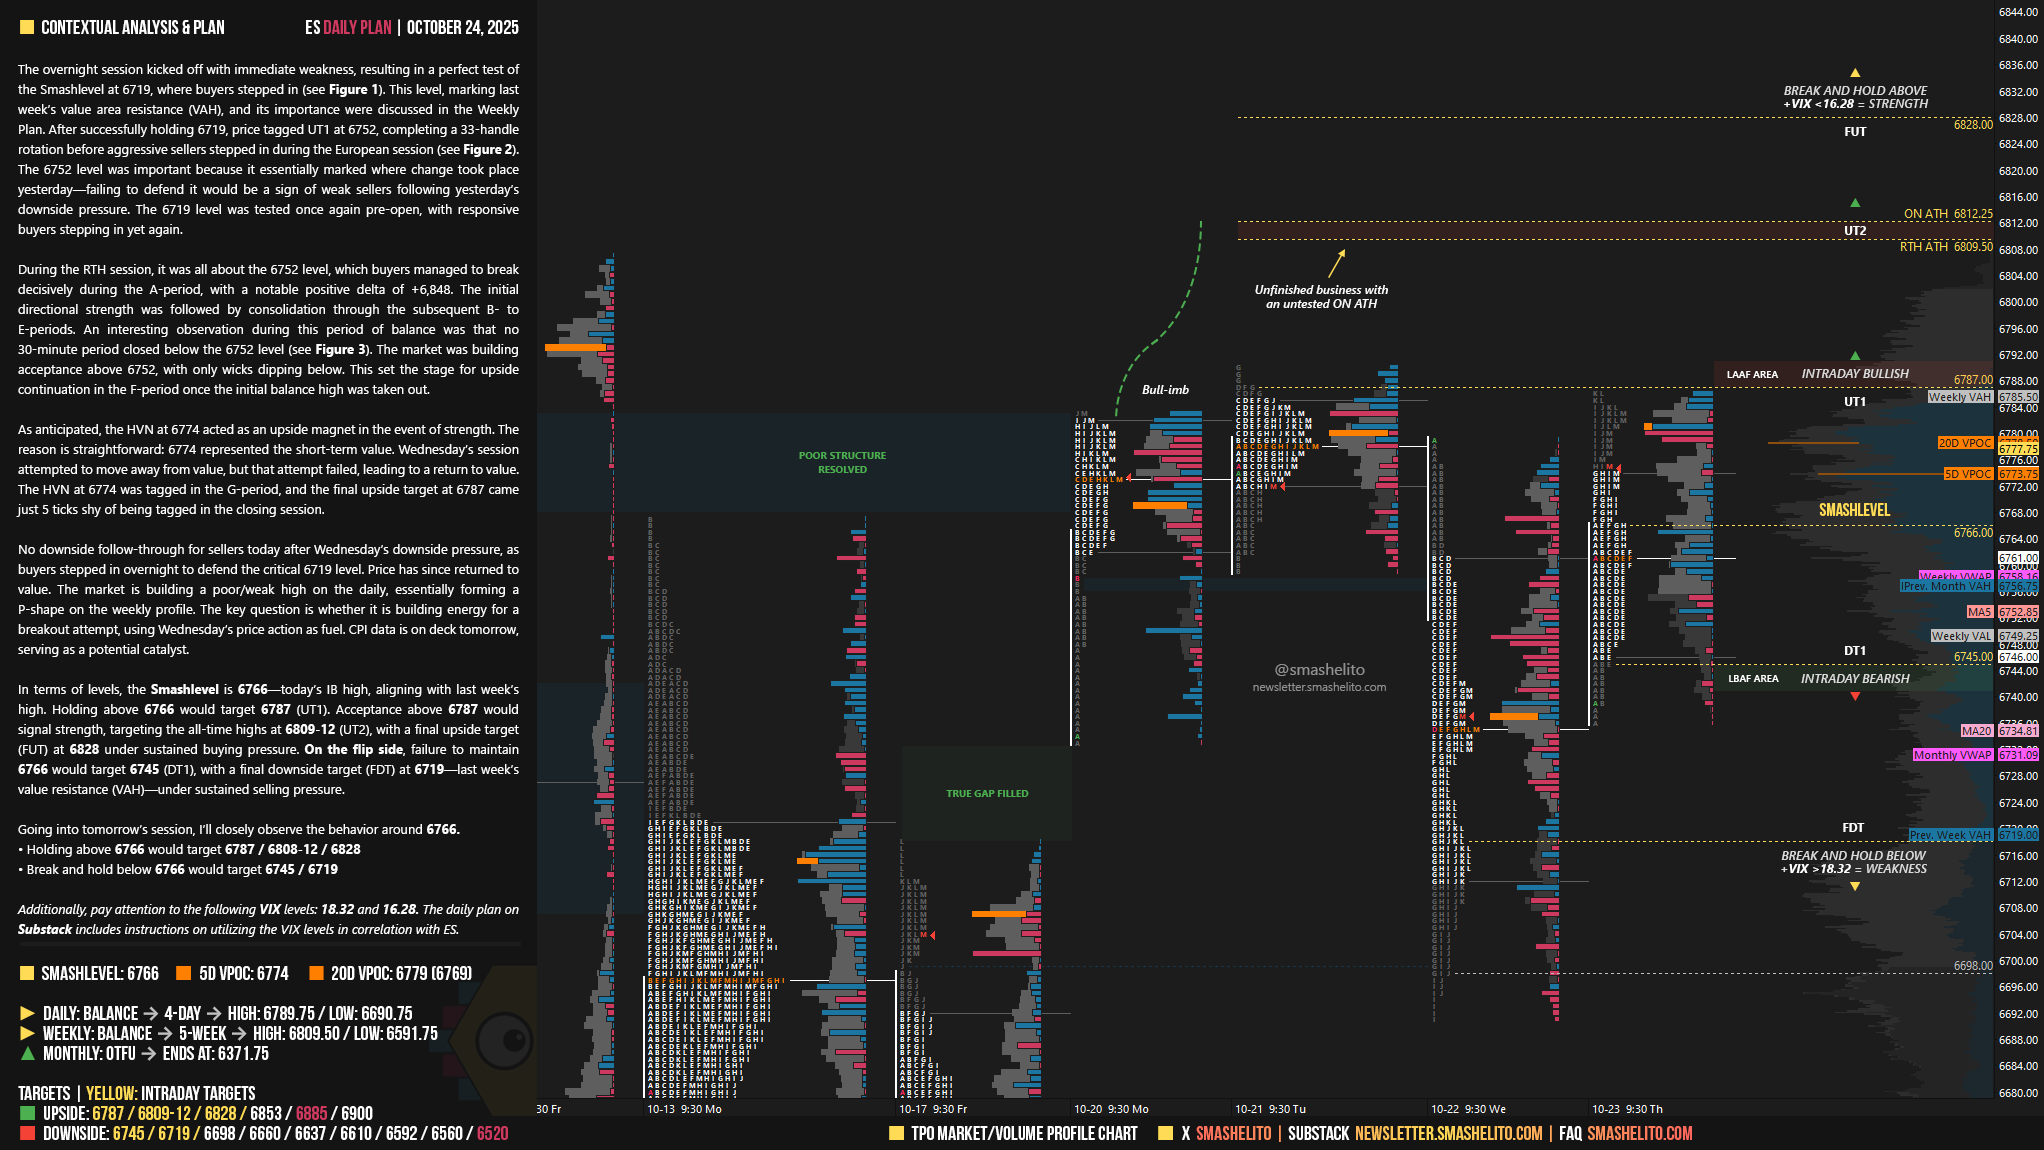
The overnight session kicked off with immediate weakness, resulting in a perfect test of the Smashlevel at 6719, where buyers stepped in (see Figure 1). This level, marking last week’s value area resistance (VAH), and its importance were discussed in the Weekly Plan. After successfully holding 6719, price tagged UT1 at 6752, completing a 33-handle rotation before aggressive sellers stepped in during the European session (see Figure 2). The 6752 level was important because it essentially marked where change took place yesterday—failing to defend it would be a sign of weak sellers following yesterday’s downside pressure. The 6719 level was tested once again pre-open, with responsive buyers stepping in yet again.
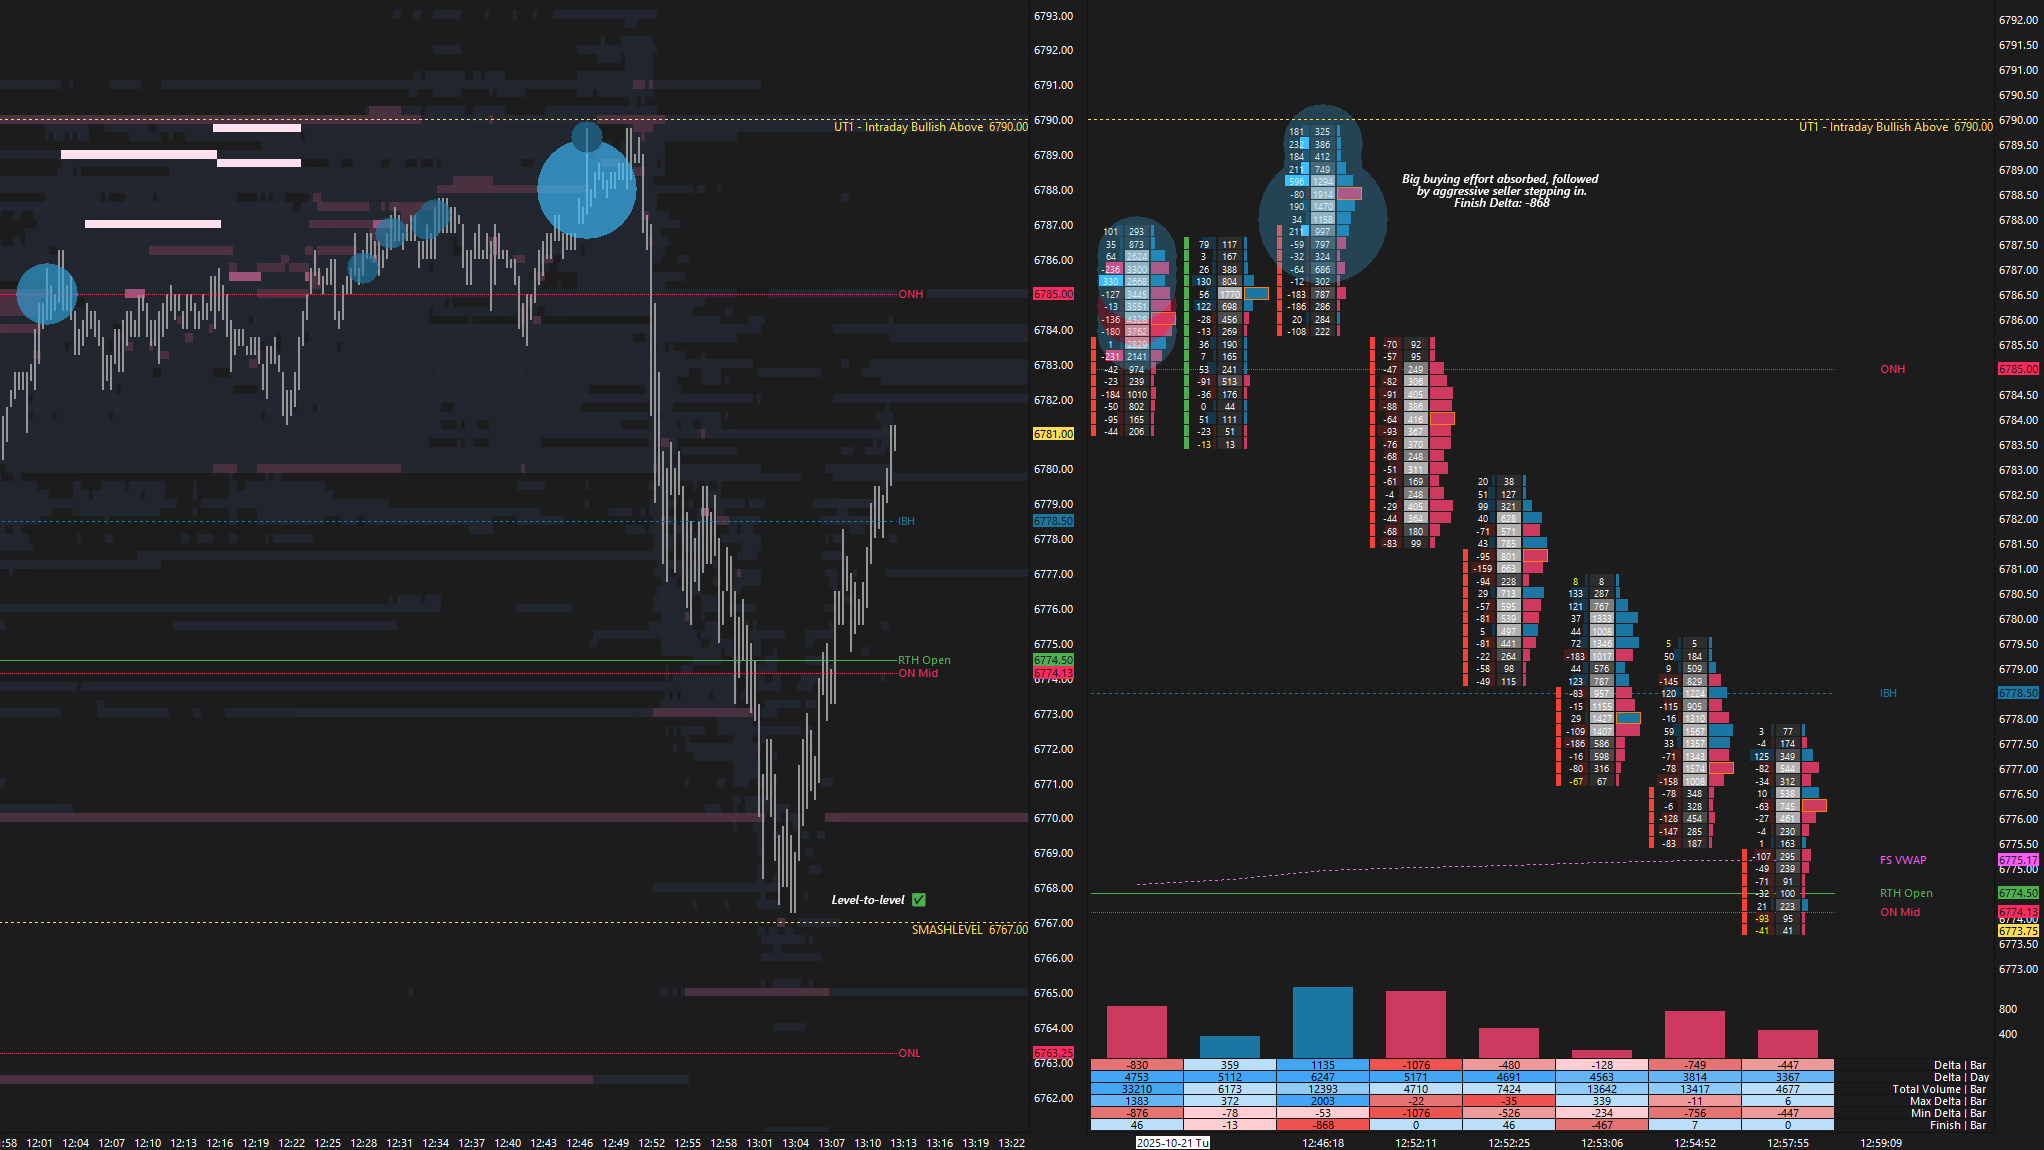
During the RTH session, it was all about the 6752 level, which buyers managed to break decisively during the A-period, with a notable positive delta of +6,848. The initial directional strength was followed by consolidation through the subsequent B- to E-periods. An interesting observation during this period of balance was that no 30-minute period closed below the 6752 level (see Figure 3). The market was building acceptance above 6752, with only wicks dipping below. This set the stage for upside continuation in the F-period once the initial balance high was taken out.
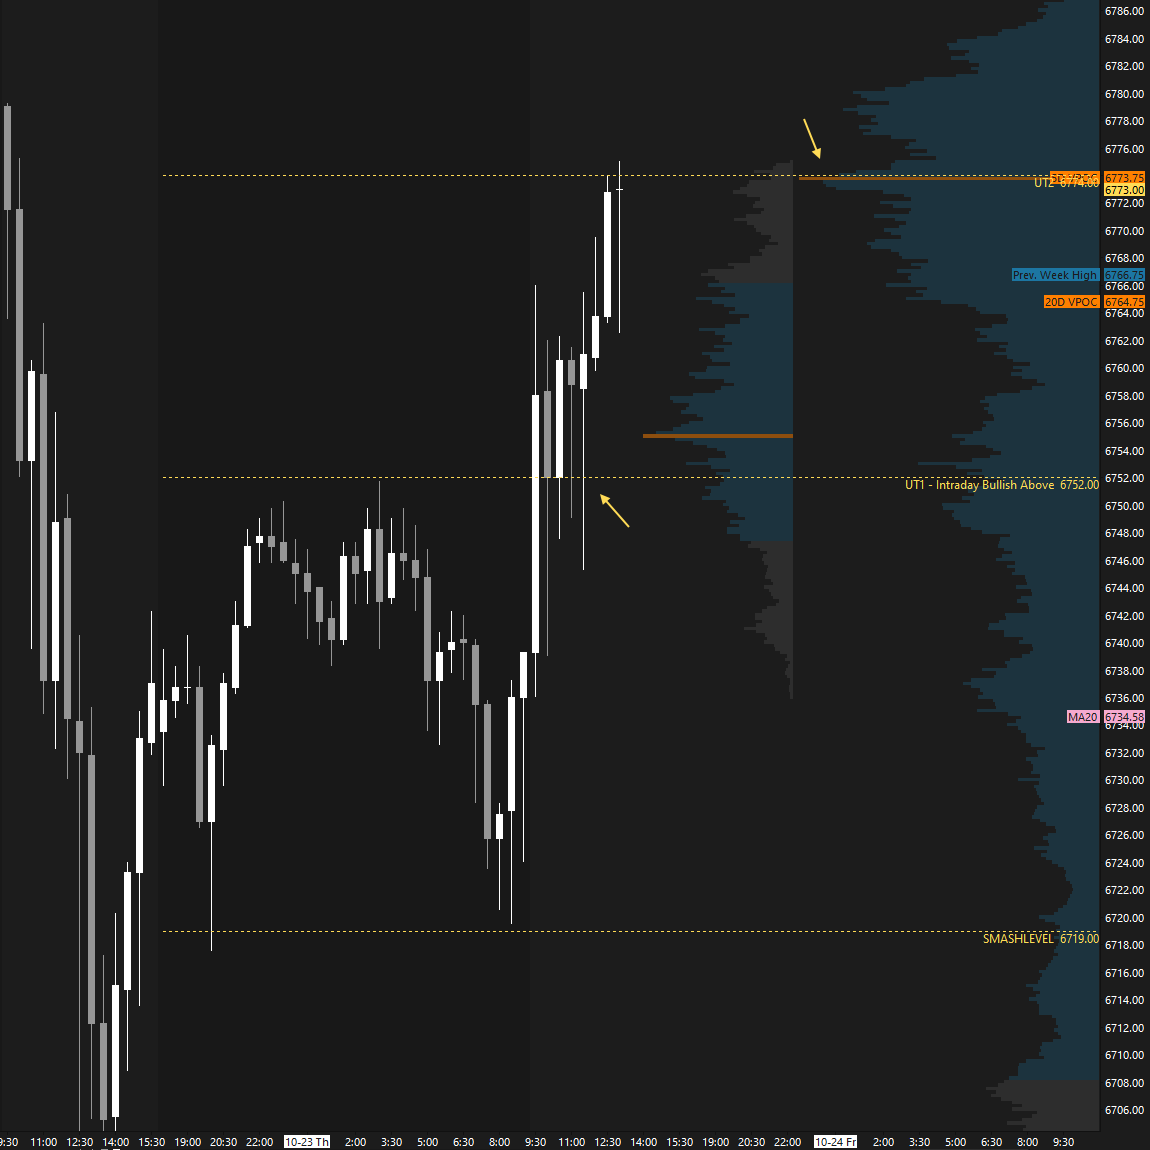
As anticipated, the HVN at 6774 acted as an upside magnet in the event of strength. The reason is straightforward: 6774 represented the short-term value. Wednesday’s session attempted to move away from value, but that attempt failed, leading to a return to value. The HVN at 6774 was tagged in the G-period, and the final upside target at 6787 came just 5 ticks shy of being tagged in the closing session.
No downside follow-through for sellers today after Wednesday’s downside pressure, as buyers stepped in overnight to defend the critical 6719 level. Price has since returned to value. The market is building a poor/weak high on the daily, essentially forming a P-shape on the weekly profile. The key question is whether it is building energy for a breakout attempt, using Wednesday’s price action as fuel. CPI data is on deck tomorrow, serving as a potential catalyst.
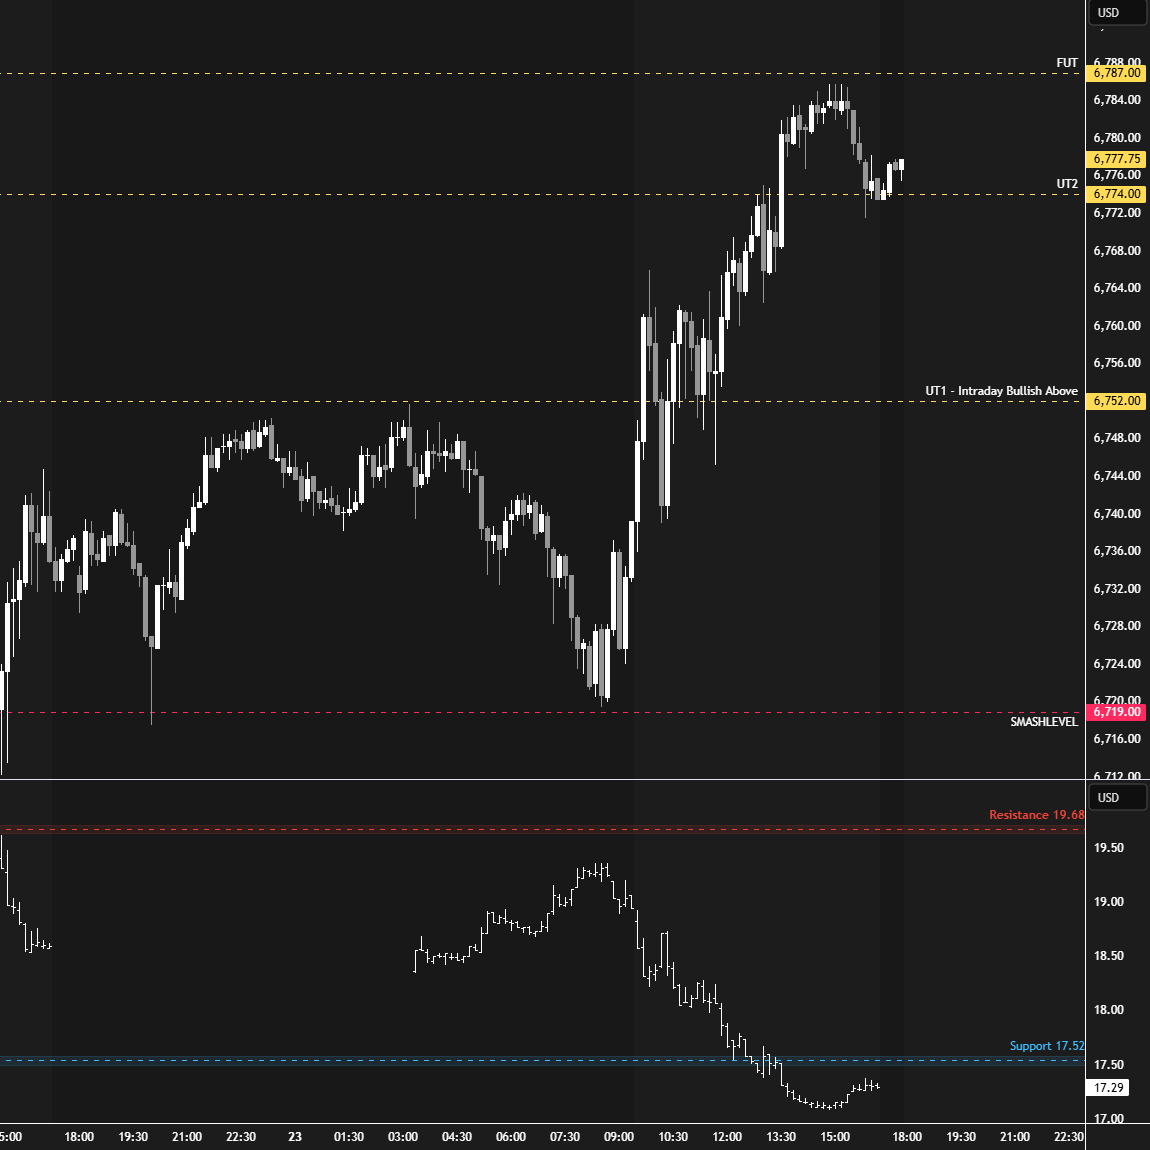
In terms of levels, the Smashlevel is 6766—today’s IB high, aligning with last week’s high. Holding above 6766 would target 6787 (UT1). Acceptance above 6787 would signal strength, targeting the all-time highs at 6809-12 (UT2), with a final upside target (FUT) at 6828 under sustained buying pressure.
On the flip side, failure to maintain 6766 would target 6745 (DT1), with a final downside target (FDT) at 6719—last week’s value resistance (VAH)—under sustained selling pressure.
Levels of Interest
Going into tomorrow’s session, I’ll closely observe the behavior around 6766.
Holding above 6766 would target 6787 / 6808-12 / 6828
Break and hold below 6766 would target 6745 / 6719
Additionally, pay attention to the following VIX levels: 18.32 and 16.28. These levels can provide confirmation of strength or weakness.
Break and hold above 6828 with VIX below 16.28 would confirm strength.
Break and hold below 6719 with VIX above 18.32 would confirm weakness.
Overall, it's important to exercise caution when trading outside of the highlighted yellow levels. A non-cooperative VIX may suggest possible reversals i.e trade setups.
Absolutely smashed it! Thanks!
Hi Smash and to everyone.
First of all THANK YOU VERY MUCH your explanation of the 6752.00 level ! Without the adequate software we, the TradingView users, can only extract assumptions from the structure of every 30-min candlestick.
Your contextual analysis and explanation, in paragraph 1 & 2, taught me to take into consideration every significant change of price through the Globex hours, and not only the price just before the RTH session or a bit after the opening.
Thank you for taking the time to highlight the importance and significance of the 6752.00. It's a useful lesson for me for paying attention the changes throughout the Globex sessions.
Note that the 6719.00 level it's not in the figure 2. It is in the figure 3 of your newsletter. I read several times every single analysis and time I read the ES_F chart again and again for understanding the reasoning behind the numbers/levels/key levels/ Smashlevel/ poor structure/unfinished business/ single prints etc.
p.s. I'm old man and learnt to write long explicit letters. So, apologies for the length of the present letter. Stay blessed. Sii benedetto, Santo Manuelito.