
ES Daily Plan | November 6, 2025
Market Context & Key Levels for the Day Ahead

— For new subscribers
The yellow levels highlighted at the bottom left of the chart are the primary intraday levels I focus on. To avoid impulsive decisions at poor trade locations, I follow a simple but effective rule: exercise caution when initiating trades outside of these yellow levels.
This means I’m cautious about chasing longs above the Final Upside Target (FUT) and shorts below the Final Downside Target (FDT). It’s important to understand that not chasing does not imply initiating a trade in the opposite direction — discipline over impulse.
Be sure to review the Weekly Plan for a broader perspective, key levels, and market expectations for the week ahead.

Contextual Analysis & Plan
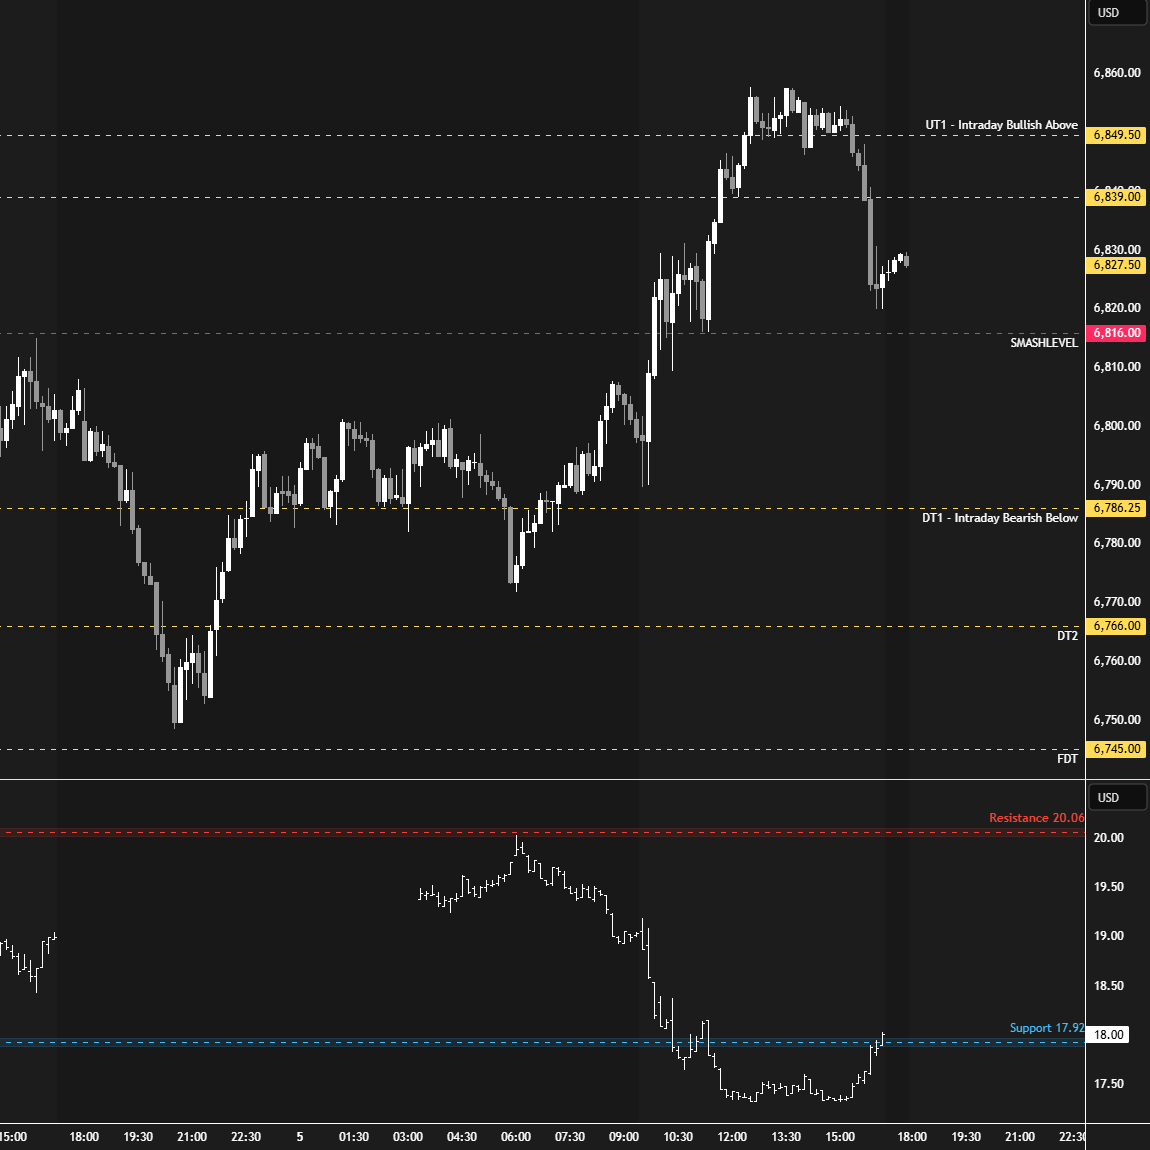
Tuesday’s closing weakness was followed by immediate downside continuation during the overnight session. In the process, price came within 3 handles of completing all intraday downside targets toward the FUT at 6745. Needless to say, during such emotional price action, you never want to get caught chasing poor location — in this case, the final downside target at 6745. Price built a brief distribution above 6745 before ripping back higher. Note the confluence of the VIX testing its resistance level at 20.06 (HOD: 20.02) and buyers stepping in on the pullback that unfolded during the European session (see Figure 2). When that confluence aligns with supportive order flow activity, it often presents a potential trade opportunity.
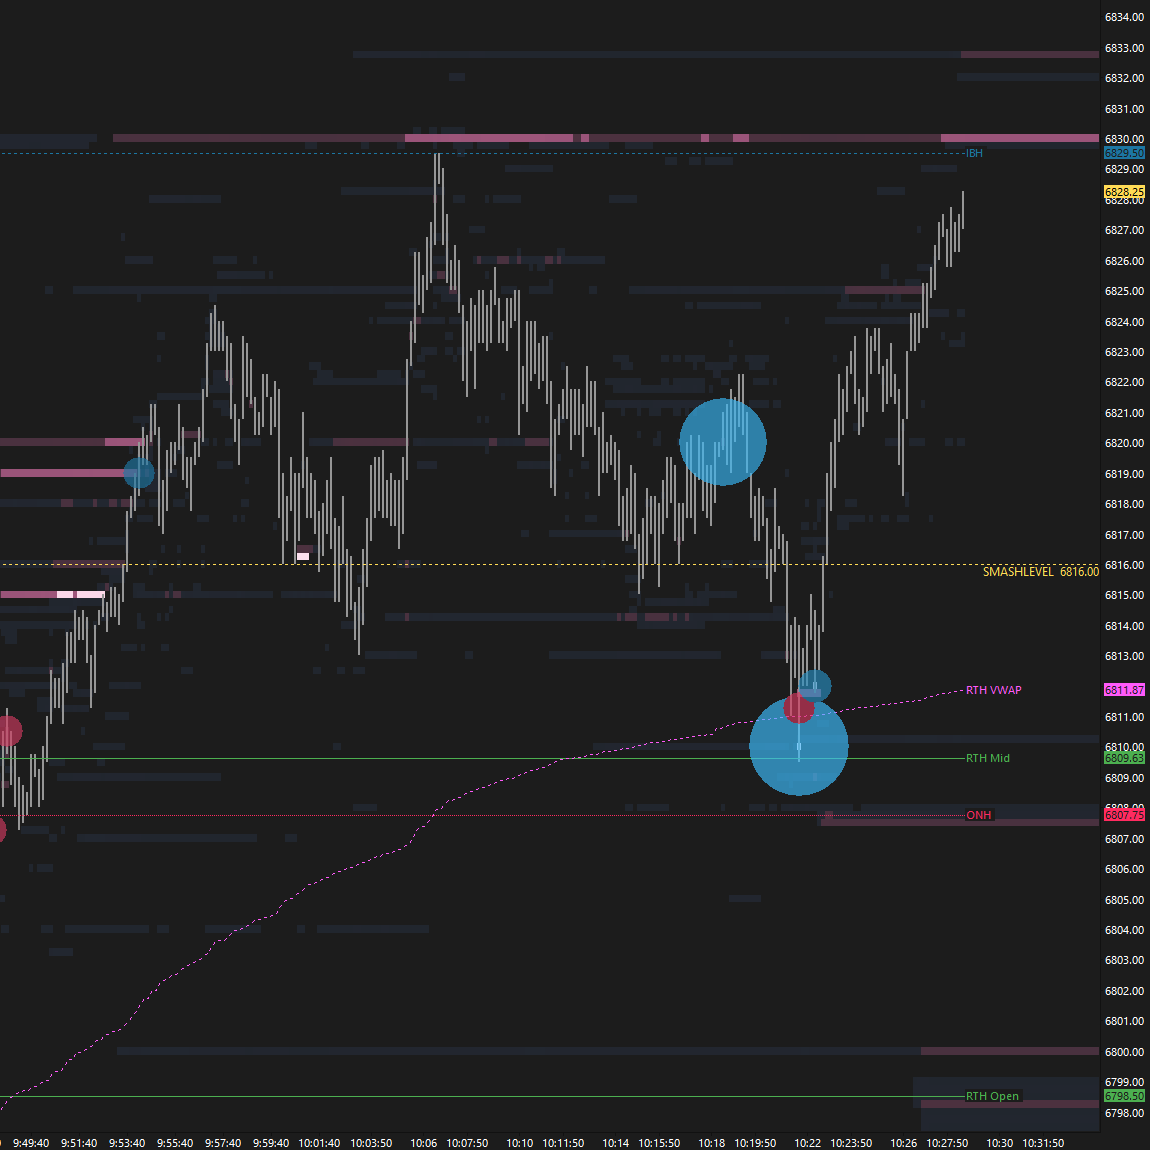
The RTH session opened within Tuesday’s range, looked below it, and failed — triggering further short-covering. Notably, the market once again failed to fill the gap at 6785.75, highlighting the continued lack of stronger sellers, despite them remaining in short-term control. The Smashlevel at 6816 was quickly reclaimed during the initial balance, and we saw some notable order flow activity around this level (see Figure 1).
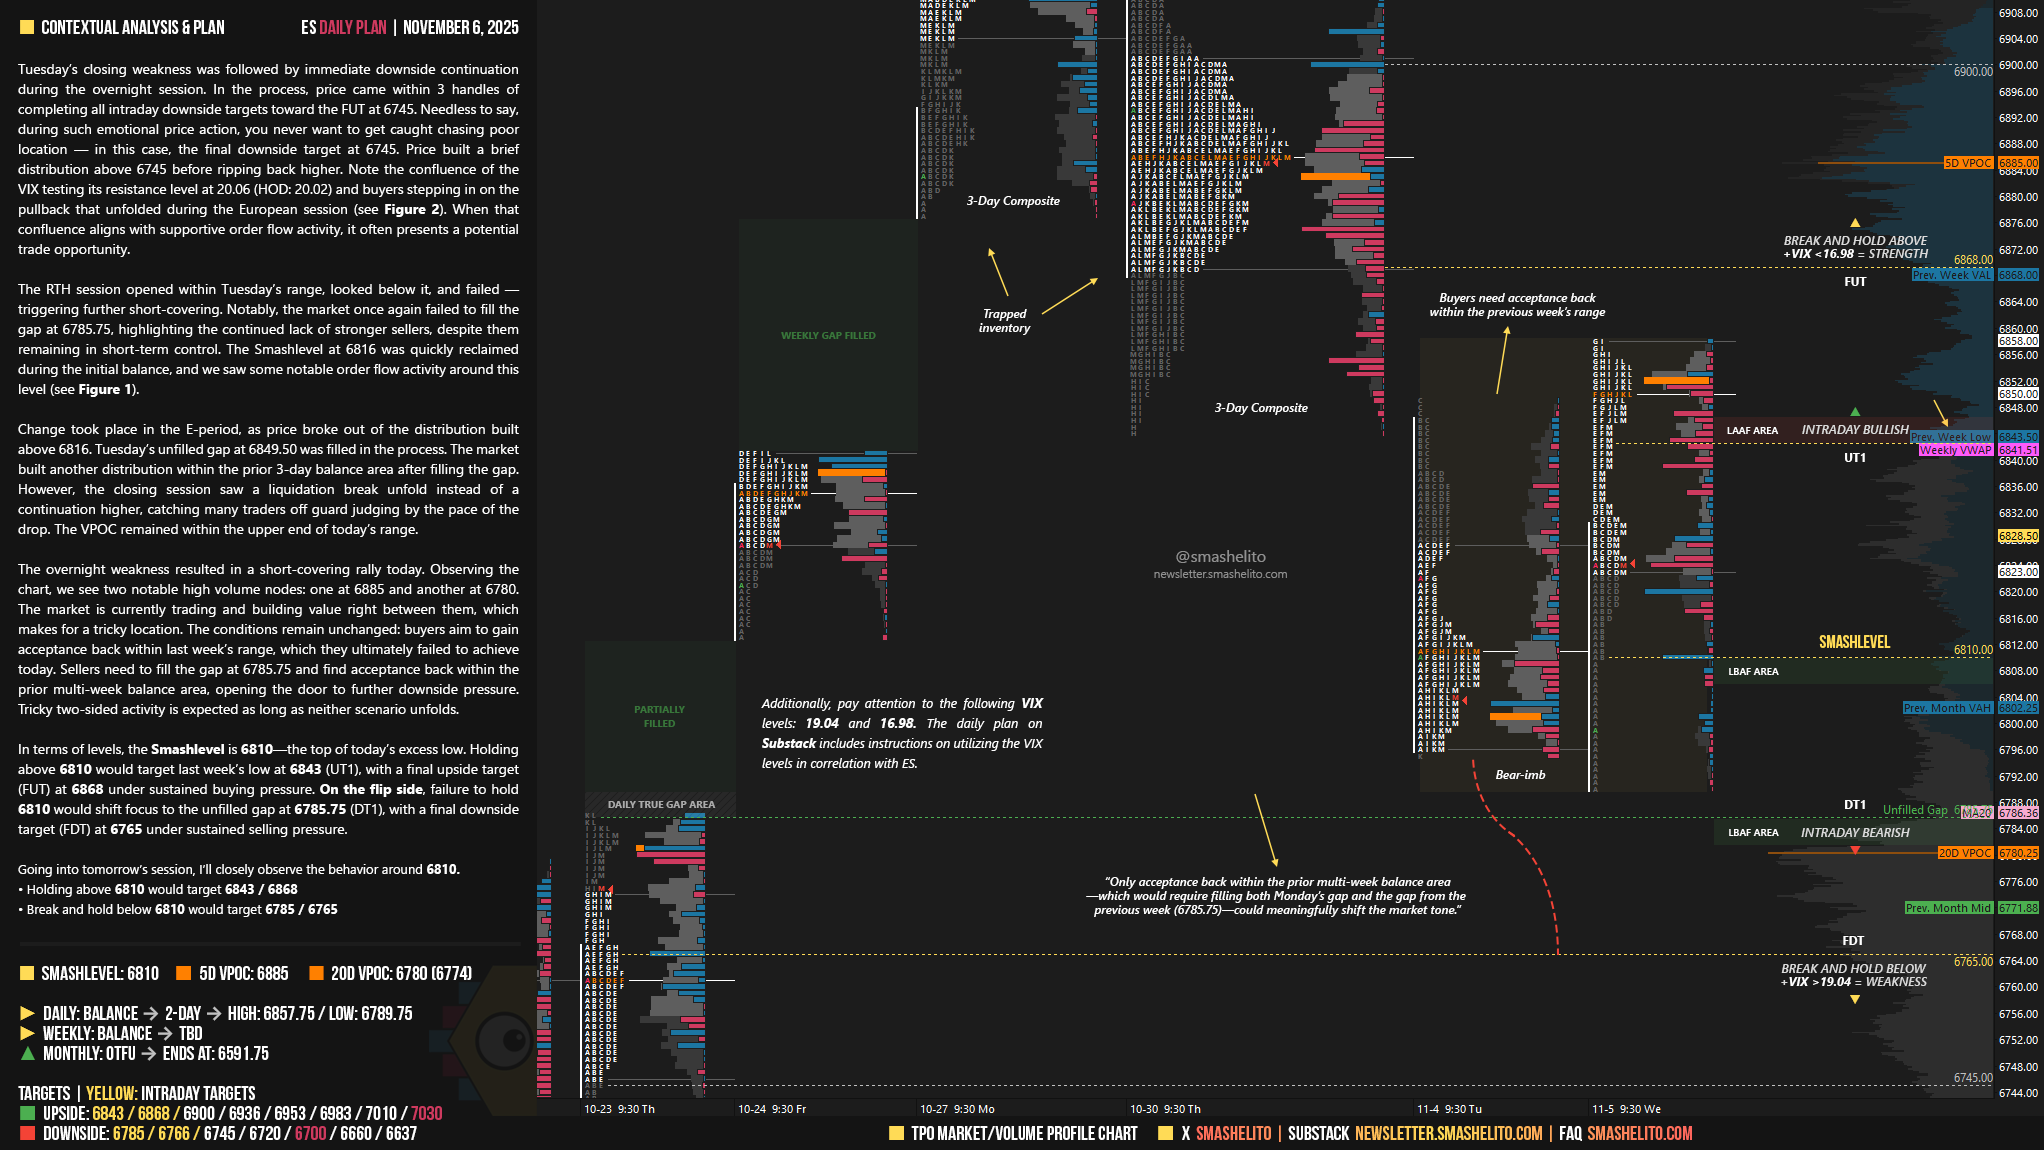
Change took place in the E-period, as price broke out of the distribution built above 6816. Tuesday’s unfilled gap at 6849.50 was filled in the process. The market built another distribution within the prior 3-day balance area after filling the gap. However, the closing session saw a liquidation break unfold instead of a continuation higher, catching many traders off guard judging by the pace of the drop. The VPOC remained within the upper end of today’s range.
ICYMI
The overnight weakness resulted in a short-covering rally today. Observing the chart, we see two notable high volume nodes: one at 6885 and another at 6780. The market is currently trading and building value right between them, which makes for a tricky location.
The conditions remain unchanged: buyers aim to gain acceptance back within last week’s range, which they ultimately failed to achieve today. Sellers need to fill the gap at 6785.75 and find acceptance back within the prior multi-week balance area, opening the door to further downside pressure. Tricky two-sided activity is expected as long as neither scenario unfolds.
In terms of levels, the Smashlevel is 6810—the top of today’s excess low. Holding above 6810 would target last week’s low at 6843 (UT1), with a final upside target (FUT) at 6868 under sustained buying pressure.
On the flip side, failure to hold 6810 would shift focus to the unfilled gap at 6785.75 (DT1), with a final downside target (FDT) at 6765 under sustained selling pressure.
Levels of Interest
Going into tomorrow’s session, I’ll closely observe the behavior around 6810.
Holding above 6810 would target 6843 / 6868
Break and hold below 6810 would target 6785 / 6765
Additionally, pay attention to the following VIX levels: 19.04 and 16.98. These levels can provide confirmation of strength or weakness.
Break and hold above 6868 with VIX below 16.98 would confirm strength.
Break and hold below 6765 with VIX above 19.04 would confirm weakness.
Overall, it's important to exercise caution when trading outside of the highlighted yellow levels. A non-cooperative VIX may suggest possible reversals i.e trade setups.
Smash, good evening, thank you for providing this great post daily. I wanted to ask you, when the Weekly says "TBD," does it mean "To Be Determined"? I ask because it makes a lot of sense not to have more MGI to clarify this, for the same reason you mention in the post about the two distributions where we find ourselves in the middle.
Thanks Smash!