
ES Daily Plan | May 22, 2026
Market Context & Key Levels for the Day Ahead

— For new subscribers
The yellow levels highlighted at the bottom left of the chart are the primary intraday levels I focus on. To avoid impulsive decisions at poor trade locations, I follow a simple but effective rule: exercise caution when initiating trades outside of these yellow levels.
This means I’m cautious about chasing longs above the Final Upside Target (FUT) and shorts below the Final Downside Target (FDT). It’s important to understand that not chasing does not imply initiating a trade in the opposite direction, discipline over impulse.
Be sure to review the Weekly Plan for a broader perspective, key levels, and market expectations for the week ahead.

Contextual Analysis & Plan
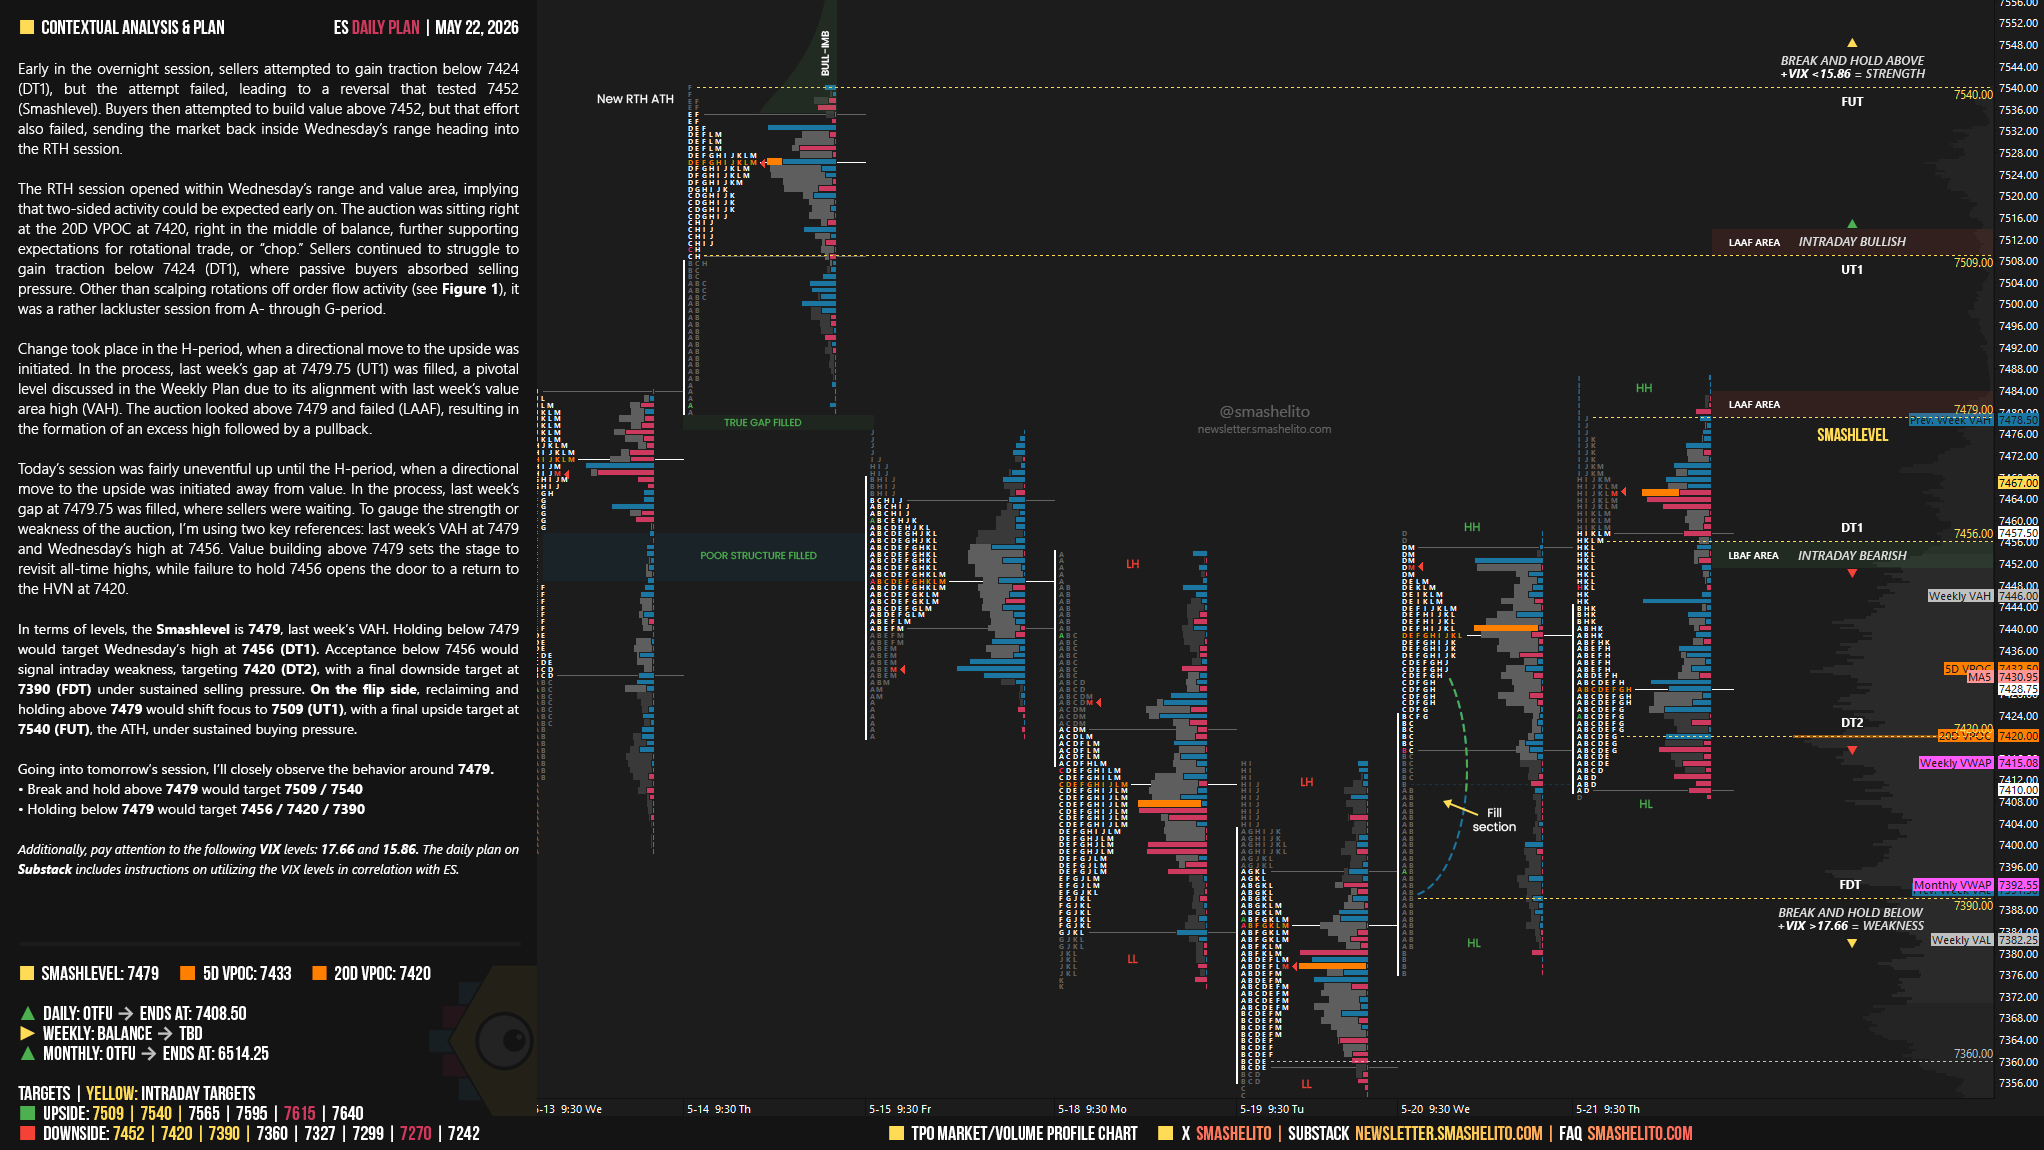
Early in the overnight session, sellers attempted to gain traction below 7424 (DT1), but the attempt failed, leading to a reversal that tested 7452 (Smashlevel). Buyers then attempted to build value above 7452, but that effort also failed, sending the market back inside Wednesday’s range heading into the RTH session.
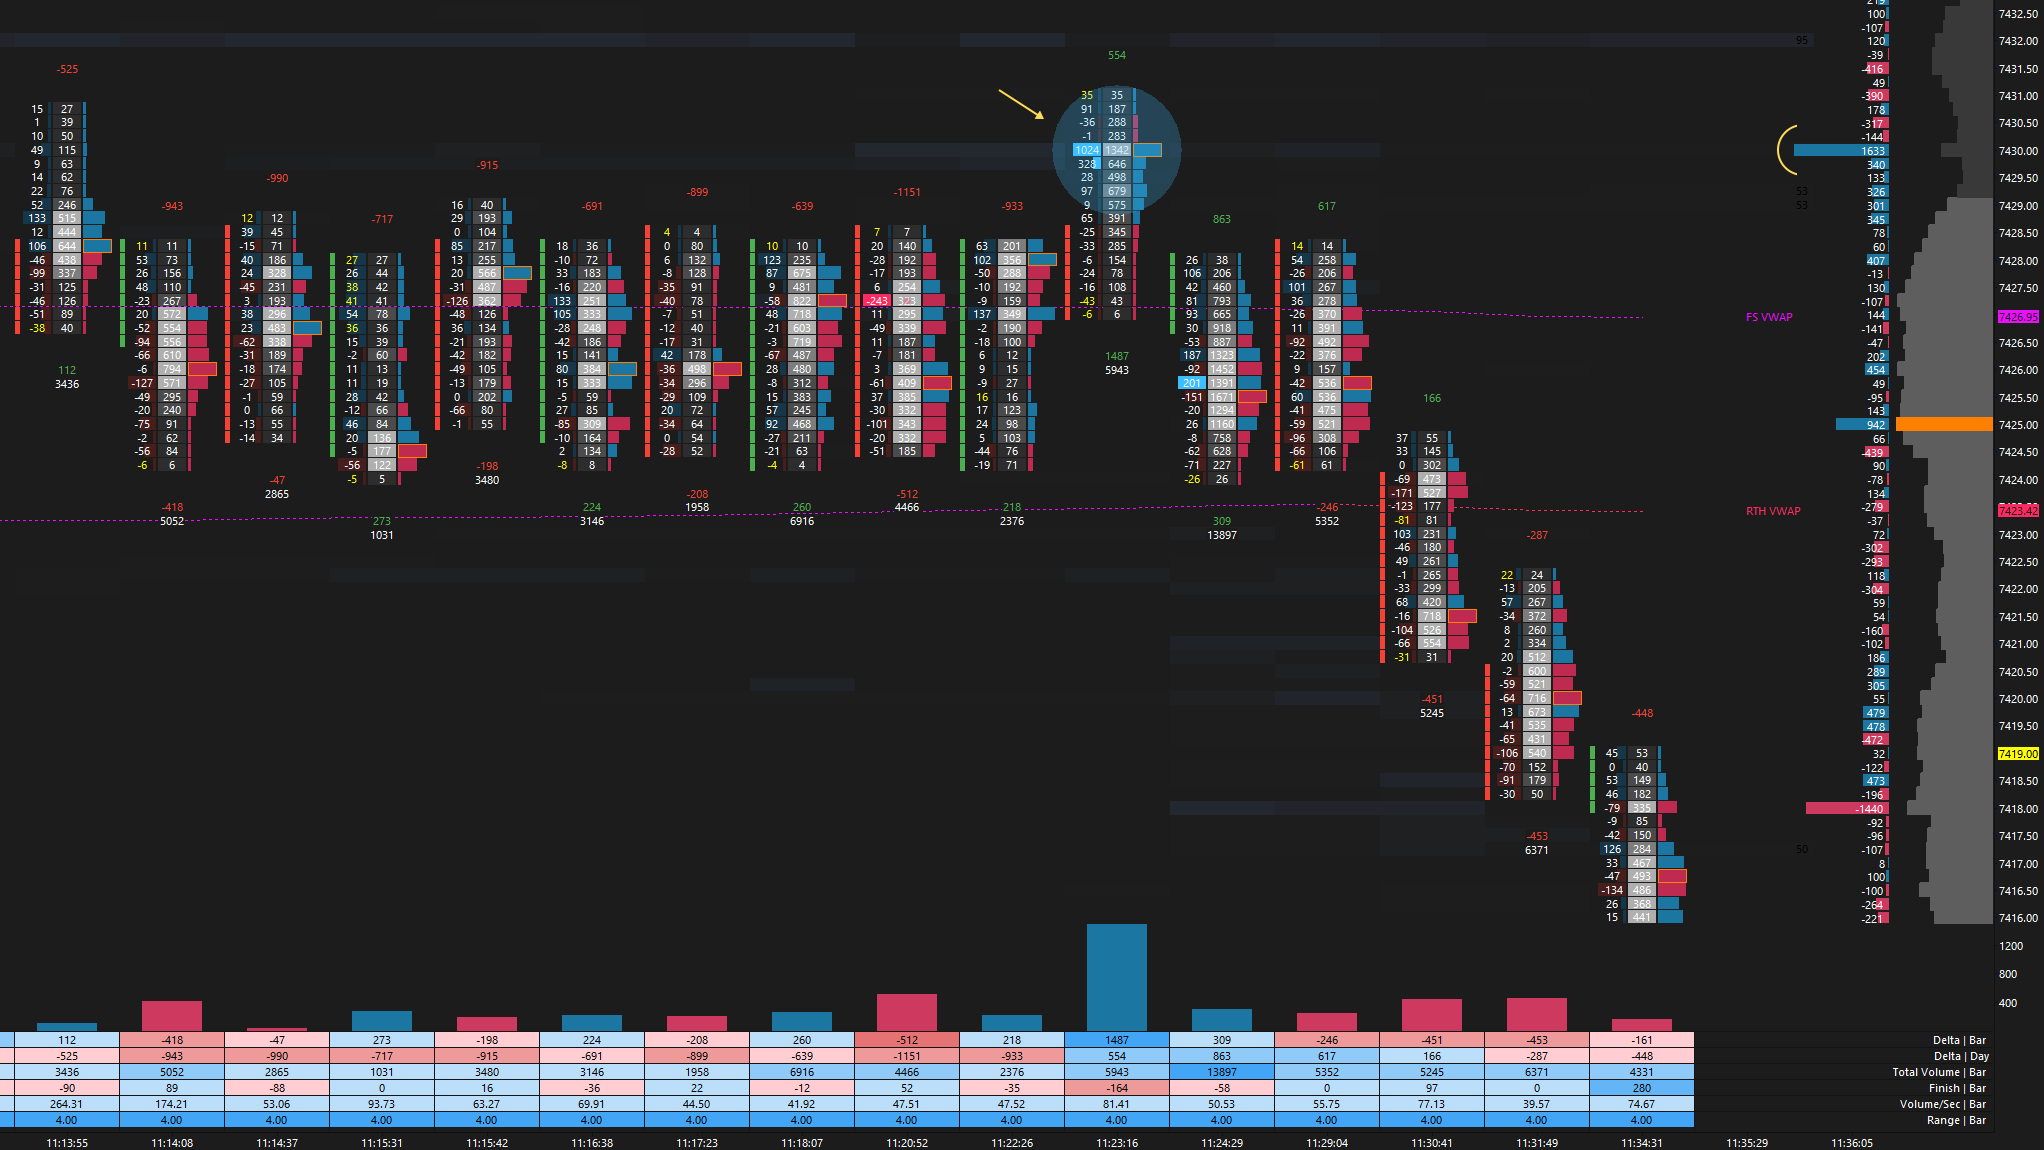
The RTH session opened within Wednesday’s range and value area, implying that two-sided activity could be expected early on. The auction was sitting right at the 20D VPOC at 7420, right in the middle of balance, further supporting expectations for rotational trade, or “chop.” Sellers continued to struggle to gain traction below 7424 (DT1), where passive buyers absorbed selling pressure. Other than scalping rotations off order flow activity (see Figure 1), it was a rather lackluster session from A- through G-period.
Change took place in the H-period, when a directional move to the upside was initiated. In the process, last week’s gap at 7479.75 (UT1) was filled, a pivotal level discussed in the Weekly Plan due to its alignment with last week’s value area high (VAH). The auction looked above 7479 and failed (LAAF), resulting in the formation of an excess high followed by a pullback.
Smashlevels Recap
Today’s session was fairly uneventful up until the H-period, when a directional move to the upside was initiated away from value. In the process, last week’s gap at 7479.75 was filled, where sellers were waiting.
To gauge the strength or weakness of the auction, I’m using two key references: last week’s VAH at 7479 and Wednesday’s high at 7456.
Value building above 7479 sets the stage to revisit all-time highs, while failure to hold 7456 opens the door to a return to the HVN at 7420.
In terms of levels, the Smashlevel is 7479, last week’s VAH. Holding below 7479 would target Wednesday’s high at 7456 (DT1). Acceptance below 7456 would signal intraday weakness, targeting 7420 (DT2), with a final downside target at 7390 (FDT) under sustained selling pressure.
On the flip side, reclaiming and holding above 7479 would shift focus to 7509 (UT1), with a final upside target at 7540 (FUT), the ATH, under sustained buying pressure.
Visual Representation
Levels of Interest
Going into tomorrow’s session, I’ll closely observe the behavior around 7479.
Break and hold above 7479 would target 7509 / 7540
Holding below 7479 would target 7456 / 7420 / 7390
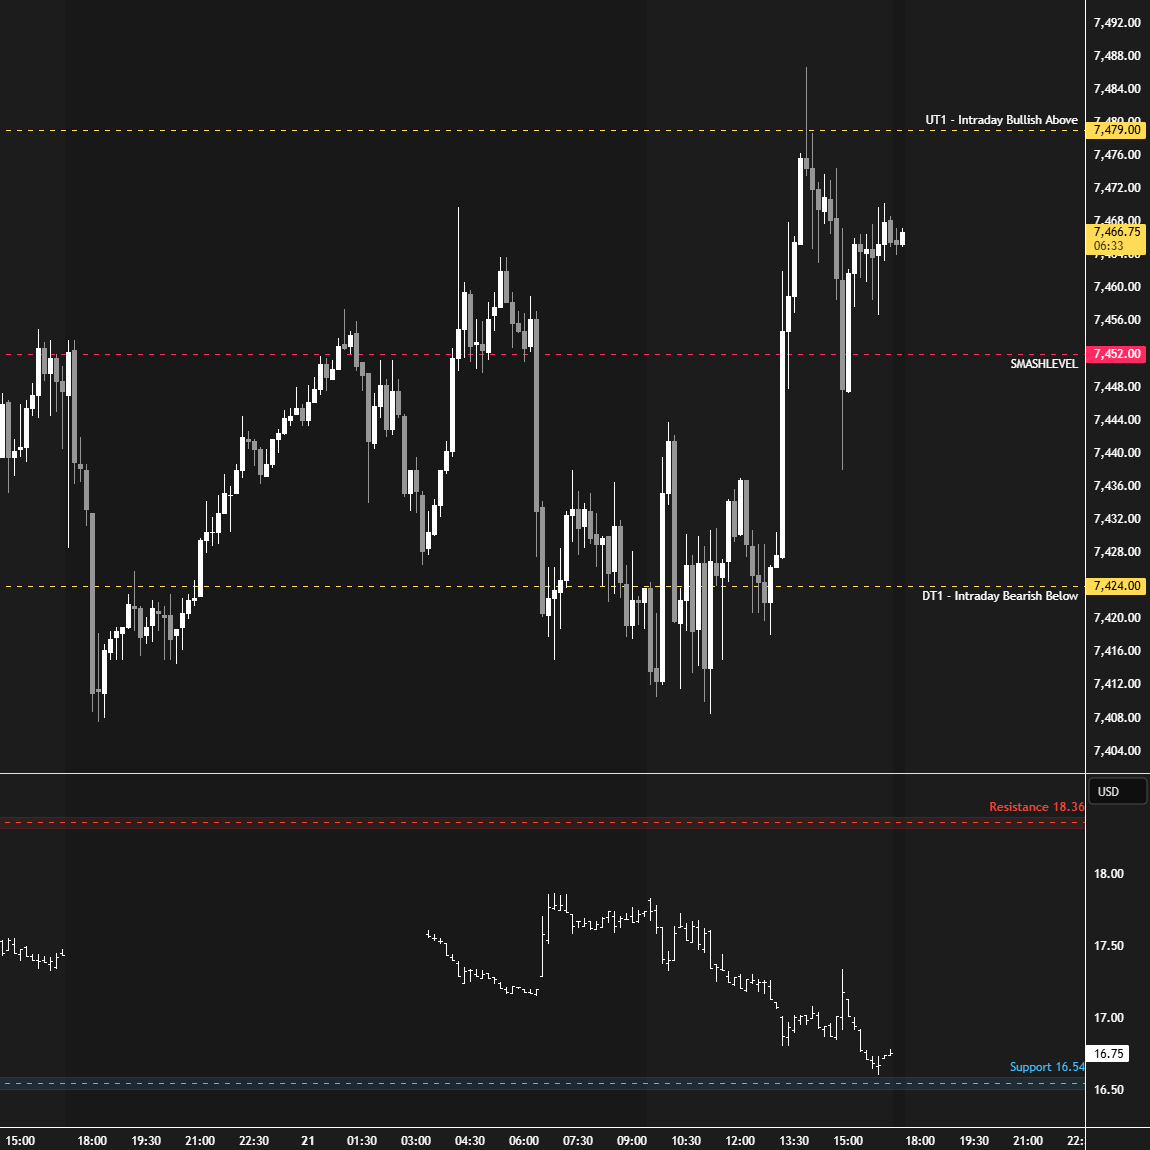
Additionally, pay attention to the following VIX levels: 17.66 and 15.86. These levels can provide confirmation of strength or weakness.
Break and hold above 7540 with VIX below 15.86 would confirm strength.
Break and hold below 7390 with VIX above 17.66 would confirm weakness.
Overall, it's important to exercise caution when trading outside of the highlighted yellow levels. A non-cooperative VIX may suggest possible reversals i.e trade setups.
Thank you for sharing your great work
Thanks Smash!