
ES Weekly Plan | May 18-22, 2026
Recap, Market Context & Key Levels for the Week Ahead

Welcome to this week’s plan. Inside, you’ll find a quick review of last week’s price action, key economic events, market structure, context for the week ahead, and the levels I’ll be focusing on. Let’s get prepared.
Contents
Last Week in Review
Economic & Earnings Calendar
Market Structure
Contextual Analysis & Plan
Key Levels of Interest
Last Week in Review
Last week’s plan:

Last week kicked off with Monday’s session establishing value higher, maintaining a structure of higher highs and higher lows on the daily timeframe. A key principle is that trend structure does not shift until one-time framing up ends, which is why it is generally better to wait for that confirmation before attempting to fade it. Picking tops (or bottoms) is rarely effective; it is often better to wait for the market to return to balance before attempting counter-trend trades.
On Tuesday, the daily one-time framing up ended, triggering a pullback to the high volume node at 7365, from which a V-shaped reversal unfolded. The M-period formed a spike, which was key to monitor heading into Wednesday’s session.
Sellers initially rejected the higher prices from Tuesday’s spike area on Wednesday. However, the failure to gain acceptance into Tuesday’s value area triggered a reversal. In the process, a double distribution trend day was formed, and the market once again shifted from a balanced state, which it entered after the daily one-time framing up ended on Tuesday, into imbalance.
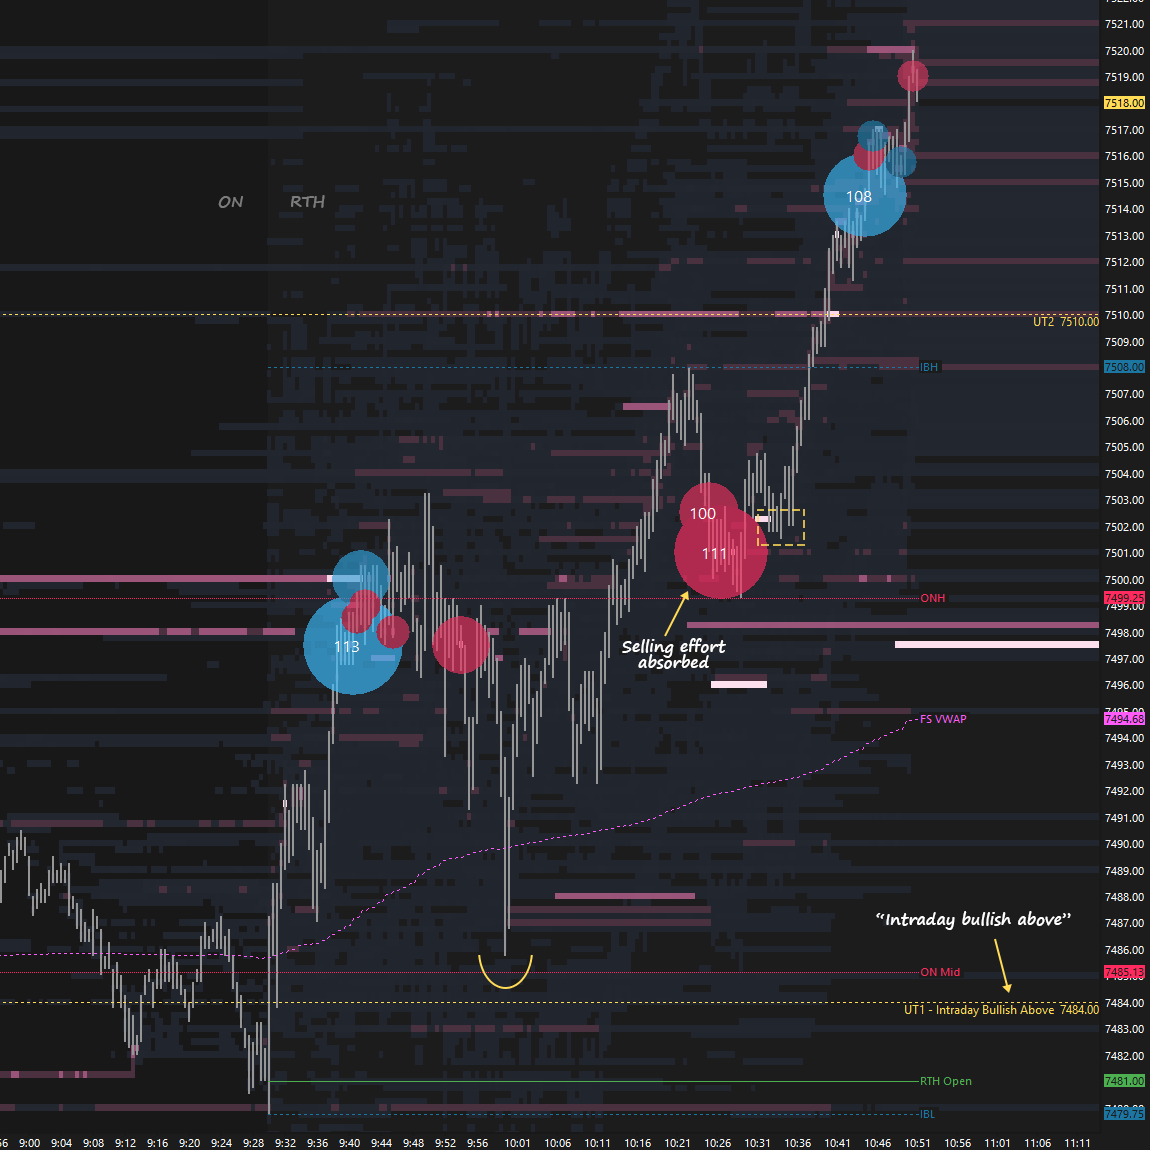
Wednesday’s breakout from balance was followed by a continuation higher on Thursday, effectively clearing all intraday upside targets toward 7540 (FUT) and tagging the weekly resistance area between 7535 and 7565. As discussed throughout the week, in trending conditions, it’s about patience and avoiding chasing. Let counter-trend moves stall or get absorbed, then join the continuation (see Figure 1).
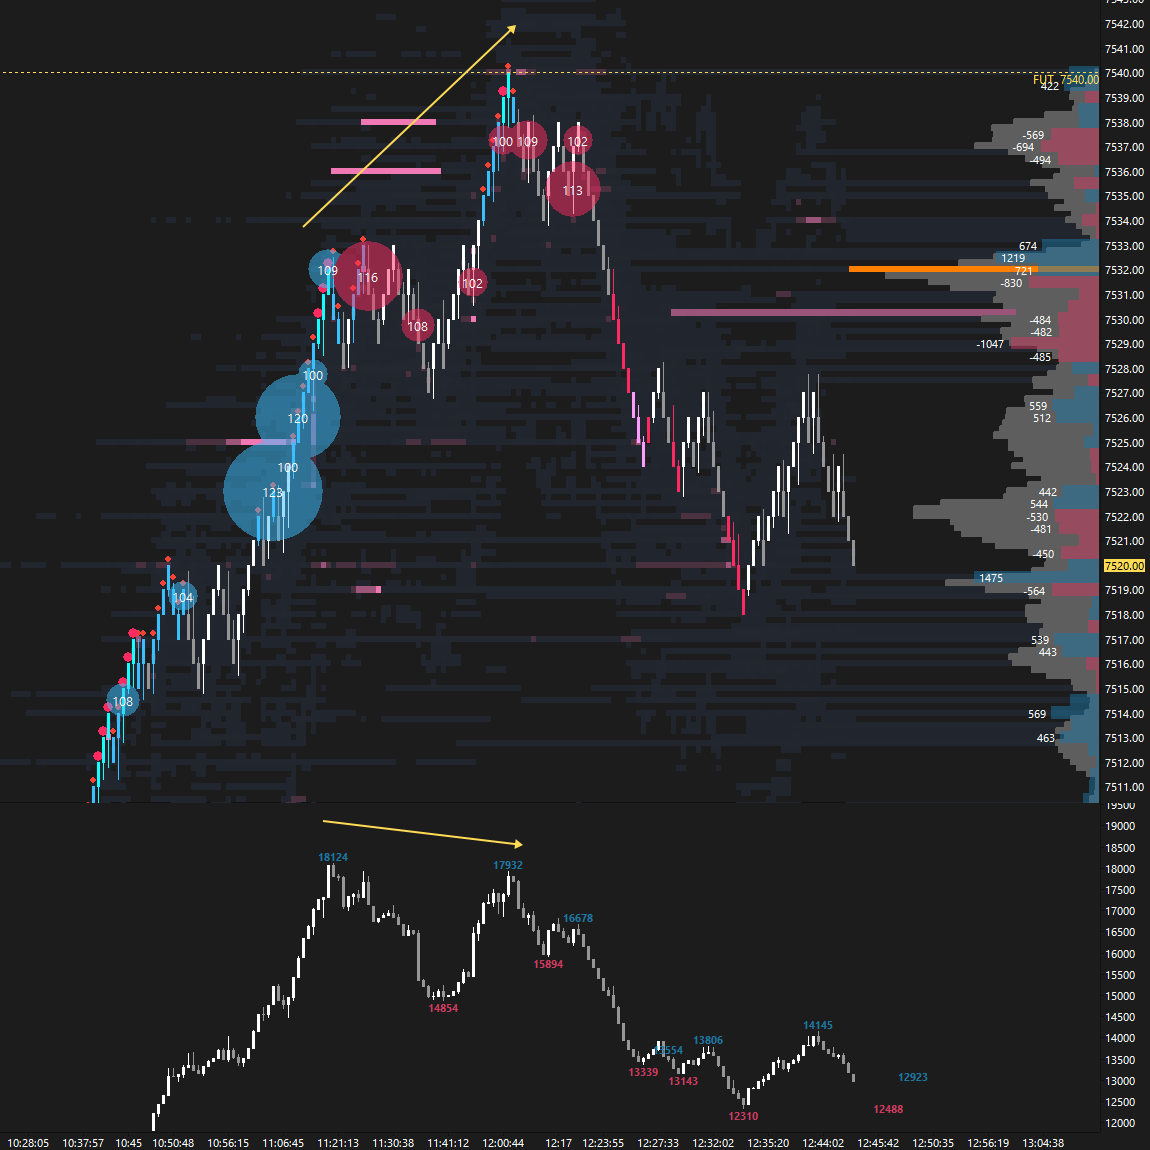
Thursday’s session offered great setups around intraday levels, including a fade of 7540 (FUT) with delta divergence (see Figure 2). The VIX failed to confirm strength by holding above support, making longs around 7540 unfavorable to chase. Note the aggressive sellers stepping in near 7540.
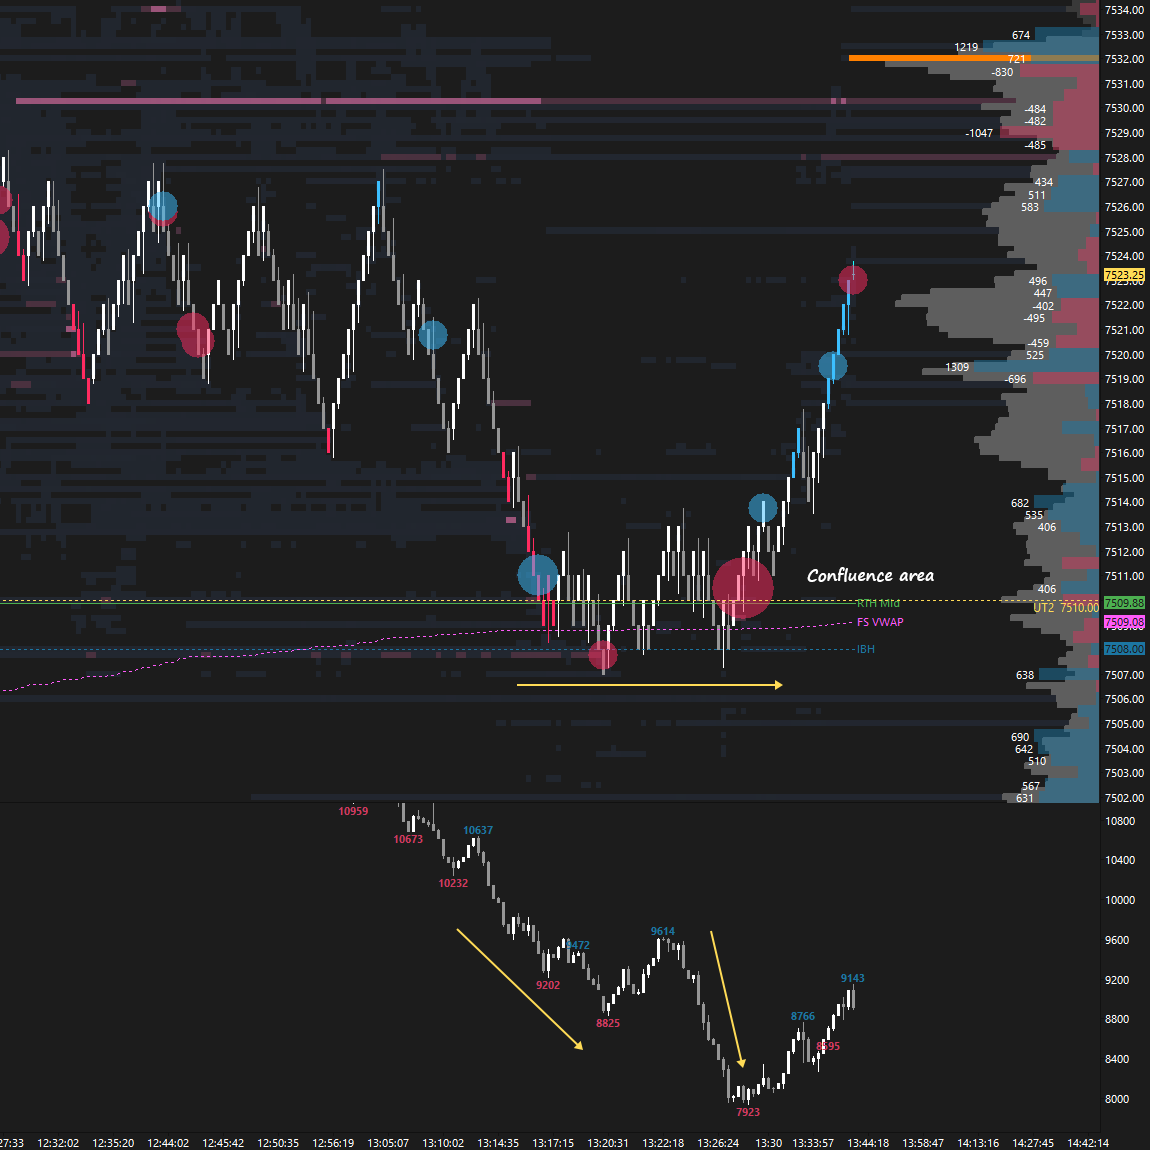
This pullback led to a test of another level of interest at 7510 (UT1), where we had FS VWAP, IBH, and halfback as confluence. Aggressive sellers didn’t have enough size to push through the passive limit orders, resulting in a squeeze (see Figure 3).
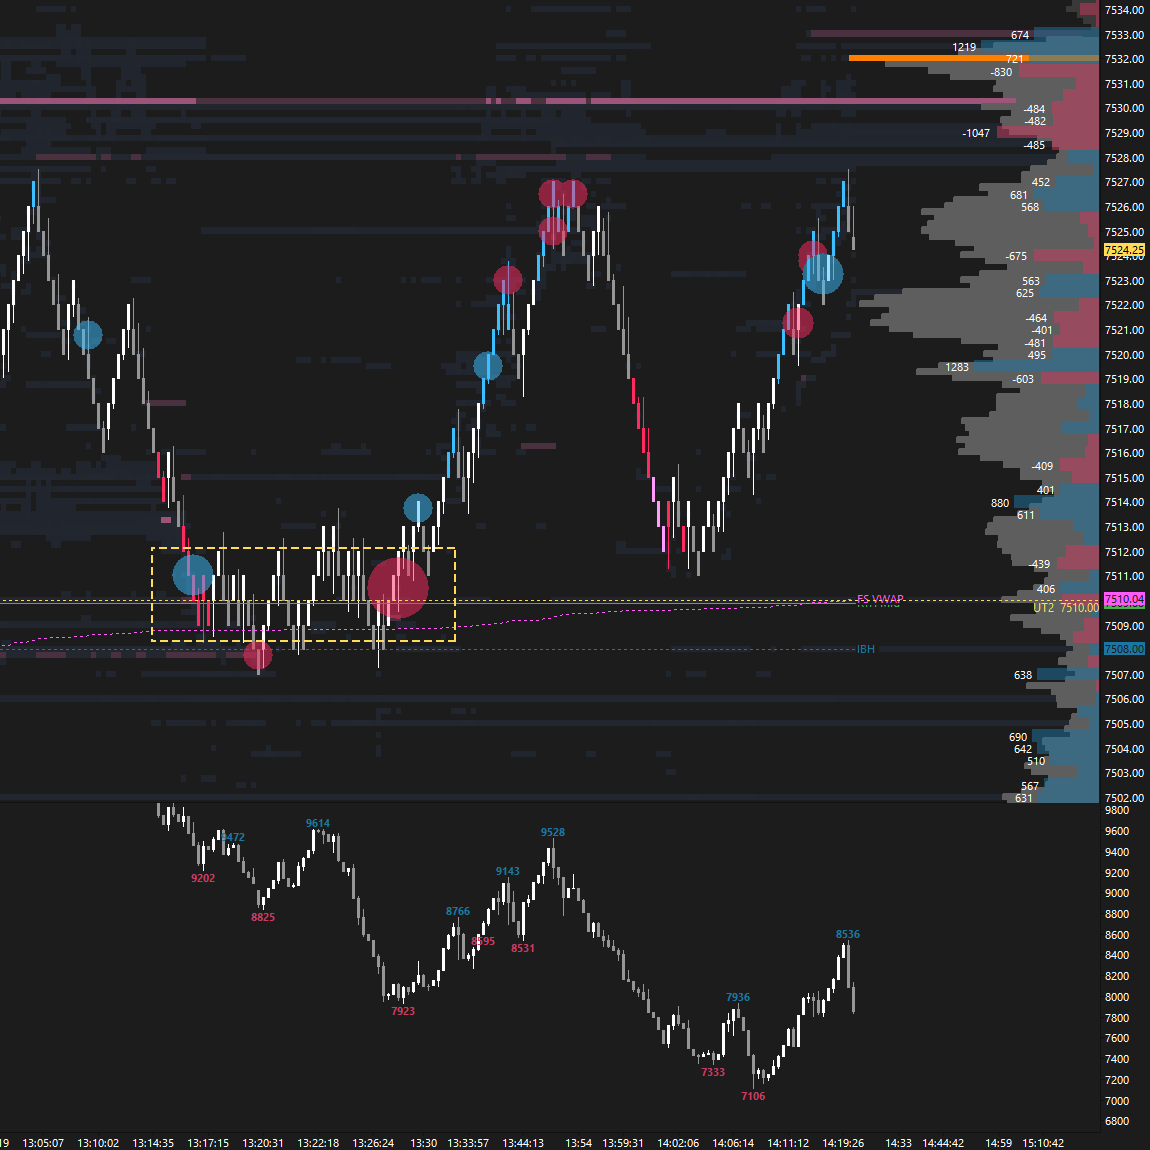
Notably, this area of trapped sellers was then revisited, providing another solid bounce (see Figure 4). Note the selling exhaustion coming into the trap area.
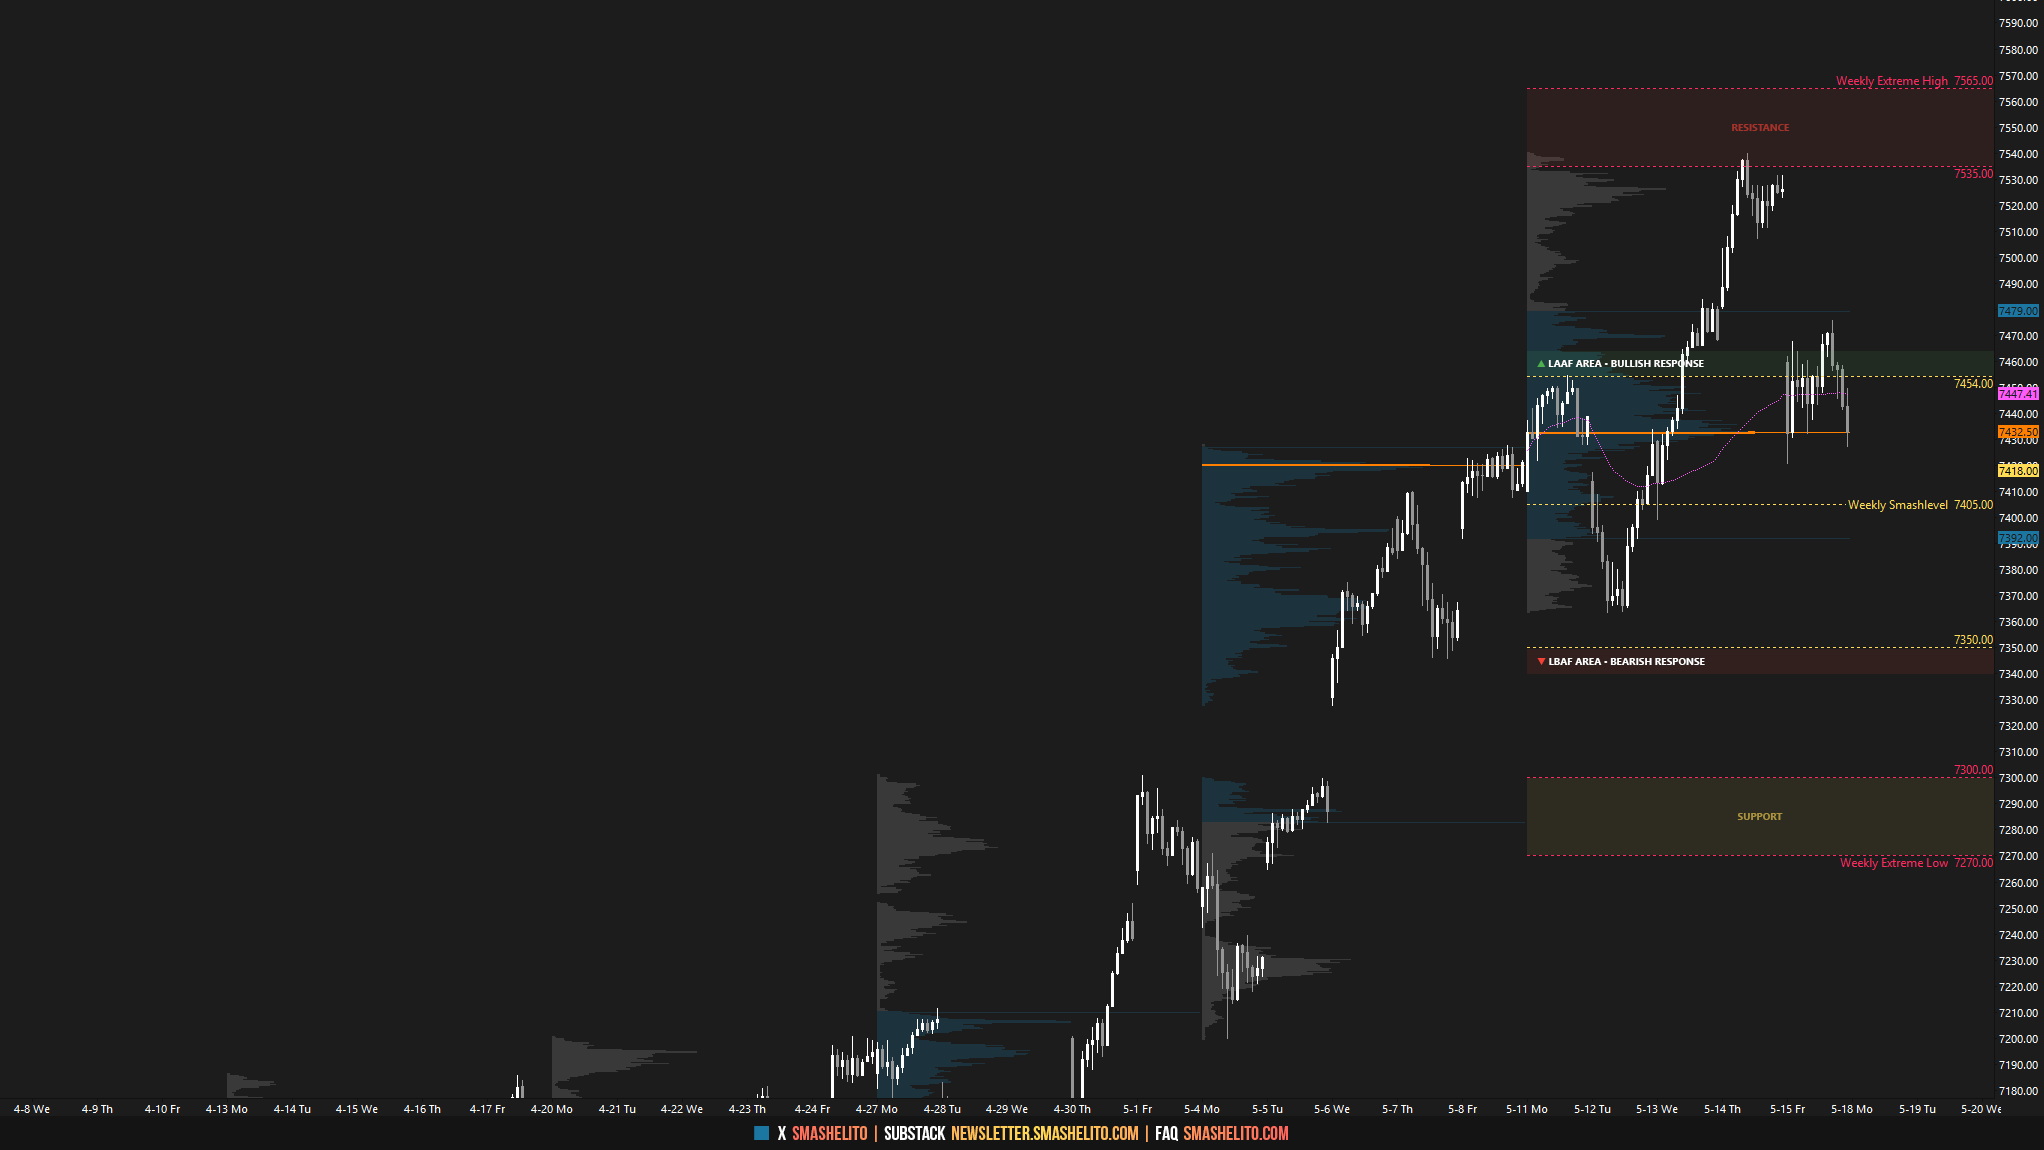
After finding sellers within the weekly resistance area between 7535 and 7565, Friday’s session opened with a true gap down, which remains unfilled at 7479.75. The session closed back within Wednesday’s lower distribution, effectively negating Wednesday’s trend day.
The key question now is whether sellers can follow through and end the weekly one-time framing up, introducing further weakness, or if buyers will once again step in and buy the dip. Notably, Friday’s gap at 7479.75 aligns with last week’s value area high (VAH), a key area for sellers to defend.
Last Week’s Levels in Review
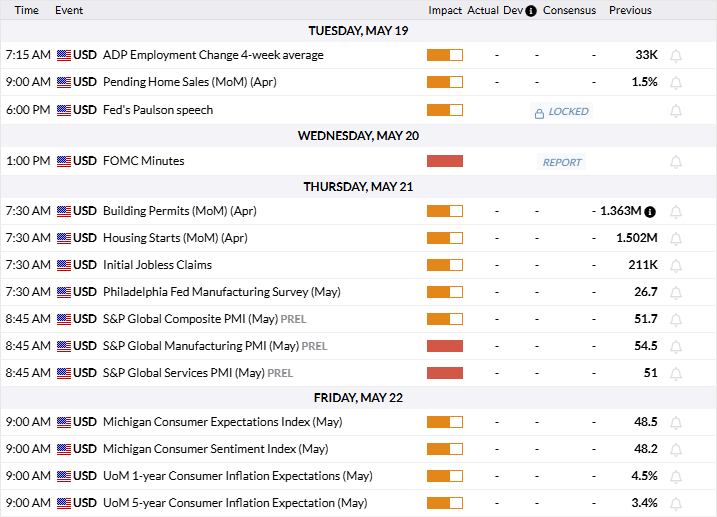
Economic & Earnings Calendar
Central Standard Time
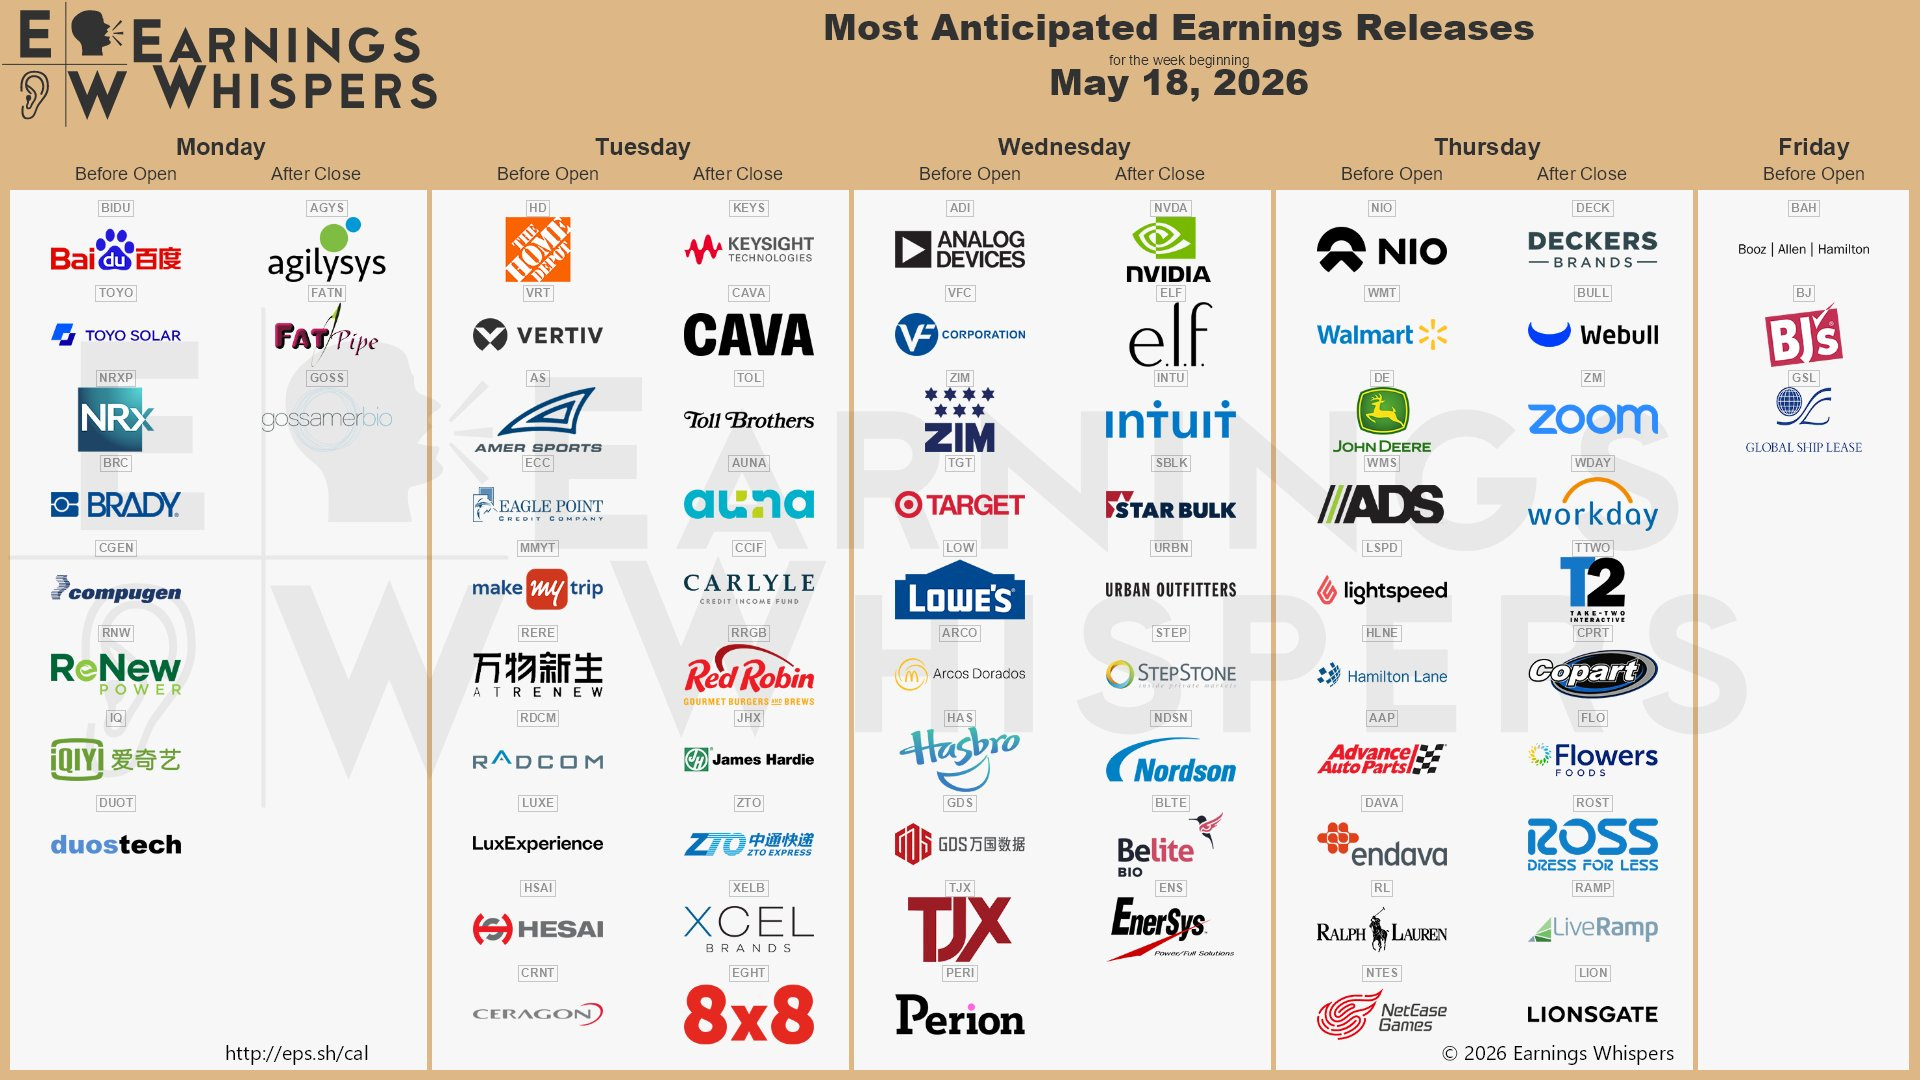
Earnings Whispers
Market Structure
🟨 Daily: BALANCE → 3-Day → High: 7540 | Low: 7399
🟩 Weekly: OTFU → Ends at: 7363.25
🟩 Monthly: OTFU → Ends at: 6514.25
Balance: A market condition where price consolidates within a defined range, reflecting indecision as the market awaits more market-generated information. We apply balance guidelines, favoring fade trades at range extremes (highs/lows) and preparing for breakout setups if balance resolves.
One-Time Framing Up (OTFU): A market condition where each subsequent bar forms a higher low, signaling a strong upward trend.
One-Time Framing Down (OTFD): A market condition where each subsequent bar forms a lower high, signaling a strong downward trend.
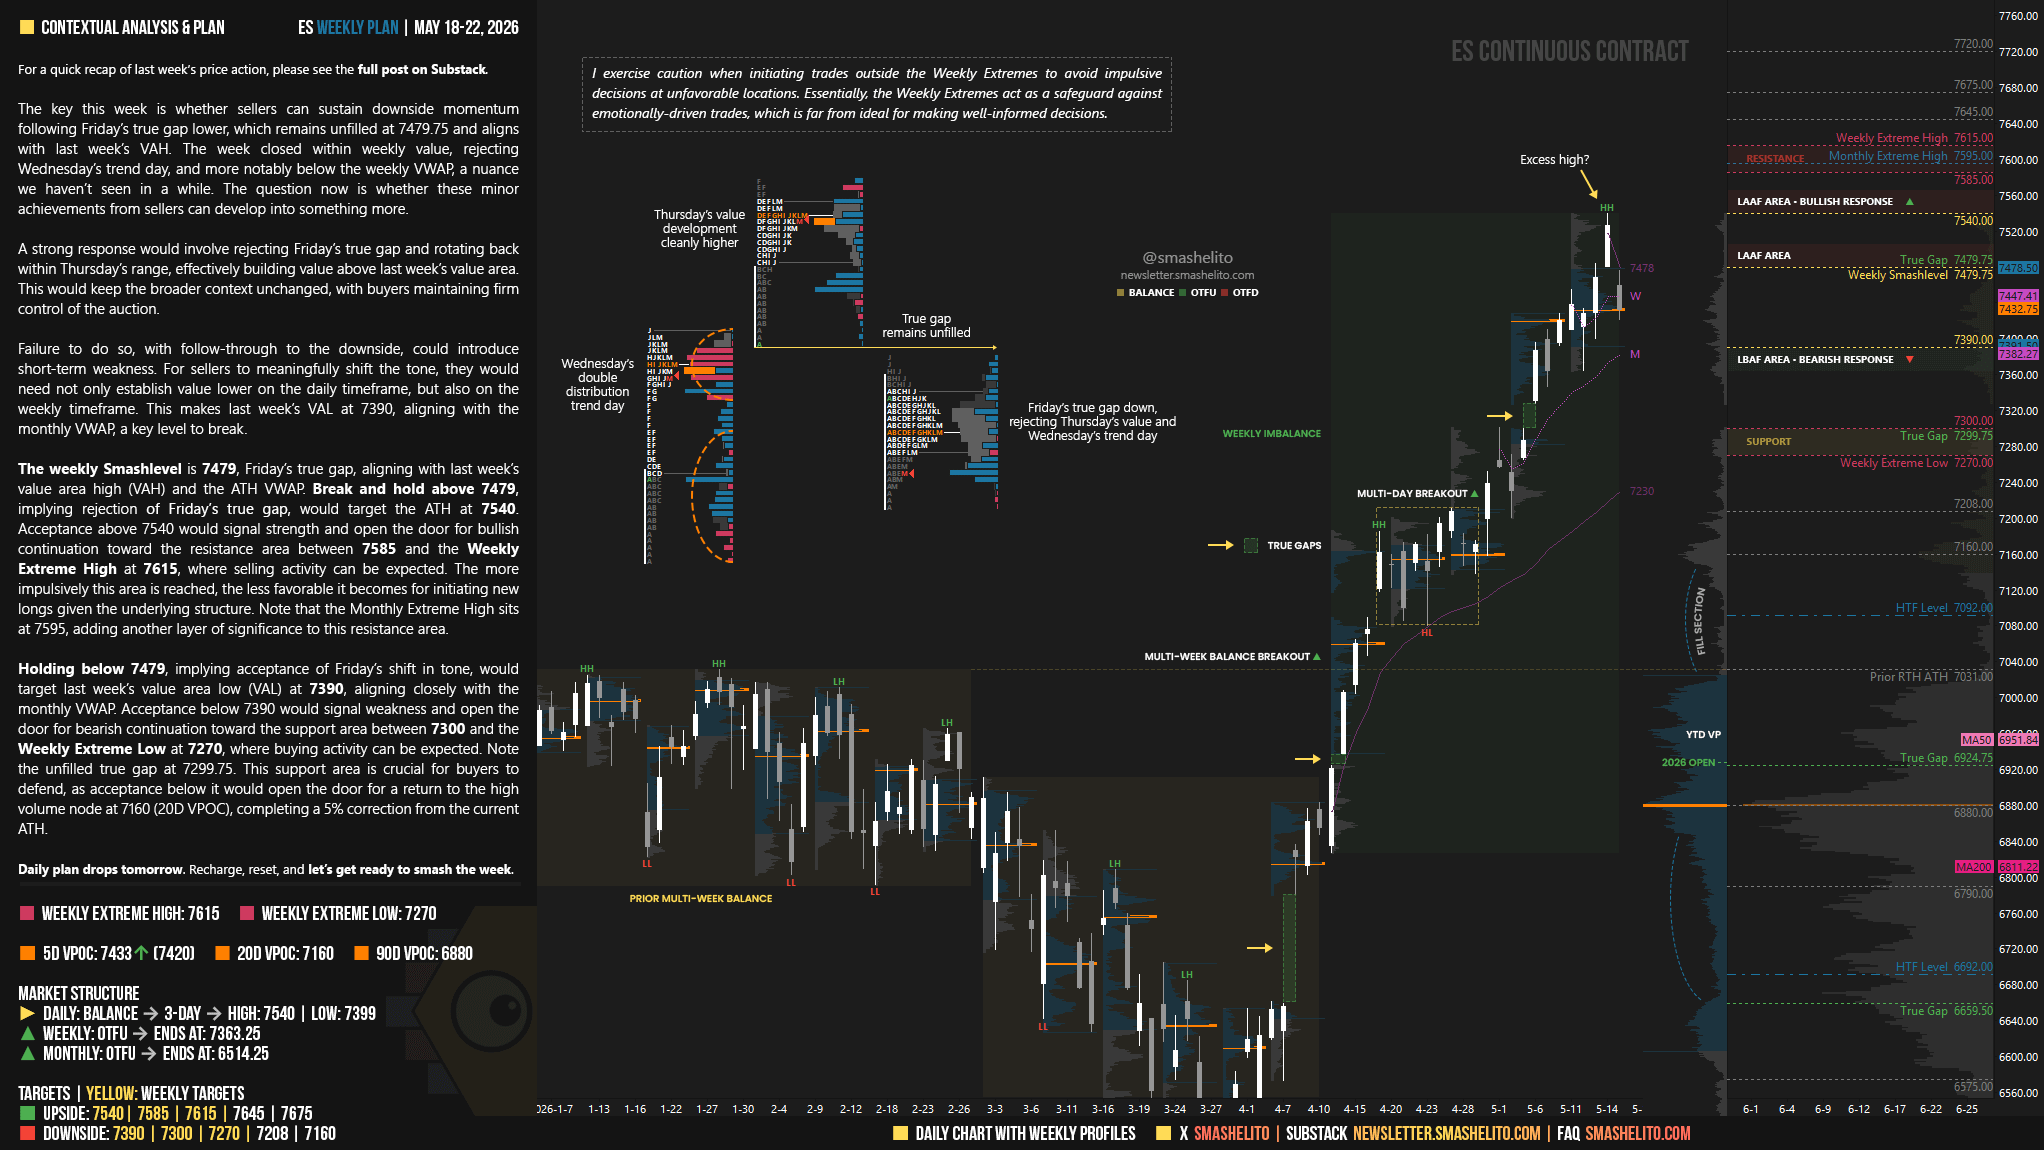
Contextual Analysis & Plan
The key this week is whether sellers can sustain downside momentum following Friday’s true gap lower, which remains unfilled at 7479.75 and aligns with last week’s VAH. The week closed within weekly value, rejecting Wednesday’s trend day, and more notably below the weekly VWAP, a nuance we haven’t seen in a while. The question now is whether these minor achievements from sellers can develop into something more.
A strong response would involve rejecting Friday’s true gap and rotating back within Thursday’s range, effectively building value above last week’s value area. This would keep the broader context unchanged, with buyers maintaining firm control of the auction.
Failure to do so, with follow-through to the downside, could introduce short-term weakness. For sellers to meaningfully shift the tone, they would need not only establish value lower on the daily timeframe, but also on the weekly timeframe. This makes last week’s VAL at 7390, aligning with the monthly VWAP, a key level to break.
The weekly Smashlevel is 7479, Friday’s true gap, aligning with last week’s value area high (VAH) and the ATH VWAP. Break and hold above 7479, implying rejection of Friday’s true gap, would target the ATH at 7540. Acceptance above 7540 would signal strength and open the door for bullish continuation toward the resistance area between 7585 and the Weekly Extreme High at 7615, where selling activity can be expected. The more impulsively this area is reached, the less favorable it becomes for initiating new longs given the underlying structure. Note that the Monthly Extreme High sits at 7595, adding another layer of significance to this resistance area.
Holding below 7479, implying acceptance of Friday’s shift in tone, would target last week’s value area low (VAL) at 7390, aligning closely with the monthly VWAP. Acceptance below 7390 would signal weakness and open the door for bearish continuation toward the support area between 7300 and the Weekly Extreme Low at 7270, where buying activity can be expected. Note the unfilled true gap at 7299.75. This support area is crucial for buyers to defend, as acceptance below it would open the door for a return to the high volume node at 7160 (20D VPOC), completing a 5% correction from the current ATH.
Visual Representation
Key Levels of Interest
In the upcoming week, I will closely observe the behavior around 7479.
Break and hold above 7479 would target 7540 / 7585 / 7615* / 7645 / 7675
Holding below 7479 would target 7390 / 7300 / 7270* / 7208 / 7160
*Weekly Extremes (defined by proprietary models). I exercise caution when initiating trades outside the Weekly Extremes to avoid impulsive decisions at unfavorable locations. Essentially, the Weekly Extremes act as a safeguard against emotionally-driven trades, which is far from ideal for making well-informed decisions.
Daily plan drops tomorrow. Recharge, reset, and let’s get ready to smash the week.
I'm so grateful to have stumbled upon your content amidst all the noise on social media.
I'm deeply grateful for everything you've helped me understand about the market from an auction and value creation perspective.
Thank you so much for everything you do. Many blessings and much success to everyone behind this great Smash project.
Thank you Smash!