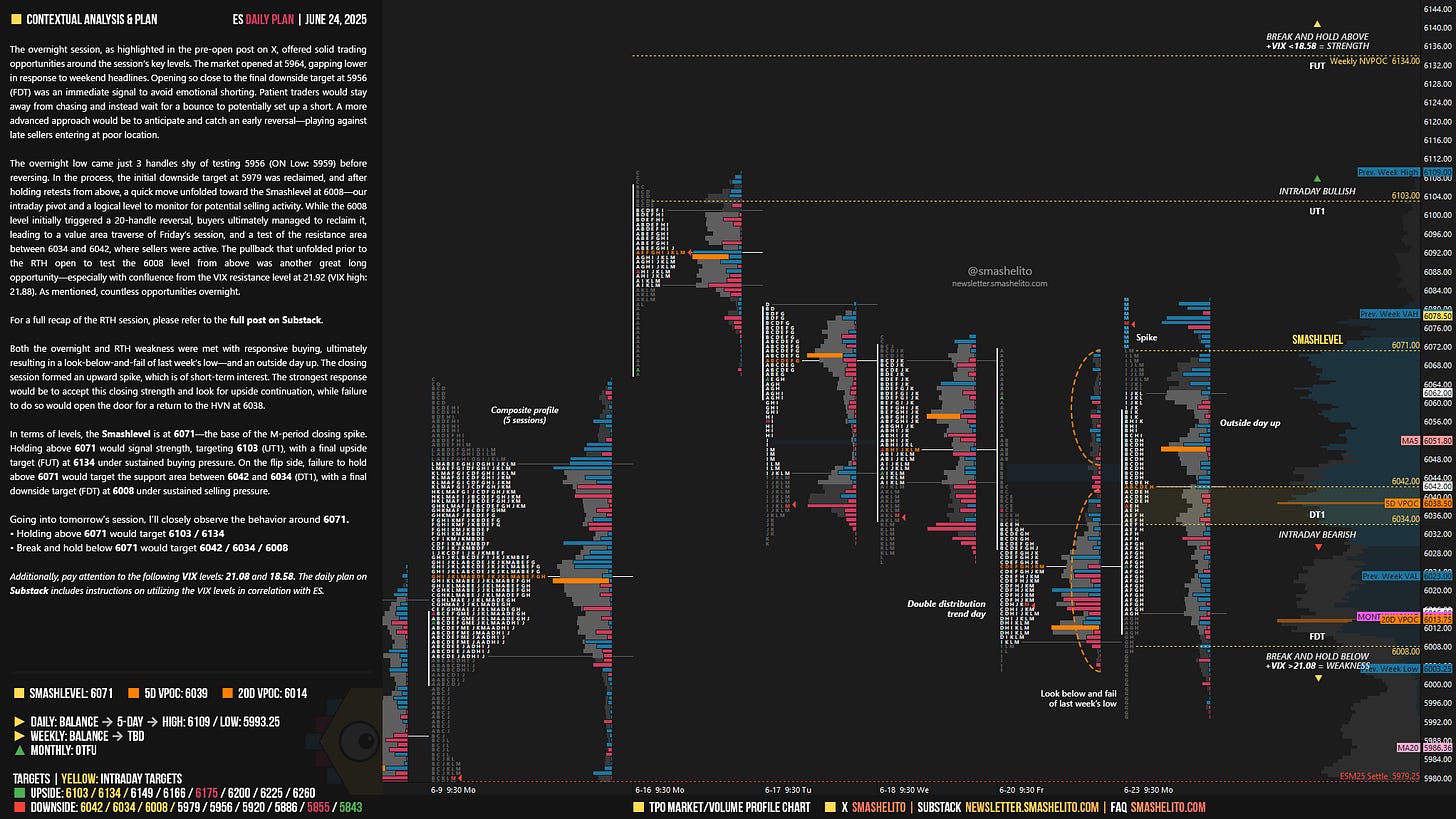
ES Daily Plan | June 24, 2025
Recap, Market Context & Key Levels for the Day Ahead
— For new subscribers
The yellow levels highlighted at the bottom left of the chart are the primary intraday levels I focus on. To avoid impulsive decisions at poor trade locations, I follow a simple but effective rule: exercise caution when initiating trades outside of these yellow levels.
This means I’m cautious about chasing longs above the Final Upside Target (FUT) and shorts below the Final Downside Target (FDT). It’s important to understand that not chasing does not imply initiating a trade in the opposite direction — discipline over impulse.
Be sure to review the ES Weekly Plan | June 23-27, 2025 for a broader perspective, key levels, and market expectations for the week ahead.
Contextual Analysis & Plan
The overnight session, as highlighted in the pre-open post on X (link), offered solid trading opportunities around the session’s key levels. The market opened at 5964, gapping lower in response to weekend headlines. Opening so close to the final downside target at 5956 (FDT) was an immediate signal to avoid emotional shorting. Patient traders would stay away from chasing and instead wait for a bounce to potentially set up a short. A more advanced approach would be to anticipate and catch an early reversal—playing against late sellers entering at poor location.
The overnight low came just 3 handles shy of testing 5956 (ON Low: 5959) before reversing. In the process, the initial downside target at 5979 was reclaimed, and after holding retests from above, a quick move unfolded toward the Smashlevel at 6008—our intraday pivot and a logical level to monitor for potential selling activity. While the 6008 level initially triggered a 20-handle reversal, buyers ultimately managed to reclaim it, leading to a value area traverse of Friday’s session, and a test of the resistance area between 6034 and 6042, where sellers were active. The pullback that unfolded prior to the RTH open to test the 6008 level from above was another great long opportunity—especially with confluence from the VIX resistance level at 21.92 (VIX high: 21.88). As mentioned, countless opportunities overnight.
The RTH session saw a small pullback after the open, which found buyers a few handles above the Smashlevel at 6008. Aggressive sellers were absorbed below the full session VWAP, leading to a reversal (see Figure 1). Unlike the overnight session, sellers failed to defend the resistance area between 6034 and 6042, and it appeared we were set for a bullish continuation after the C-period pulled back and successfully retested the 6042 level. However, a lower high was formed, and with the help of some headlines, a liquidation break unfolded—completely retracing the morning strength.
The Smashlevel at 6008 was taken out in the process; however, after a look-below-and-fail of last week’s low (6003.25), a significant squeeze unfolded, ultimately reaching the final upside target (FUT) at 6080, with a high of day (HOD) at 6081.50. The market looked below both last week’s low and the initial balance low—and failed—signaling a lack of stronger sellers at the moment. The closing M-period spike is our key reference in the short-term.
Both the overnight and RTH weakness were met with responsive buying, ultimately resulting in a look-below-and-fail of last week’s low—and an outside day up. The closing session formed an upward spike, which is of short-term interest. The strongest response would be to accept this closing strength and look for upside continuation, while failure to do so would open the door for a return to the HVN at 6038.
In terms of levels, the Smashlevel is at 6071—the base of the M-period closing spike. Holding above 6071 would signal strength, targeting 6103 (UT1), with a final upside target (FUT) at 6134 under sustained buying pressure.
On the flip side, failure to hold above 6071 would target the support area between 6042 and 6034 (DT1), with a final downside target (FDT) at 6008 under sustained selling pressure.
Levels of Interest
Going into tomorrow’s session, I’ll closely observe the behavior around 6071.
Holding above 6071 would target 6103 / 6134
Break and hold below 6071 would target 6042 / 6034 / 6008
Additionally, pay attention to the following VIX levels: 21.08 and 18.58. These levels can provide confirmation of strength or weakness.
Break and hold above 6134 with VIX below 18.58 would confirm strength.
Break and hold below 6008 with VIX above 21.08 would confirm weakness.
Overall, it's important to exercise caution when trading outside of the highlighted yellow levels. A non-cooperative VIX may suggest possible reversals i.e trade setups.


NOTE: The wrong chart was uploaded initially—it's been corrected now.
Thanks Smash! Great start to the week!