
ES Daily Plan | July 23, 2025
Market Context & Key Levels for the Day Ahead

— For new subscribers
The yellow levels highlighted at the bottom left of the chart are the primary intraday levels I focus on. To avoid impulsive decisions at poor trade locations, I follow a simple but effective rule: exercise caution when initiating trades outside of these yellow levels.
This means I’m cautious about chasing longs above the Final Upside Target (FUT) and shorts below the Final Downside Target (FDT). It’s important to understand that not chasing does not imply initiating a trade in the opposite direction — discipline over impulse.
Be sure to review the ES Weekly Plan | July 21-25, 2025 for a broader perspective, key levels, and market expectations for the week ahead.
Contextual Analysis & Plan
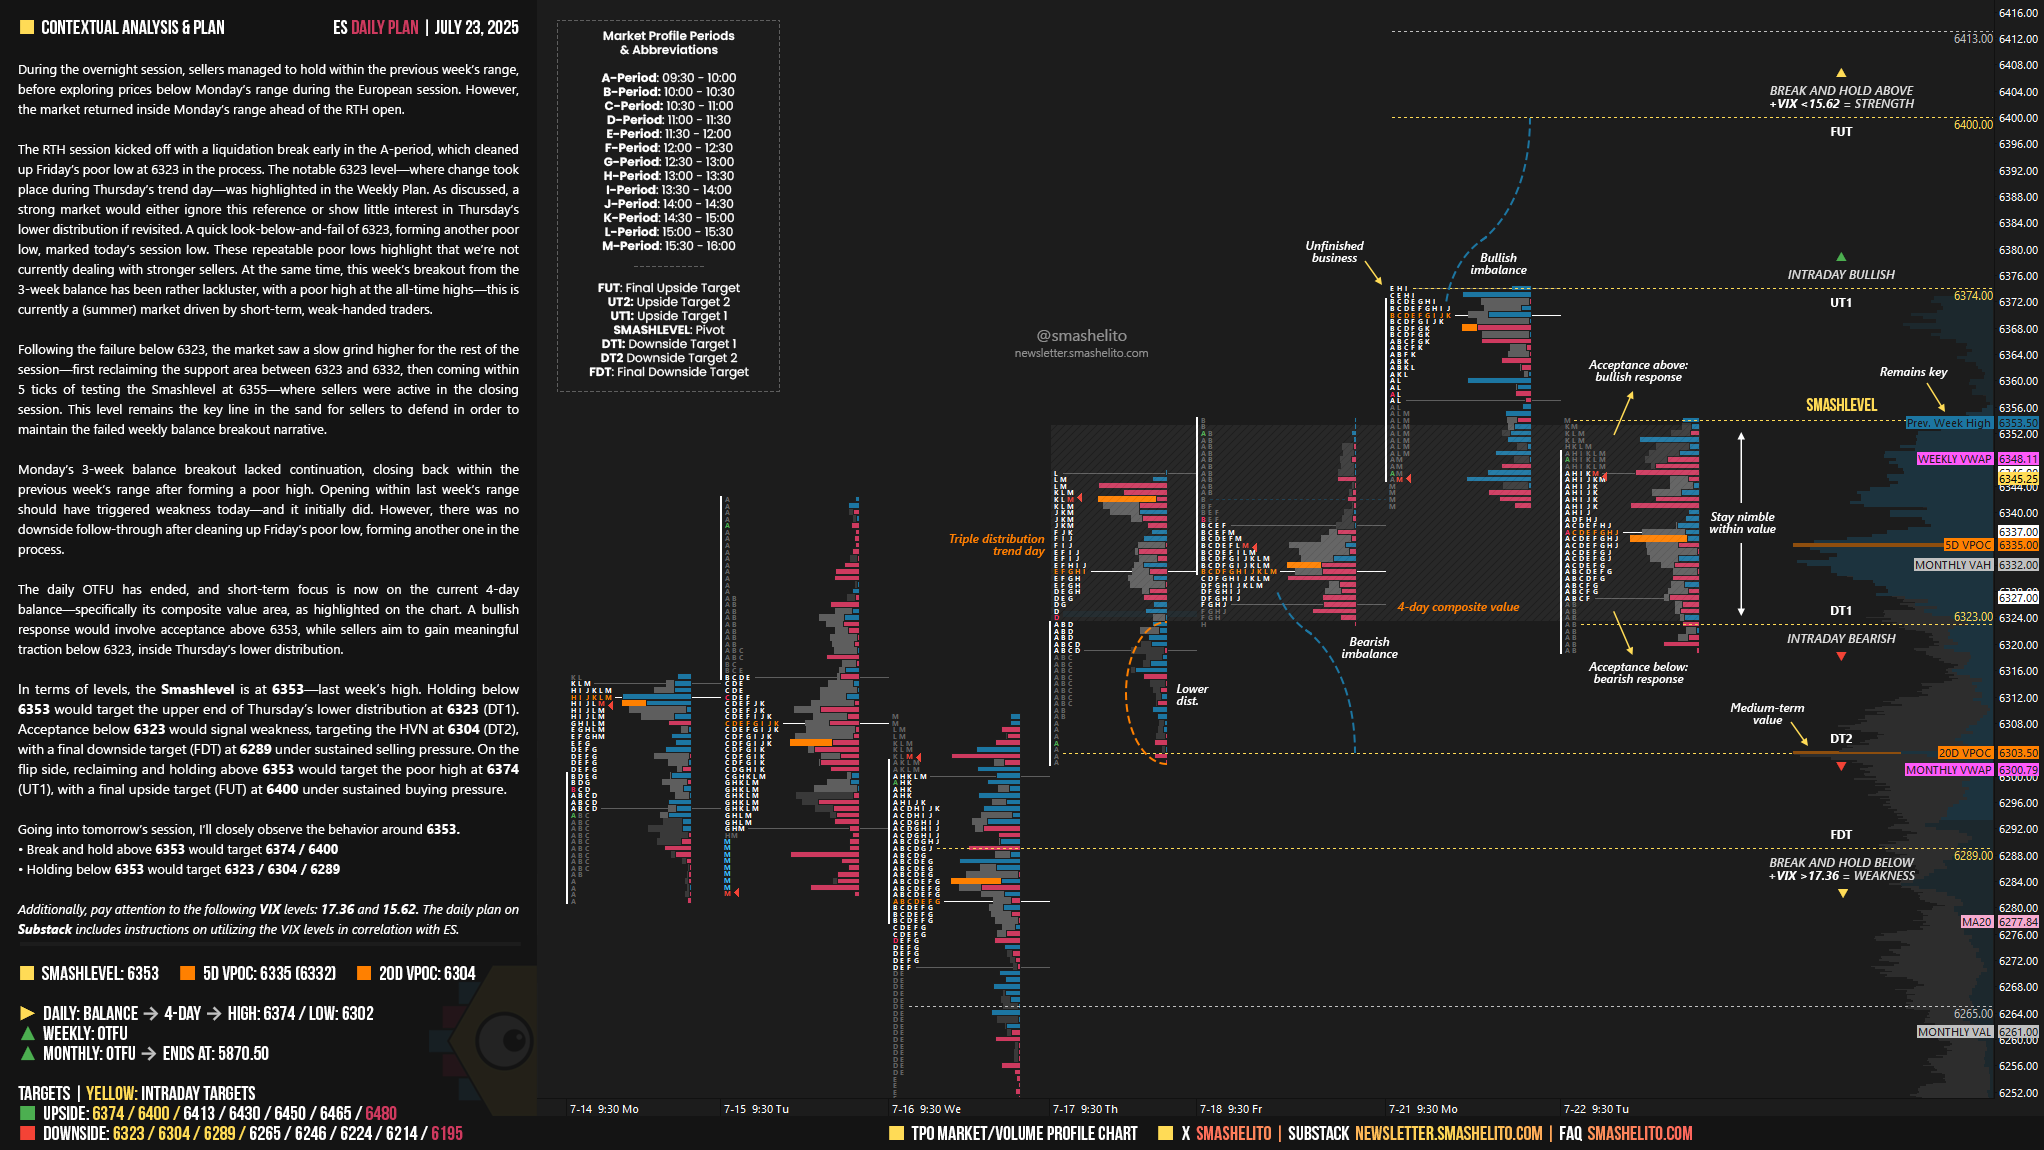
During the overnight session, sellers managed to hold within the previous week’s range, before exploring prices below Monday’s range during the European session. However, the market returned inside Monday’s range ahead of the RTH open.
The RTH session kicked off with a liquidation break early in the A-period, which cleaned up Friday’s poor low at 6323 in the process. The notable 6323 level—where change took place during Thursday’s trend day—was highlighted in the Weekly Plan. As discussed, a strong market would either ignore this reference or show little interest in Thursday’s lower distribution if revisited. A quick look-below-and-fail of 6323, forming another poor low, marked today’s session low. These repeatable poor lows highlight that we’re not currently dealing with stronger sellers. At the same time, this week’s breakout from the 3-week balance has been rather lackluster, with a poor high at the all-time highs—this is currently a (summer) market driven by short-term, weak-handed traders.
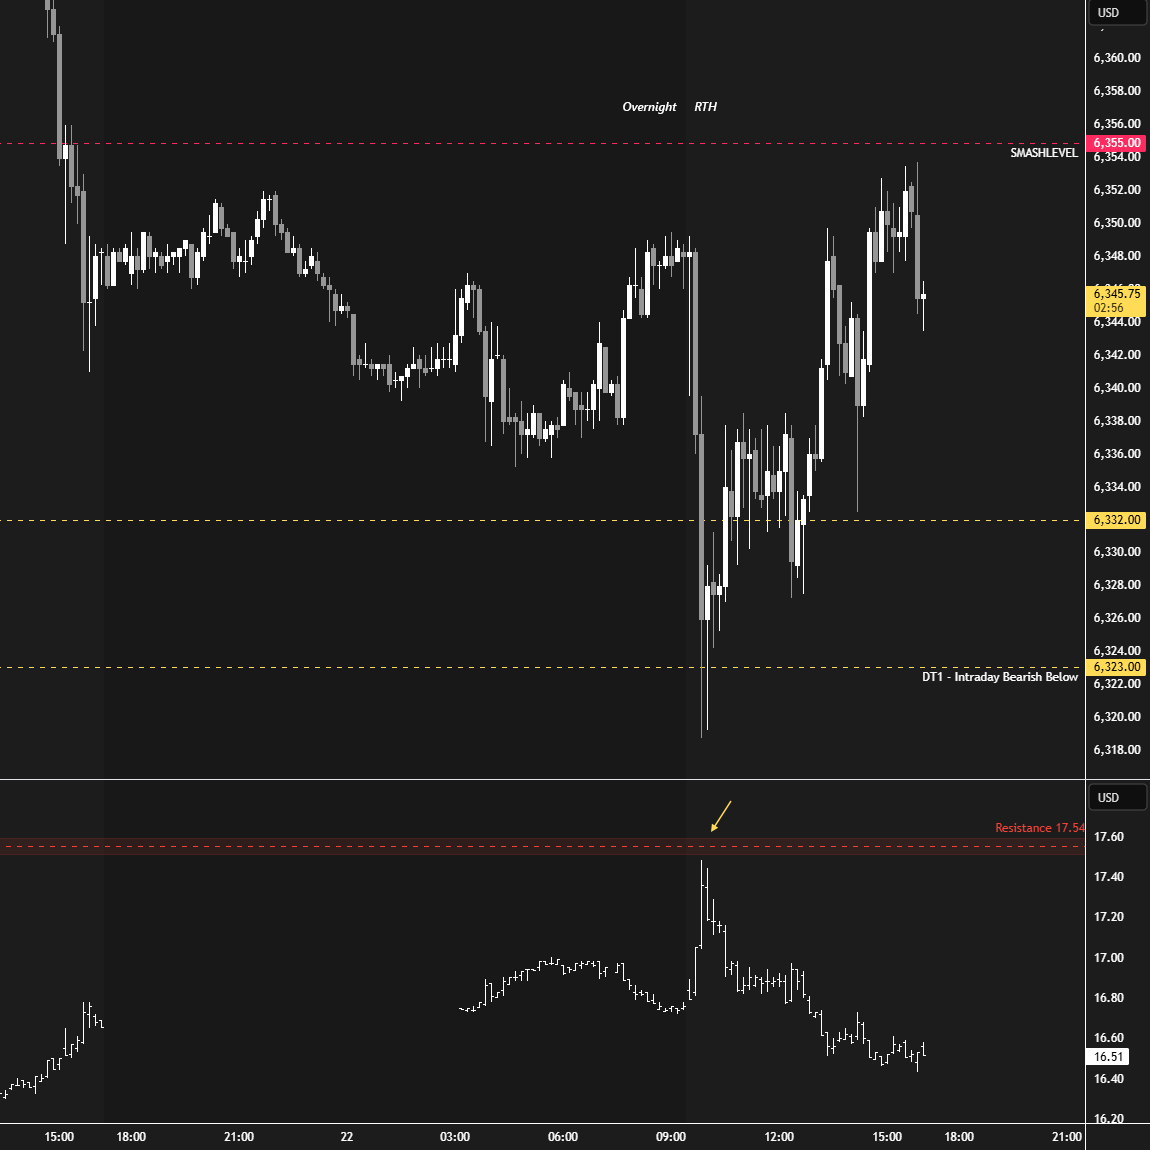
Following the failure below 6323, the market saw a slow grind higher for the rest of the session—first reclaiming the support area between 6323 and 6332, then coming within 5 ticks of testing the Smashlevel at 6355—where sellers were active in the closing session. This level remains the key line in the sand for sellers to defend in order to maintain the failed weekly balance breakout narrative.
Monday’s 3-week balance breakout lacked continuation, closing back within the previous week’s range after forming a poor high. Opening within last week’s range should have triggered weakness today—and it initially did. However, there was no downside follow-through after cleaning up Friday’s poor low, forming another one in the process.
The daily OTFU has ended, and short-term focus is now on the current 4-day balance—specifically its composite value area, as highlighted on the chart. A bullish response would involve acceptance above 6353, while sellers aim to gain meaningful traction below 6323, inside Thursday’s lower distribution.
In terms of levels, the Smashlevel is at 6353—last week’s high. Holding below 6353 would target the upper end of Thursday’s lower distribution at 6323 (DT1). Acceptance below 6323 would signal weakness, targeting the HVN at 6304 (DT2), with a final downside target (FDT) at 6289 under sustained selling pressure.
On the flip side, reclaiming and holding above 6353 would target the poor high at 6374 (UT1), with a final upside target (FUT) at 6400 under sustained buying pressure.
Levels of Interest
Going into tomorrow’s session, I’ll closely observe the behavior around 6353.
Break and hold above 6353 would target 6374 / 6400
Holding below 6353 would target 6323 / 6304 / 6289
Additionally, pay attention to the following VIX levels: 17.36 and 15.62. These levels can provide confirmation of strength or weakness.
Break and hold above 6400 with VIX below 15.62 would confirm strength.
Break and hold below 6289 with VIX above 17.36 would confirm weakness.
Overall, it's important to exercise caution when trading outside of the highlighted yellow levels. A non-cooperative VIX may suggest possible reversals i.e trade setups.
Thank you!
Thanks Smash!