
ES Weekly Plan | July 21-25, 2025
Recap, Market Context & Key Levels for the Week Ahead
Welcome to this week’s plan. Inside, you’ll find a quick review of last week’s price action, key economic events, market structure, context for the week ahead, and the levels I’ll be focusing on. Let’s get prepared.
Contents
Last Week’s Recap
Economic & Earnings Calendar
Market Structure
Contextual Analysis & Plan
Levels of Interest
Last Week’s Recap
Last week’s plan: ES Weekly Plan | July 14-18, 2025
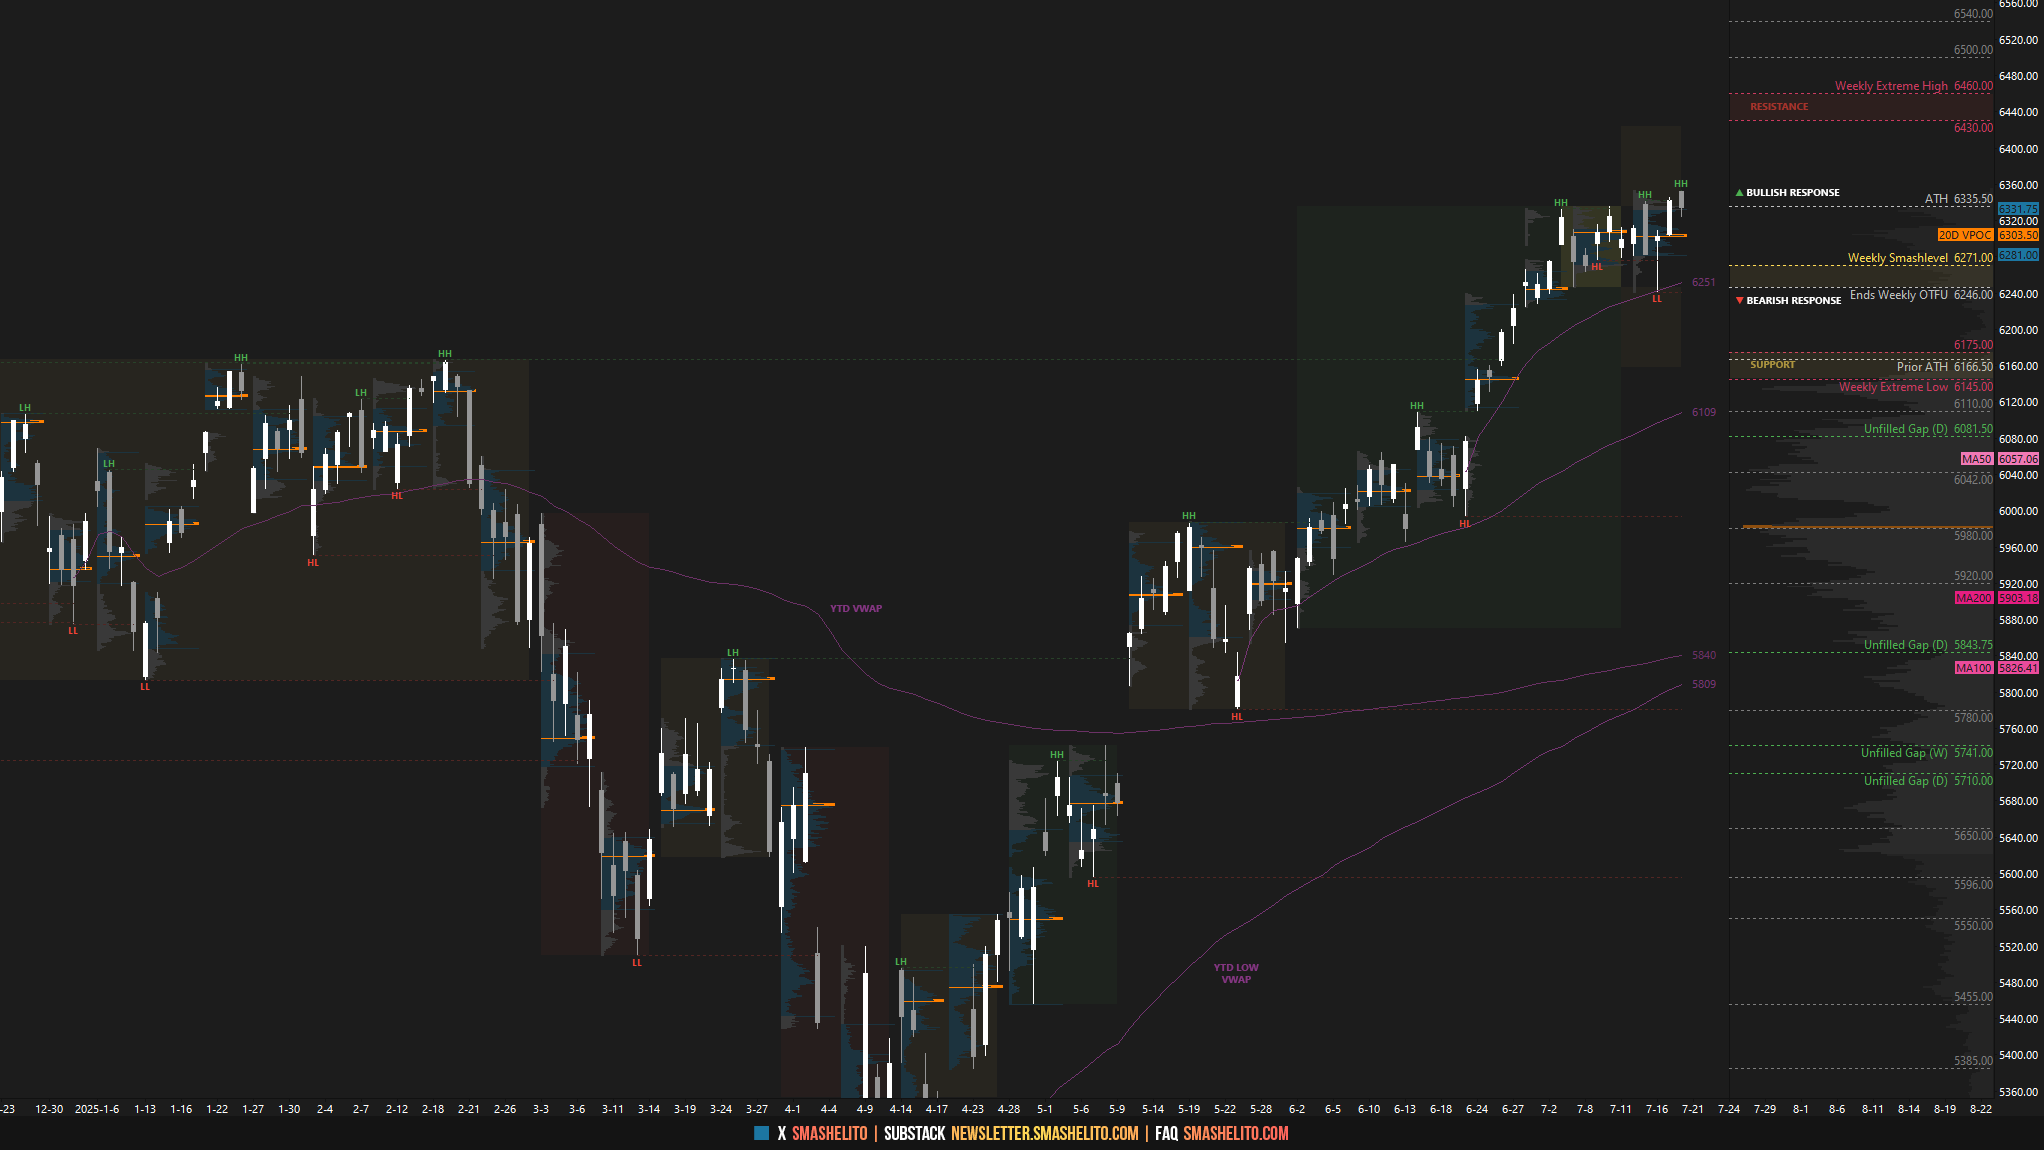
Heading into last week, the main focus was on the 6-day balance area between 6335 and 6246, with the key question being which direction it would resolve. A strong market would defend the balance low, keeping buyers in control of the auction, while failure to do so had the potential to introduce short-term weakness.
The context remained unchanged after Monday’s session, as the market continued to consolidate within the balance area. Change took place on Tuesday, with initiative activity during the overnight session leading to an RTH open with a true gap—not only outside the prior day’s range, but also above the multi-day balance. When the market opens with a true gap in either direction, it signals a shift in tone relative to the previous session. It’s our job to monitor whether that change is accepted or rejected. The breakout ultimately failed to gain acceptance, bringing the market back to value.
The failed breakout attempt led to a test of the opposite end of the balance area at 6246 on Wednesday. Sellers managed to stop the weekly one-time framing up, but failed to gain meaningful traction below 6246, leading to a return to value. This kind of responsive activity is typical in the absence of initiative behavior when the market is in short-term balance.
On Thursday, the market established a triple distribution trend day to the upside—marking another attempt to break out of the recent multi-day balance range. Heading into Friday, the key was to monitor for continuation—or lack thereof. Friday’s session, which printed a new all-time high overnight at 6357, ultimately failed to follow through, forming a double distribution profile to the downside. However, sellers were unable to fully negate Thursday’s trend day, as responsive buyers emerged at the upper end of Thursday’s lower distribution—a crucial area to monitor moving forward.
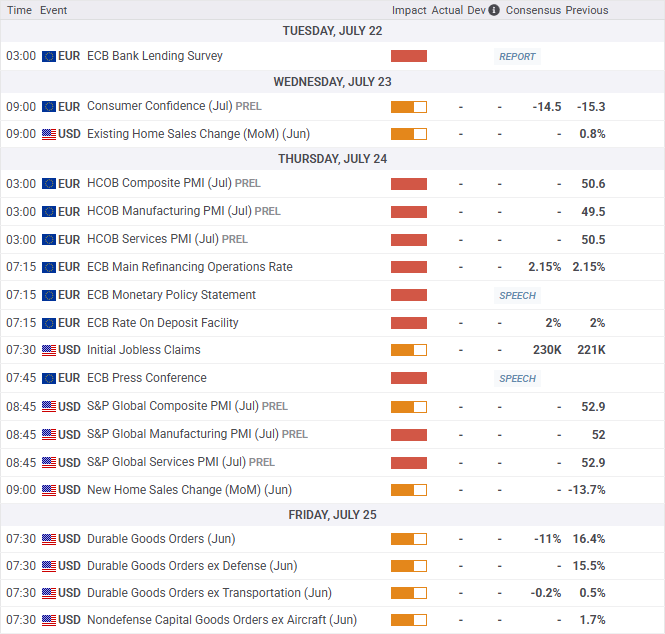
Economic & Earnings Calendar

Market Structure
🟩 Daily: OTFU → Ends at: 6323.25
🟨 Weekly: BALANCE → 6-Day → High: 6353.50 / Low: 6224.25
🟩 Monthly: OTFU → Ends at: 5870.50
Balance: A market condition where price consolidates within a defined range, reflecting indecision as the market awaits more market-generated information. We apply balance guidelines—favoring fade trades at range extremes (highs/lows) and preparing for breakout setups if balance resolves.
One-Time Framing Up (OTFU): A market condition where each subsequent bar forms a higher low, signaling a strong upward trend.
One-Time Framing Down (OTFD): A market condition where each subsequent bar forms a lower high, signaling a strong downward trend.
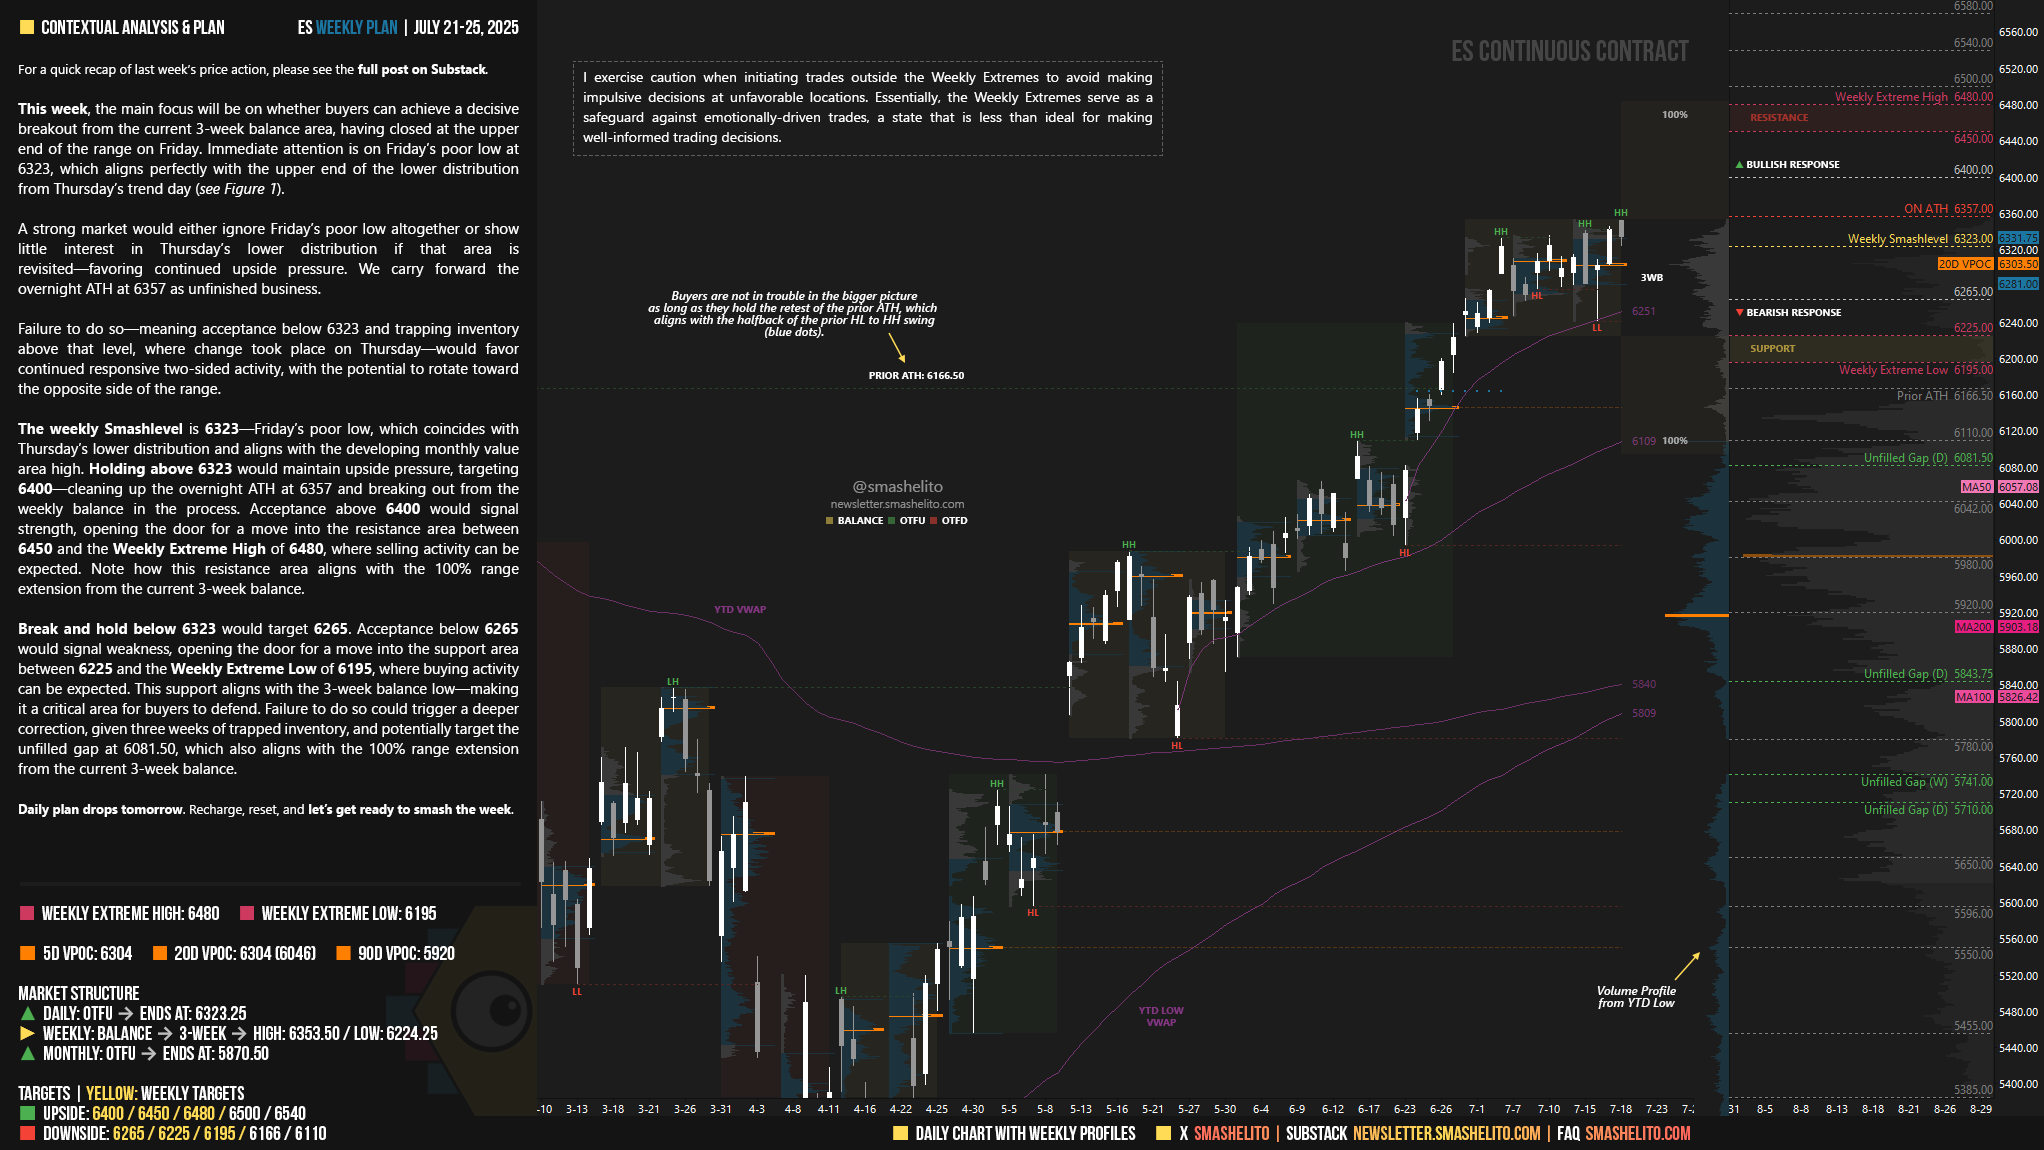
Contextual Analysis & Plan
This week, the main focus will be on whether buyers can achieve a decisive breakout from the current 3-week balance area, having closed at the upper end of the range on Friday. Immediate attention is on Friday’s poor low at 6323, which aligns perfectly with the upper end of the lower distribution from Thursday’s trend day (see Figure 1).
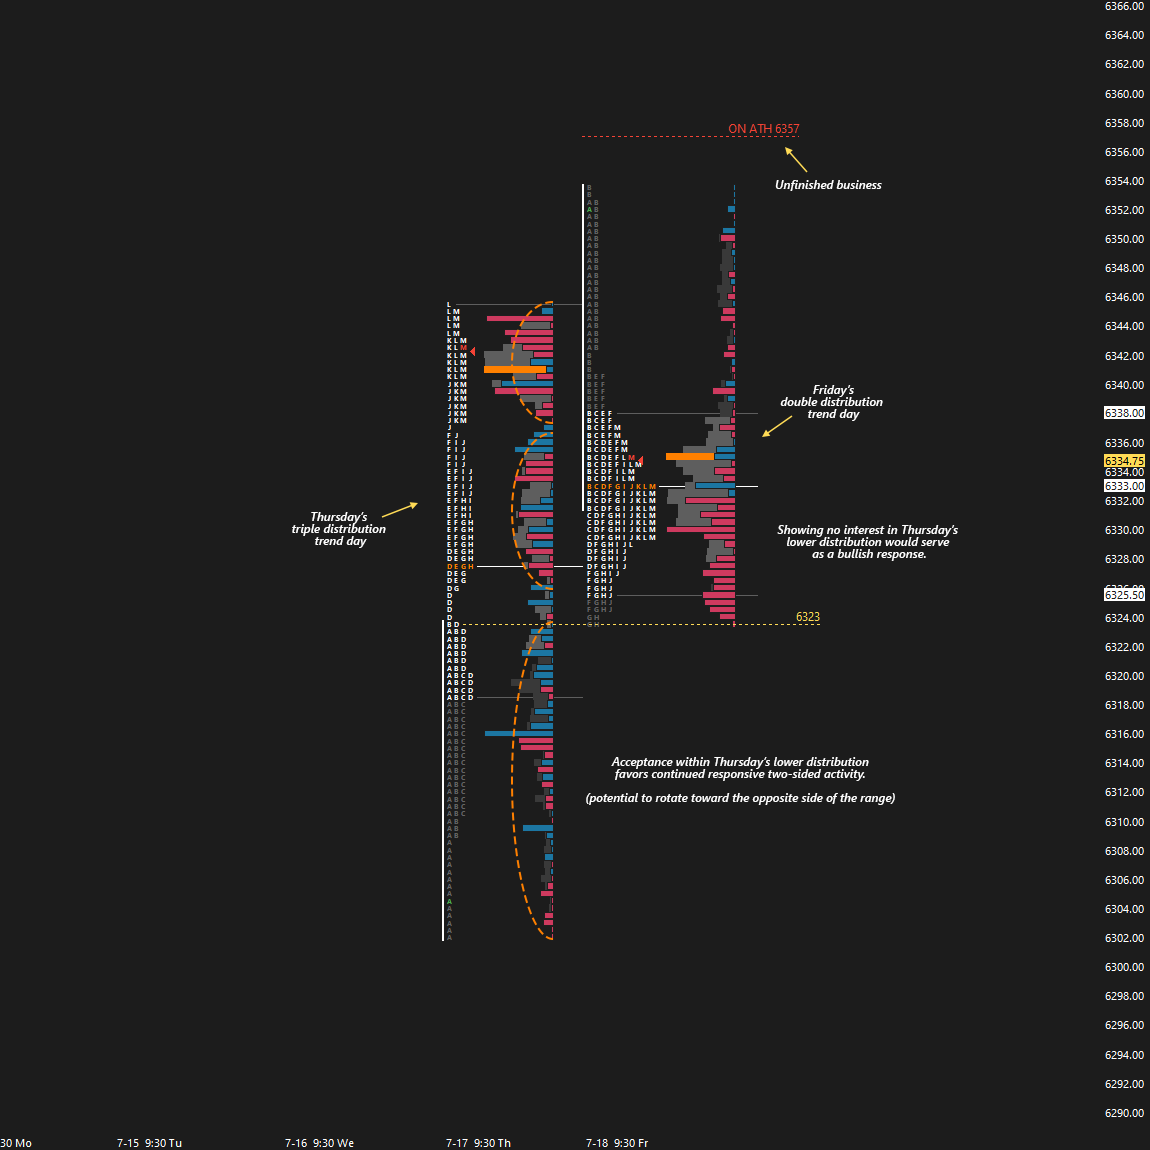
A strong market would either ignore Friday’s poor low altogether or show little interest in Thursday’s lower distribution if that area is revisited—favoring continued upside pressure. We carry forward the overnight ATH at 6357 as unfinished business.
Failure to do so—meaning acceptance below 6323 and trapping inventory above that level, where change took place on Thursday—would favor continued responsive two-sided activity, with the potential to rotate toward the opposite side of the range.
The weekly Smashlevel is 6323—Friday’s poor low, which coincides with Thursday’s lower distribution and aligns with the developing monthly value area high. Holding above 6323 would maintain upside pressure, targeting 6400—cleaning up the overnight ATH at 6357 and breaking out from the weekly balance in the process. Acceptance above 6400 would signal strength, opening the door for a move into the resistance area between 6450 and the Weekly Extreme High of 6480, where selling activity can be expected. Note how this resistance area aligns with the 100% range extension from the current 3-week balance.
Break and hold below 6323 would target 6265. Acceptance below 6265 would signal weakness, opening the door for a move into the support area between 6225 and the Weekly Extreme Low of 6195, where buying activity can be expected. This support aligns with the 3-week balance low—making it a critical area for buyers to defend. Failure to do so could trigger a deeper correction, given three weeks of trapped inventory, and potentially target the unfilled gap at 6081.50, which also aligns with the 100% range extension from the current 3-week balance.
Levels of Interest
In the upcoming week, I will closely observe the behavior around 6323.
Holding above 6323 would target 6400 / 6450 / 6480* / 6500 / 6540
Break and hold below 6323 would target 6265 / 6225 / 6195* / 6166 / 6110
*Weekly Extremes. I exercise caution when initiating trades outside the Weekly Extremes to avoid making impulsive decisions at unfavorable locations. Essentially, the Weekly Extremes serve as a safeguard against emotionally-driven trades, a state that is less than ideal for making well-informed trading decisions.
Daily plan drops tomorrow. Recharge, reset, and let’s get ready to smash the week.
you're the best!
Thanks Smash!