
ES Daily Plan | July 10, 2025
Market Context & Key Levels for the Day Ahead

— For new subscribers
The yellow levels highlighted at the bottom left of the chart are the primary intraday levels I focus on. To avoid impulsive decisions at poor trade locations, I follow a simple but effective rule: exercise caution when initiating trades outside of these yellow levels.
This means I’m cautious about chasing longs above the Final Upside Target (FUT) and shorts below the Final Downside Target (FDT). It’s important to understand that not chasing does not imply initiating a trade in the opposite direction — discipline over impulse.
Be sure to review the ES Weekly Plan | July 7-11, 2025 for a broader perspective, key levels, and market expectations for the week ahead.
Contextual Analysis & Plan
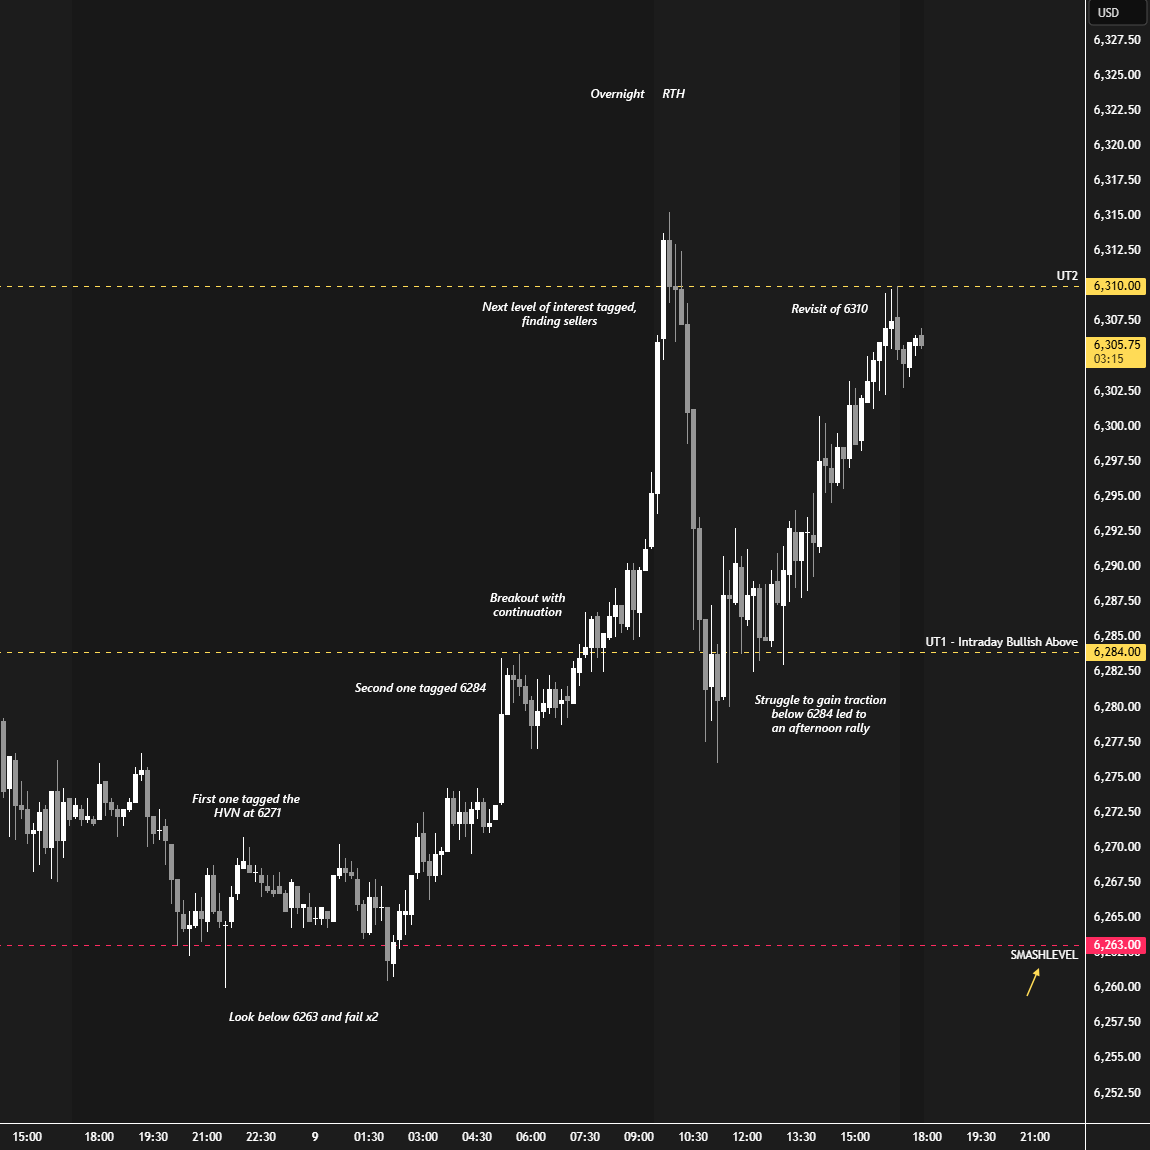
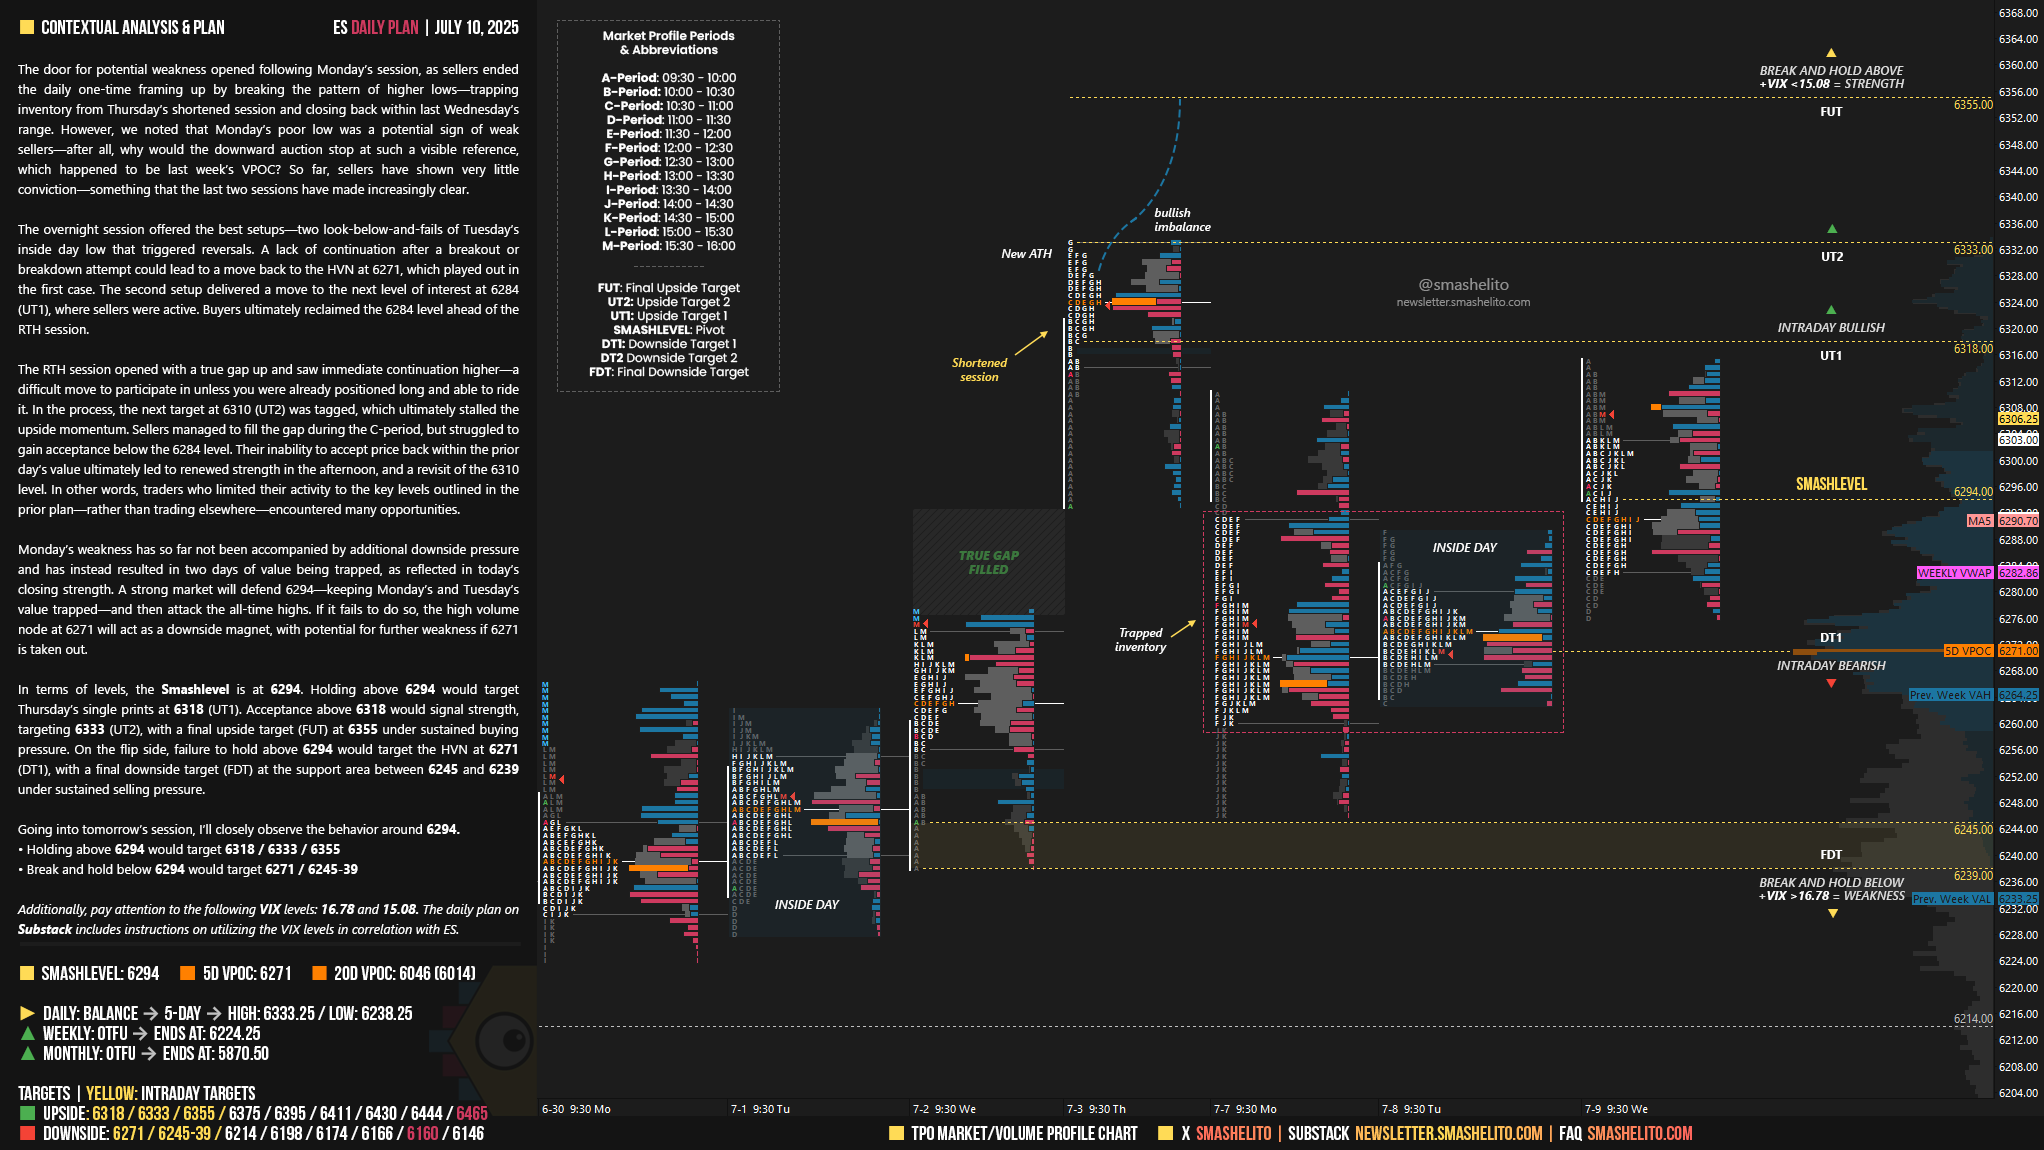
The door for potential weakness opened following Monday’s session, as sellers ended the daily one-time framing up by breaking the pattern of higher lows—trapping inventory from Thursday’s shortened session and closing back within last Wednesday’s range. However, we noted that Monday’s poor low was a potential sign of weak sellers—after all, why would the downward auction stop at such a visible reference, which happened to be last week’s VPOC? So far, sellers have shown very little conviction—something that the last two sessions have made increasingly clear.
The overnight session offered the best setups—two look-below-and-fails of Tuesday’s inside day low that triggered reversals. A lack of continuation after a breakout or breakdown attempt could lead to a move back to the HVN at 6271, which played out in the first case. The second setup delivered a move to the next level of interest at 6284 (UT1), where sellers were active. Buyers ultimately reclaimed the 6284 level ahead of the RTH session.
The RTH session opened with a true gap up and saw immediate continuation higher—a difficult move to participate in unless you were already positioned long and able to ride it. In the process, the next target at 6310 (UT2) was tagged, which ultimately stalled the upside momentum. Sellers managed to fill the gap during the C-period, but struggled to gain acceptance below the 6284 level. Their inability to accept price back within the prior day’s value ultimately led to renewed strength in the afternoon, and a revisit of the 6310 level. In other words, traders who limited their activity to the key levels outlined in the prior plan—rather than trading elsewhere—encountered many opportunities.
Monday’s weakness has so far not been accompanied by additional downside pressure and has instead resulted in two days of value being trapped, as reflected in today’s closing strength. A strong market will defend 6294—keeping Monday’s and Tuesday’s value trapped—and then attack the all-time highs. If it fails to do so, the high volume node at 6271 will act as a downside magnet, with potential for further weakness if 6271 is taken out.
In terms of levels, the Smashlevel is at 6294. Holding above 6294 would target Thursday’s single prints at 6318 (UT1). Acceptance above 6318 would signal strength, targeting 6333 (UT2), with a final upside target (FUT) at 6355 under sustained buying pressure.
On the flip side, failure to hold above 6294 would target the HVN at 6271 (DT1), with a final downside target (FDT) at the support area between 6245 and 6239 under sustained selling pressure.
Levels of Interest
Going into tomorrow’s session, I’ll closely observe the behavior around 6294.
Holding above 6294 would target 6318 / 6333 / 6355
Break and hold below 6294 would target 6271 / 6245-39
Additionally, pay attention to the following VIX levels: 16.78 and 15.08. These levels can provide confirmation of strength or weakness.
Break and hold above 6355 with VIX below 15.08 would confirm strength.
Break and hold below 6239 with VIX above 16.78 would confirm weakness.
Overall, it's important to exercise caution when trading outside of the highlighted yellow levels. A non-cooperative VIX may suggest possible reversals i.e trade setups.
You're a wizard Smash!
Big Smashelito fan!!! What's the difference between a high volume ledge/shelf on the larger time frame volume profile VS a low volume distribution dip on the larger time frame volume profile?