
ES Daily Plan | January 9, 2026
Market Context & Key Levels for the Day Ahead

— For new subscribers
The yellow levels highlighted at the bottom left of the chart are the primary intraday levels I focus on. To avoid impulsive decisions at poor trade locations, I follow a simple but effective rule: exercise caution when initiating trades outside of these yellow levels.
This means I’m cautious about chasing longs above the Final Upside Target (FUT) and shorts below the Final Downside Target (FDT). It’s important to understand that not chasing does not imply initiating a trade in the opposite direction — discipline over impulse.
Be sure to review the Weekly Plan for a broader perspective, key levels, and market expectations for the week ahead.

Contextual Analysis & Plan
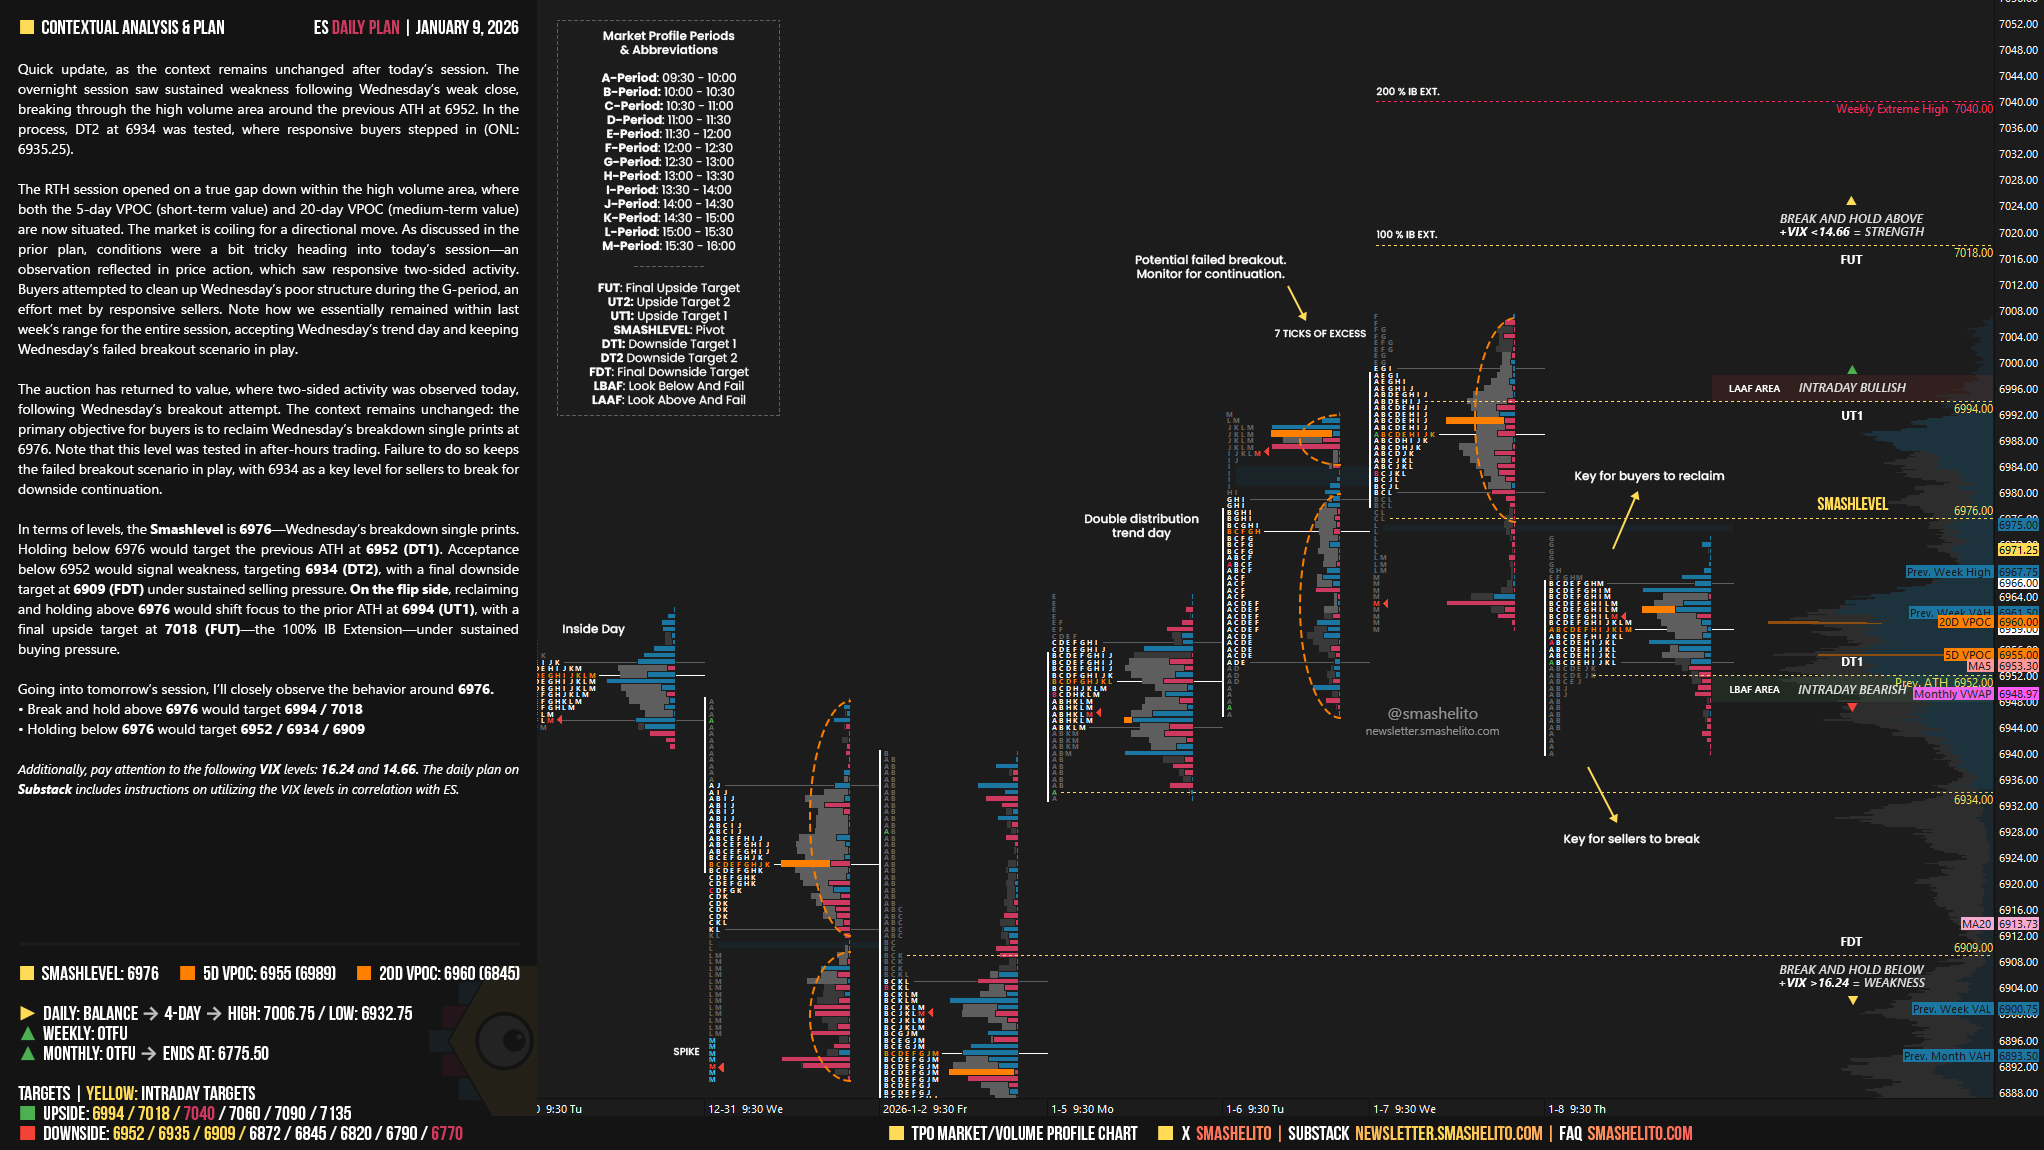
Quick update, as the context remains unchanged after today’s session. The overnight session saw sustained weakness following Wednesday’s weak close, breaking through the high volume area around the previous ATH at 6952. In the process, DT2 at 6934 was tested, where responsive buyers stepped in (ONL: 6935.25).
The RTH session opened on a true gap down within the high volume area, where both the 5-day VPOC (short-term value) and 20-day VPOC (medium-term value) are now situated. The market is coiling for a directional move. As discussed in the prior plan, conditions were a bit tricky heading into today’s session—an observation reflected in price action, which saw responsive two-sided activity. Buyers attempted to clean up Wednesday’s poor structure during the G-period, an effort met by responsive sellers. Note how we essentially remained within last week’s range for the entire session, accepting Wednesday’s trend day and keeping Wednesday’s failed breakout scenario in play.
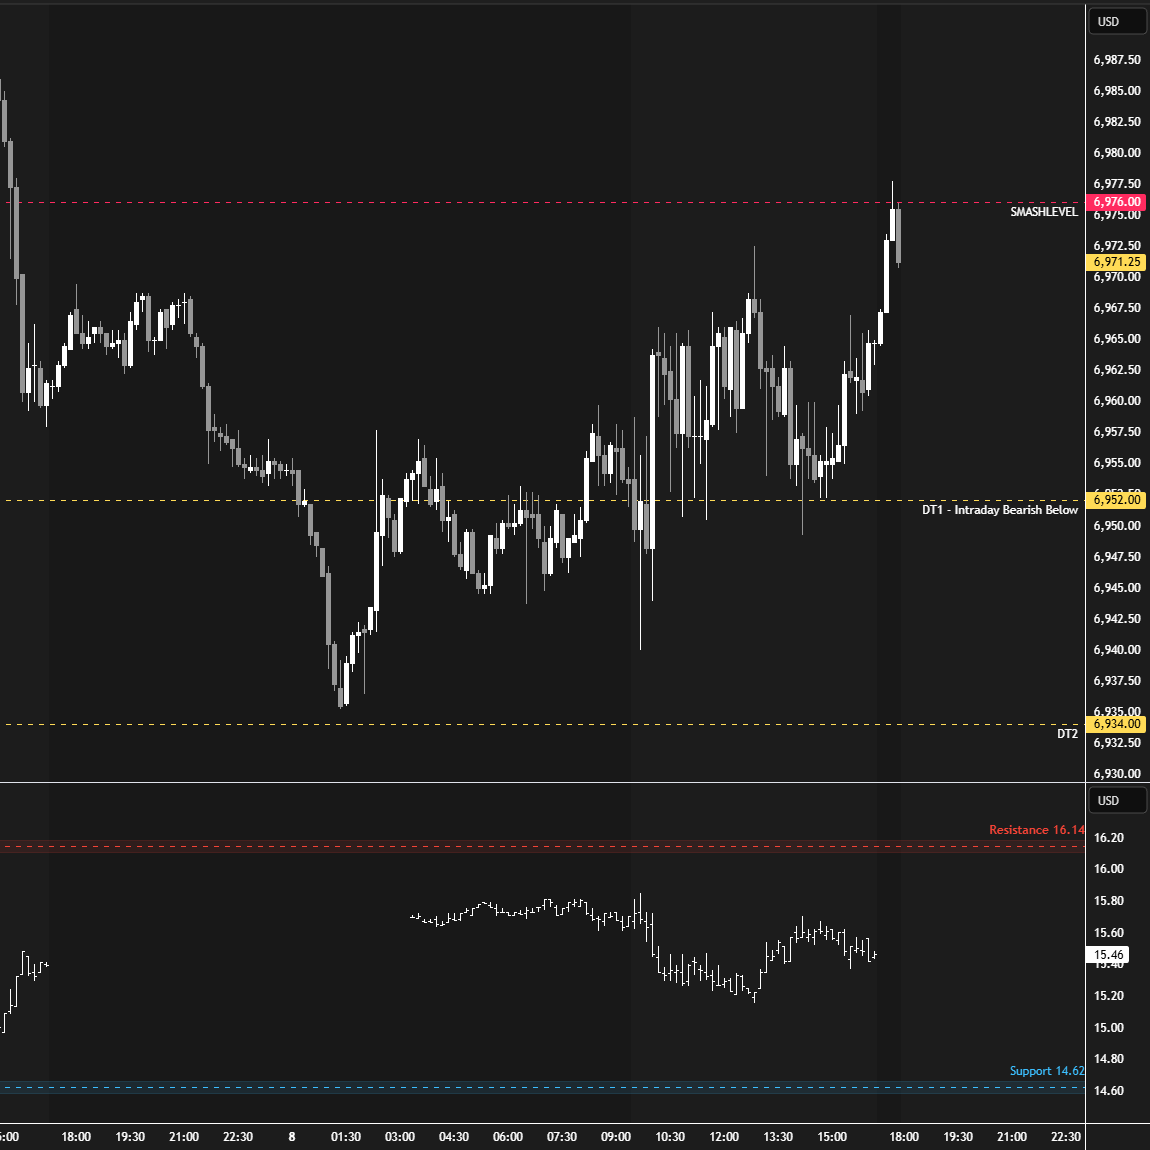
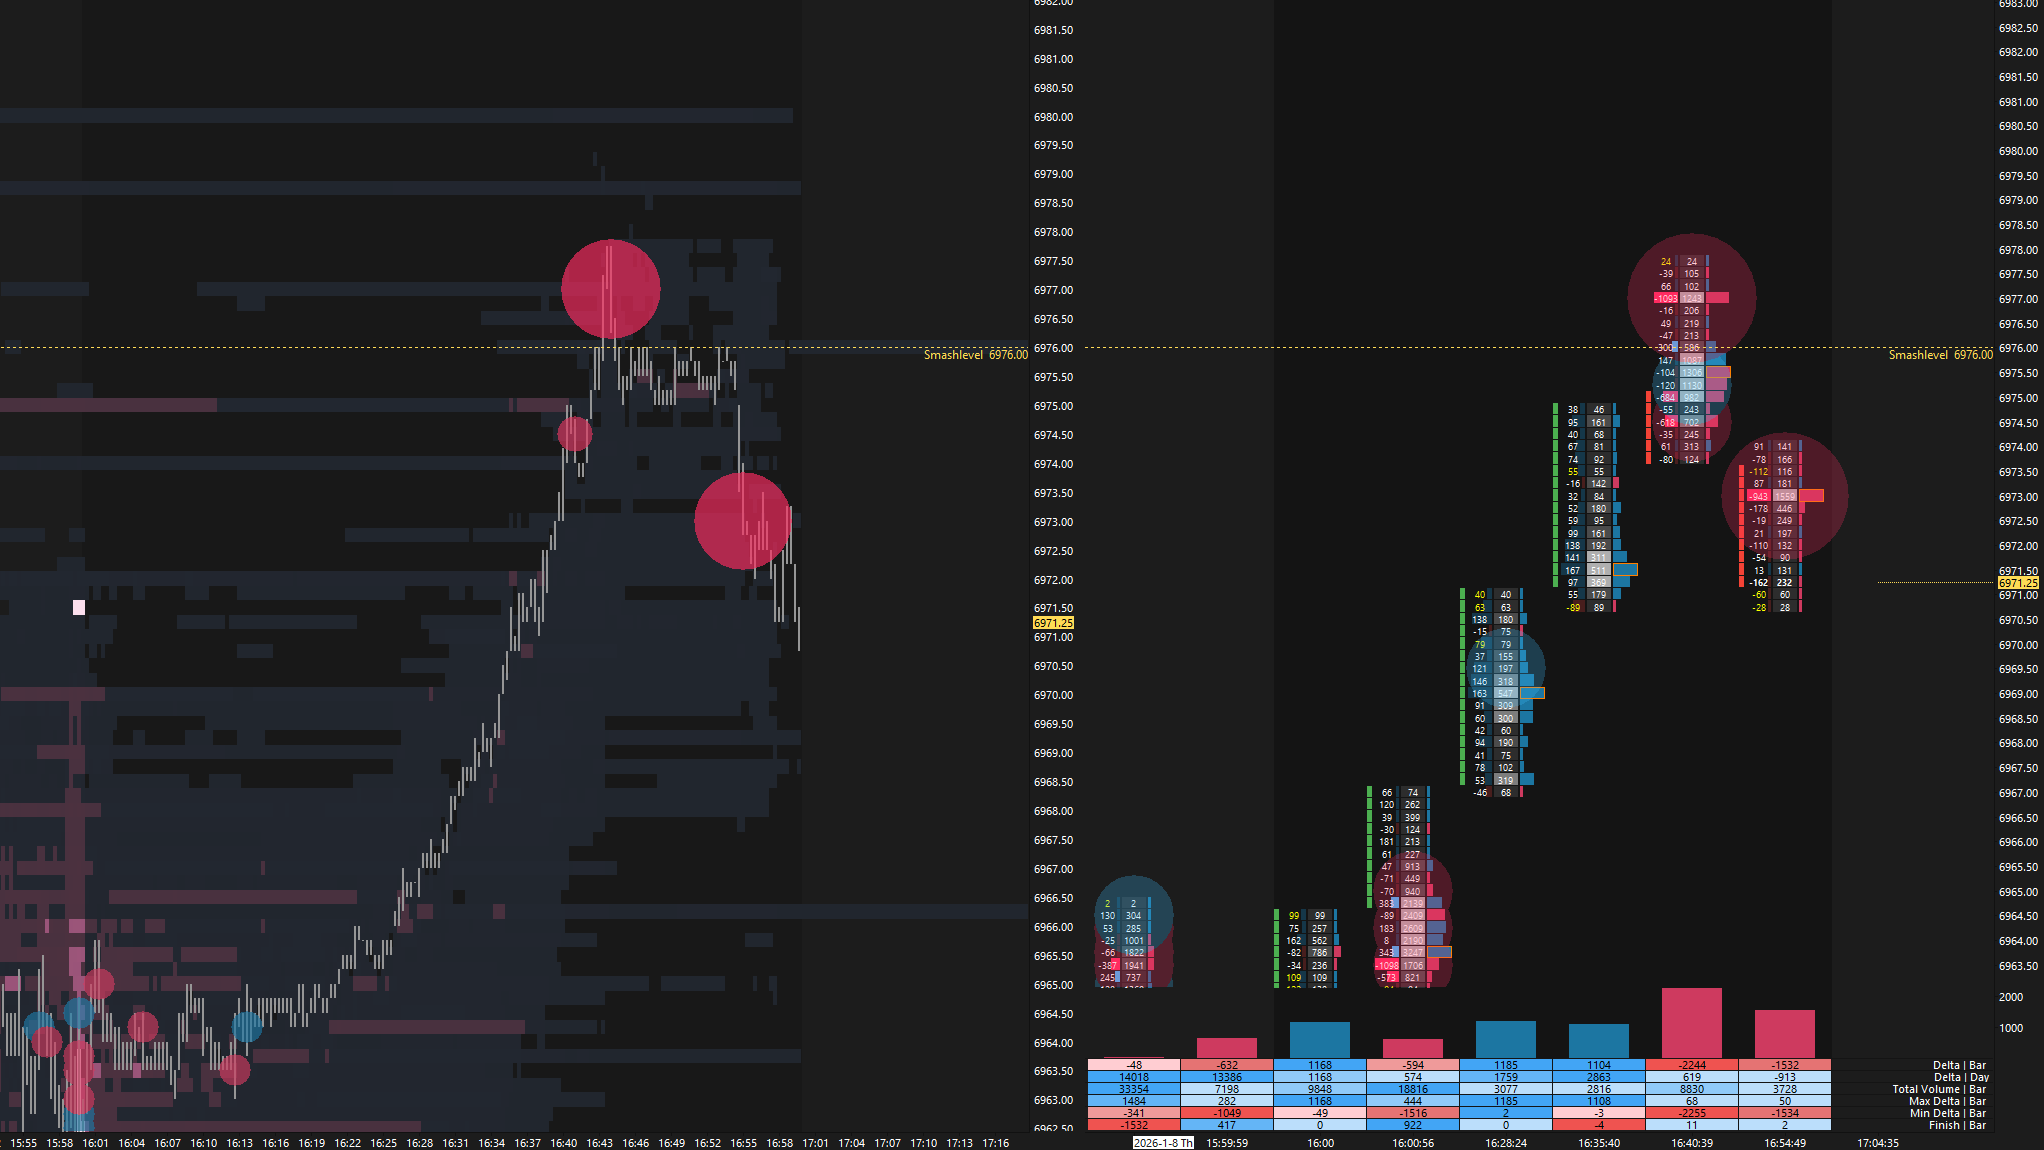
The auction has returned to value, where two-sided activity was observed today, following Wednesday’s breakout attempt. The context remains unchanged: the primary objective for buyers is to reclaim Wednesday’s breakdown single prints at 6976. Note that this level was tested in after-hours trading (see Figure 1). Failure to do so keeps the failed breakout scenario in play, with 6934 as a key level for sellers to break for downside continuation.
In terms of levels, the Smashlevel is 6976—Wednesday’s breakdown single prints. Holding below 6976 would target the previous ATH at 6952 (DT1). Acceptance below 6952 would signal weakness, targeting 6934 (DT2), with a final downside target at 6909 (FDT) under sustained selling pressure.
On the flip side, reclaiming and holding above 6976 would shift focus to the prior ATH at 6994 (UT1), with a final upside target at 7018 (FUT)—the 100% IB Extension—under sustained buying pressure.
Levels of Interest
Going into tomorrow’s session, I’ll closely observe the behavior around 6976.
Break and hold above 6976 would target 6994 / 7018
Holding below 6976 would target 6952 / 6934 / 6909
Additionally, pay attention to the following VIX levels: 16.24 and 14.66. These levels can provide confirmation of strength or weakness.
Break and hold above 7018 with VIX below 14.66 would confirm strength.
Break and hold below 6909 with VIX above 16.24 would confirm weakness.
Overall, it's important to exercise caution when trading outside of the highlighted yellow levels. A non-cooperative VIX may suggest possible reversals i.e trade setups.
Tomorrow has this supreme court decision on tarrifs supposedly on 10:00 AM.
Thank you!