
ES Weekly Plan | January 5-9, 2026
Recap, Market Context & Key Levels for the Week Ahead

Welcome to this week’s plan. Inside, you’ll find a quick review of last week’s price action, key economic events, market structure, context for the week ahead, and the levels I’ll be focusing on. Let’s get prepared.
Contents
Last Week in Review
Economic & Earnings Calendar
Market Structure
Contextual Analysis & Plan
Key Levels of Interest
Last Week in Review
Last week’s plan:

Coming into last week, the main focus was on buyers’ ability to sustain upside momentum following the prior directional move, which resulted in a new all-time high (ATH). The key was to monitor for continuation (acceptance) or the lack thereof (rejection), with the market in one-time framing higher across all timeframes.
A bullish response would involve building value above the prior ATH at 6952, signaling acceptance and favoring continued upside exploration while maintaining the current imbalance phase.
Conversely, failure to sustain the breakout, signaling rejection, would favor short-term weakness and open the door to fill the gap at 6893.75—a critical area for buyers to hold. Falling below this level would set the stage for continued downside pressure, with the HVN at 6842 potentially acting as a downside magnet.
Monday’s session kicked off with a true gap down that immediately broke the pattern of higher lows on the daily time frame, cleaning up the poor structure from the holiday week in the process. Heading into Tuesday’s session, there was one gap above at 6969 (which remained unfilled throughout the week) and a gap below at 6893.75. Failure to fill the upside gap set the stage for a move to fill the downside gap.
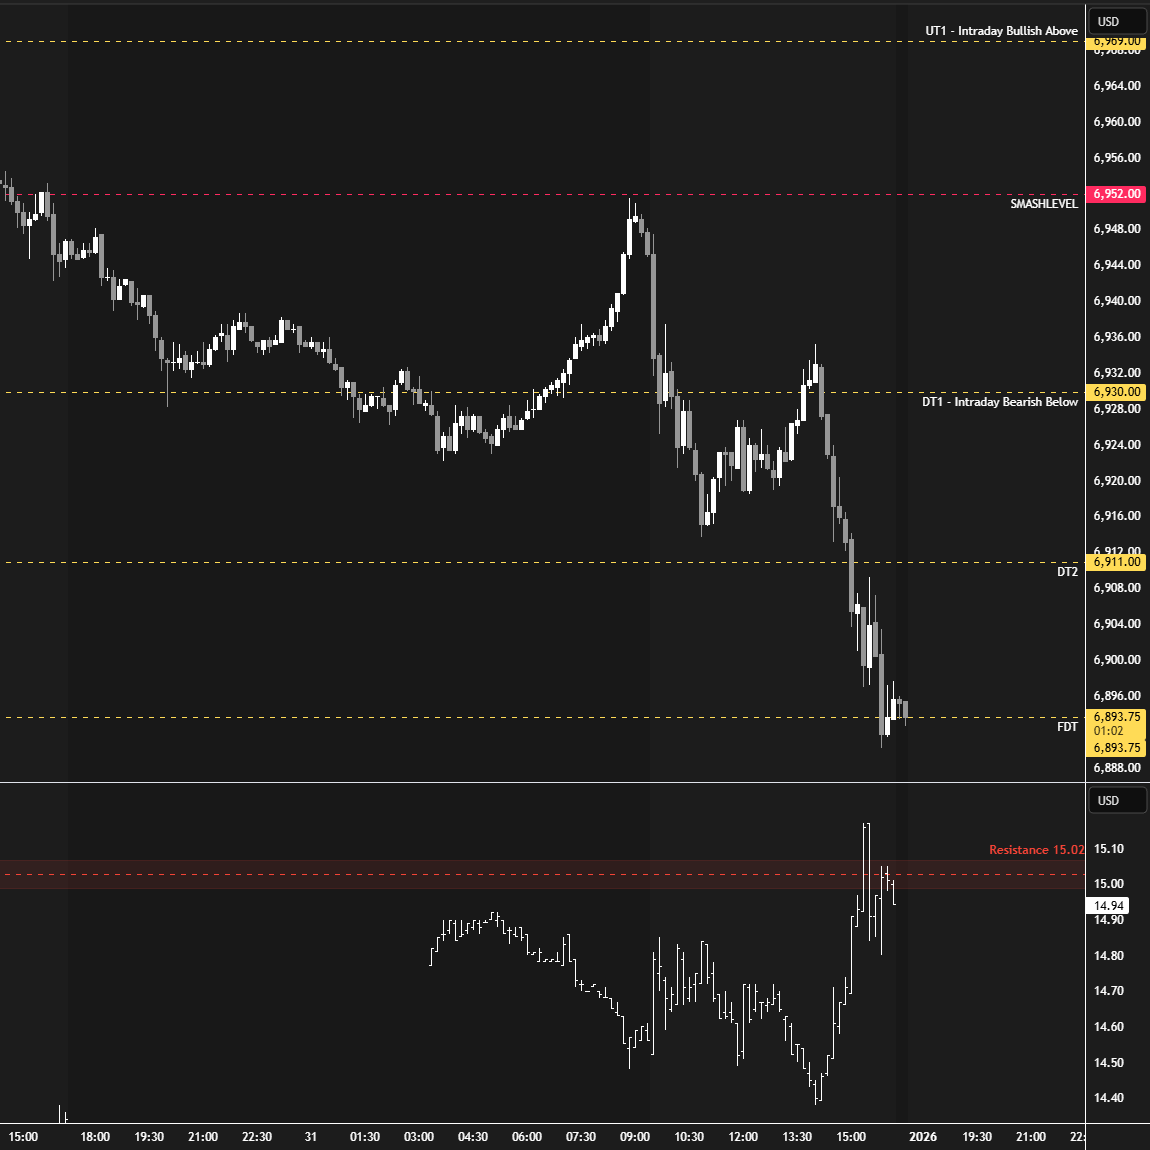
Tuesday’s session formed an inside day, confirming that the auction had transitioned into balance, contrasting with the trending environment observed during the holiday week. Change took place on Wednesday’s session, when an inside-day breakdown led to the filling of the downside gap at 6893.75, forming a double distribution trend day. In terms of intraday levels, Wednesday was extremely accurate, with the Smashlevel capping the upside and the final downside target (FDT) reached in the closing session (see Figure 1).
On Friday, the auction retraced a significant portion of Wednesday’s decline overnight; however, the RTH session remained under continued downside pressure, ultimately extending the pattern of lower highs and lower lows on the daily time frame. The afternoon session saw an inventory correction, which was met by reloading sellers. Friday’s afternoon rally high at 6909 will be a key level to monitor in the short term, aligning closely with the low from two weeks ago.
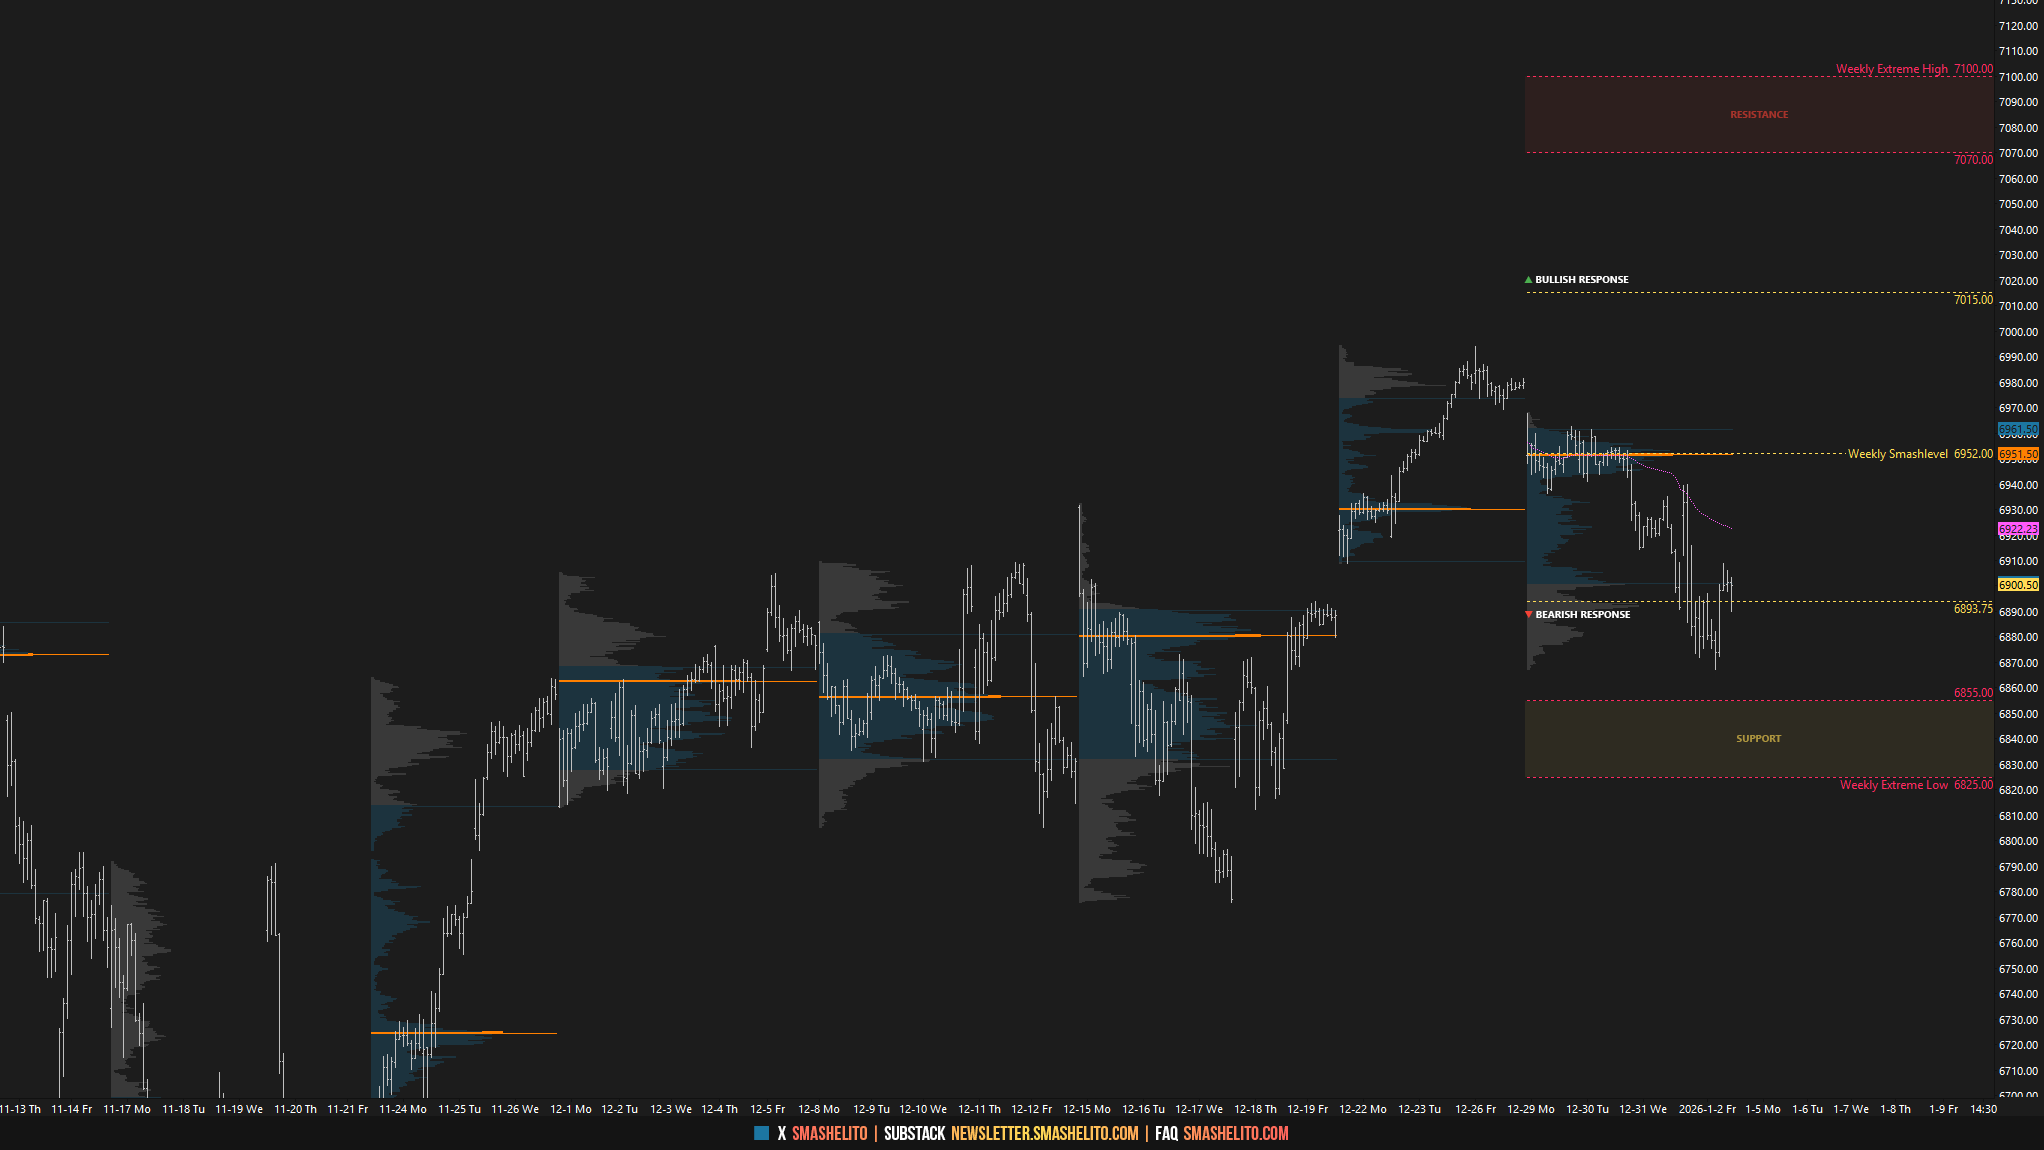
Price Action vs. Weekly Levels
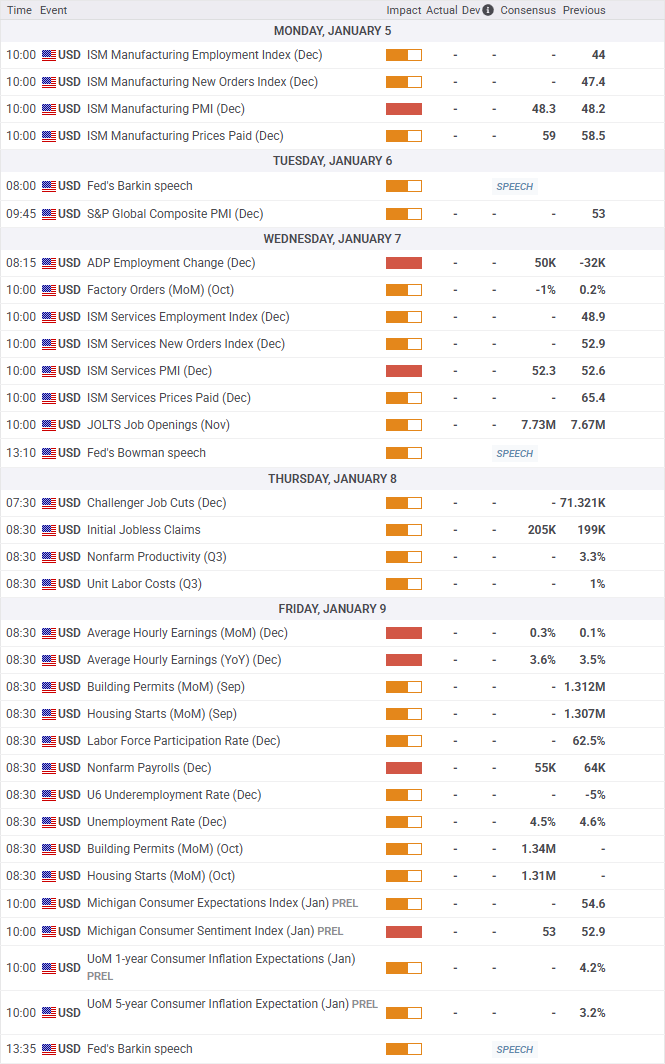
Economic & Earnings Calendar
Central Standard Time
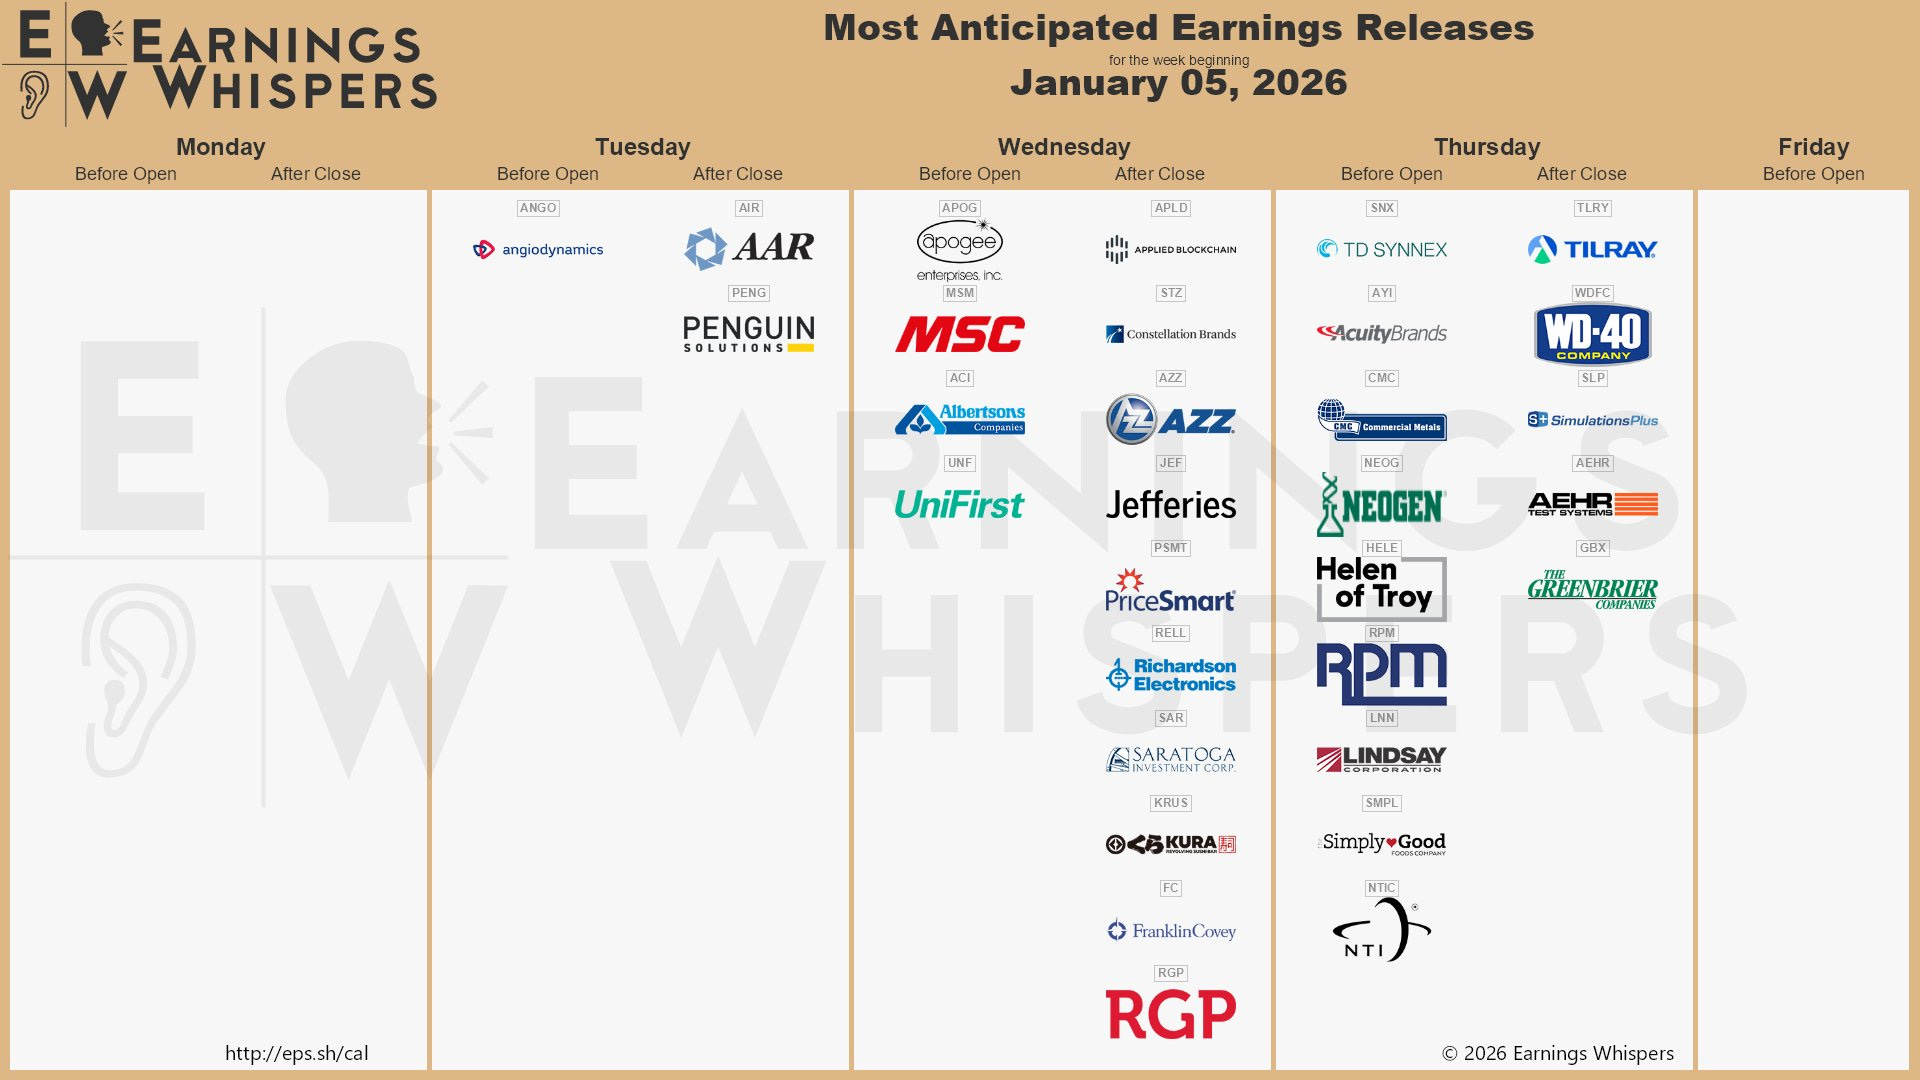
Earnings Whispers
Market Structure
🟥 Daily: OTFD → Ends at: 6939.75
🟨 Weekly: BALANCE → 2-Week → High: 6994 / Low: 6866.75
🟩 Monthly: OTFU → Ends at: 6775.50
Balance: A market condition where price consolidates within a defined range, reflecting indecision as the market awaits more market-generated information. We apply balance guidelines—favoring fade trades at range extremes (highs/lows) and preparing for breakout setups if balance resolves.
One-Time Framing Up (OTFU): A market condition where each subsequent bar forms a higher low, signaling a strong upward trend.
One-Time Framing Down (OTFD): A market condition where each subsequent bar forms a lower high, signaling a strong downward trend.
Contextual Analysis & Plan
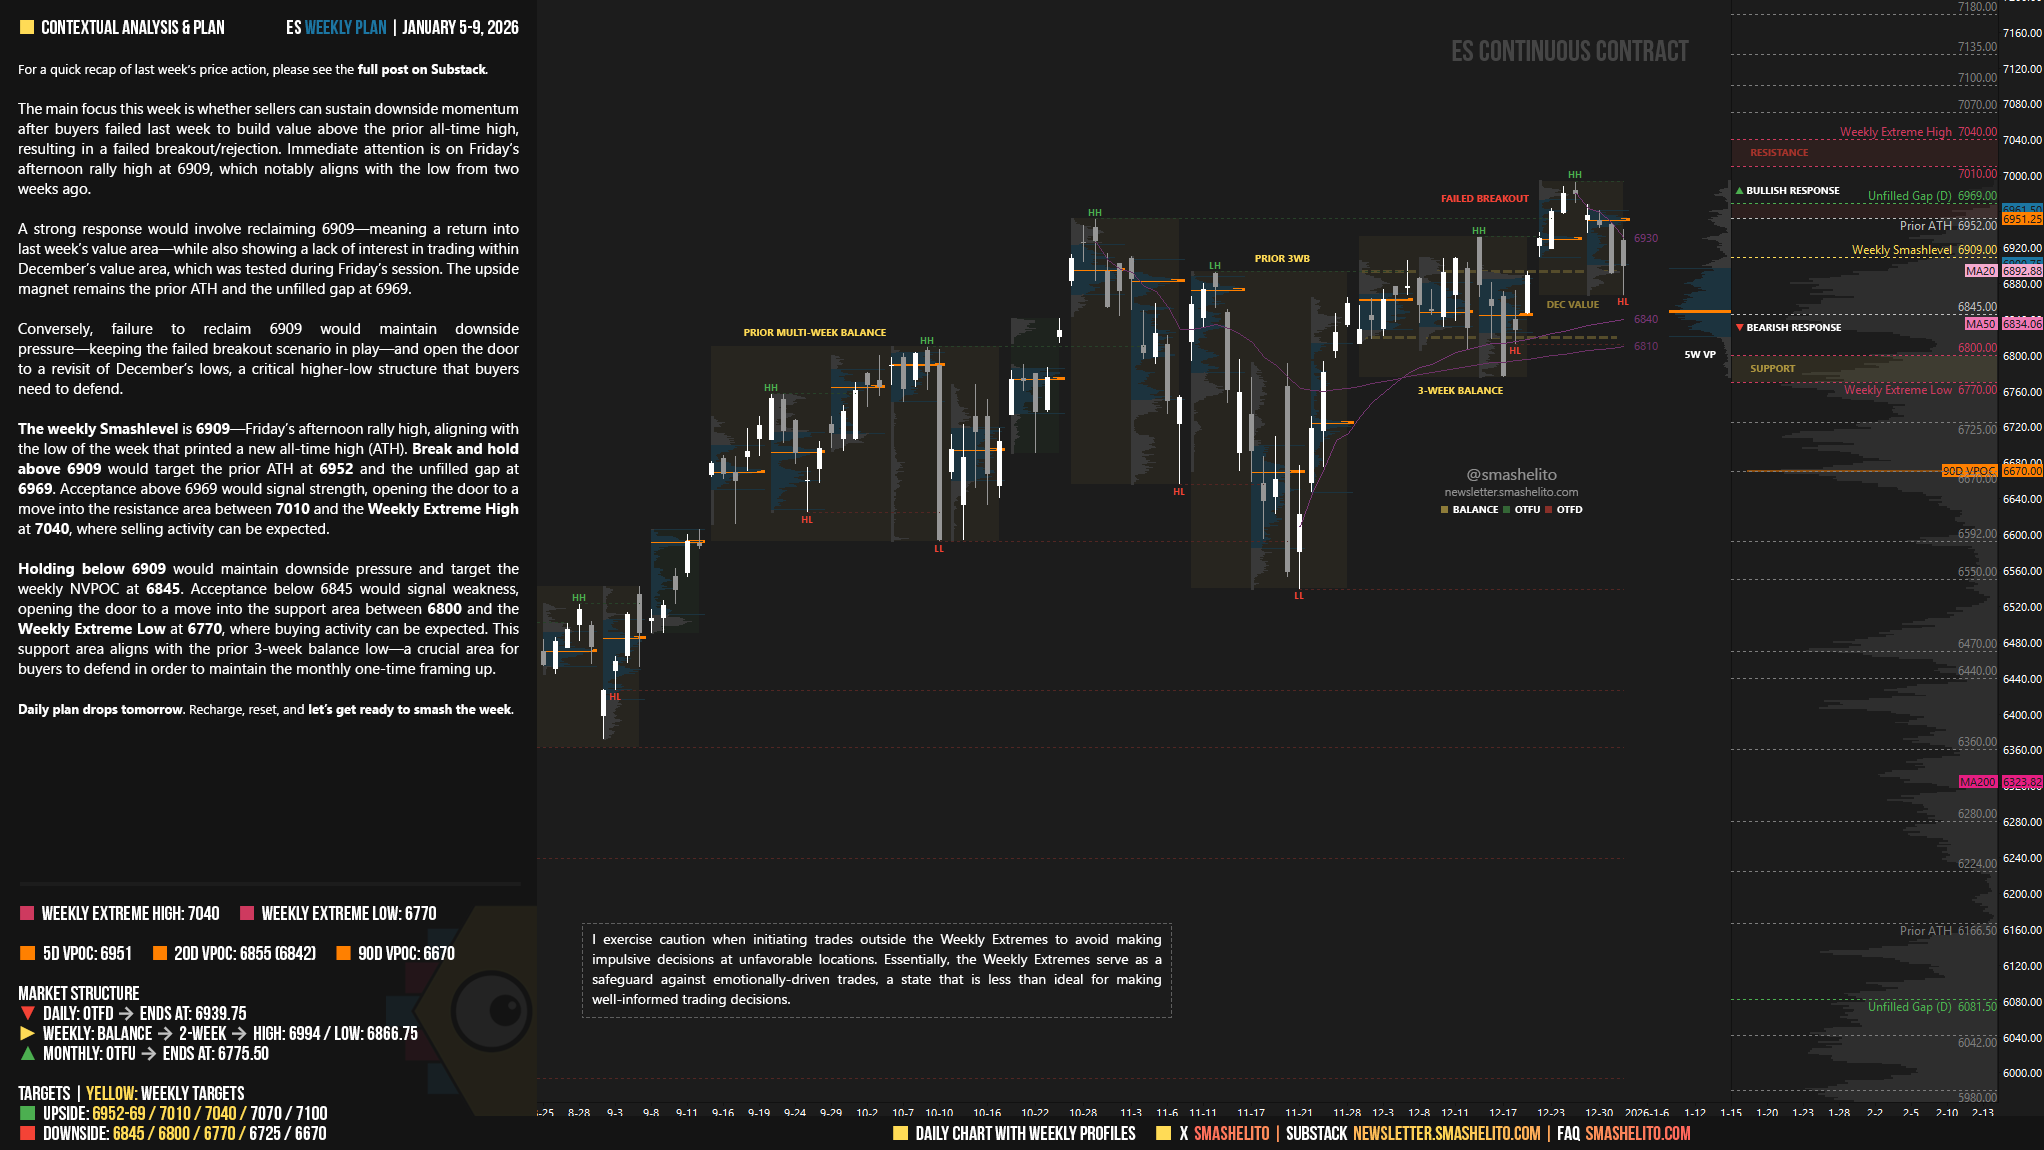
The main focus this week is whether sellers can sustain downside momentum after buyers failed last week to build value above the prior all-time high, resulting in a failed breakout/rejection. Immediate attention is on Friday‘s afternoon rally high at 6909, which notably aligns with the low from two weeks ago.
A strong response would involve reclaiming 6909—meaning a return into last week’s value area—while also showing a lack of interest in trading within December’s value area, which was tested during Friday’s session. The upside magnet remains the prior ATH and the unfilled gap at 6969.
Conversely, failure to reclaim 6909 would maintain downside pressure—keeping the failed breakout scenario in play—and open the door to a revisit of December’s lows, a critical higher-low structure that buyers need to defend.
The weekly Smashlevel is 6909—Friday’s afternoon rally high, aligning with the low of the week that printed a new all-time high (ATH). Break and hold above 6909 would target the prior ATH at 6952 and the unfilled gap at 6969. Acceptance above 6969 would signal strength, opening the door to a move into the resistance area between 7010 and the Weekly Extreme High at 7040, where selling activity can be expected.
Holding below 6909 would maintain downside pressure and target the weekly NVPOC at 6845. Acceptance below 6845 would signal weakness, opening the door to a move into the support area between 6800 and the Weekly Extreme Low at 6770, where buying activity can be expected. This support area aligns with the prior 3-week balance low—a crucial area for buyers to defend in order to maintain the monthly one-time framing up.
Key Levels of Interest
In the upcoming week, I will closely observe the behavior around 6909.
Break and hold above 6909 would target 6952-69 / 7010 / 7040* / 7070 / 7100
Holding below 6909 would target 6845 / 6800 / 6770* / 6725 / 6670
*Weekly Extremes. I exercise caution when initiating trades outside the Weekly Extremes to avoid making impulsive decisions at unfavorable locations. Essentially, the Weekly Extremes serve as a safeguard against emotionally-driven trades, a state that is less than ideal for making well-informed trading decisions.
Daily plan drops tomorrow. Recharge, reset, and let’s get ready to smash the week.
Thanks Smash!
Thanks Smash and Happy New Year!