
ES Daily Plan | January 8, 2026
Market Context & Key Levels for the Day Ahead

— For new subscribers
The yellow levels highlighted at the bottom left of the chart are the primary intraday levels I focus on. To avoid impulsive decisions at poor trade locations, I follow a simple but effective rule: exercise caution when initiating trades outside of these yellow levels.
This means I’m cautious about chasing longs above the Final Upside Target (FUT) and shorts below the Final Downside Target (FDT). It’s important to understand that not chasing does not imply initiating a trade in the opposite direction — discipline over impulse.
Be sure to review the Weekly Plan for a broader perspective, key levels, and market expectations for the week ahead.

Contextual Analysis & Plan
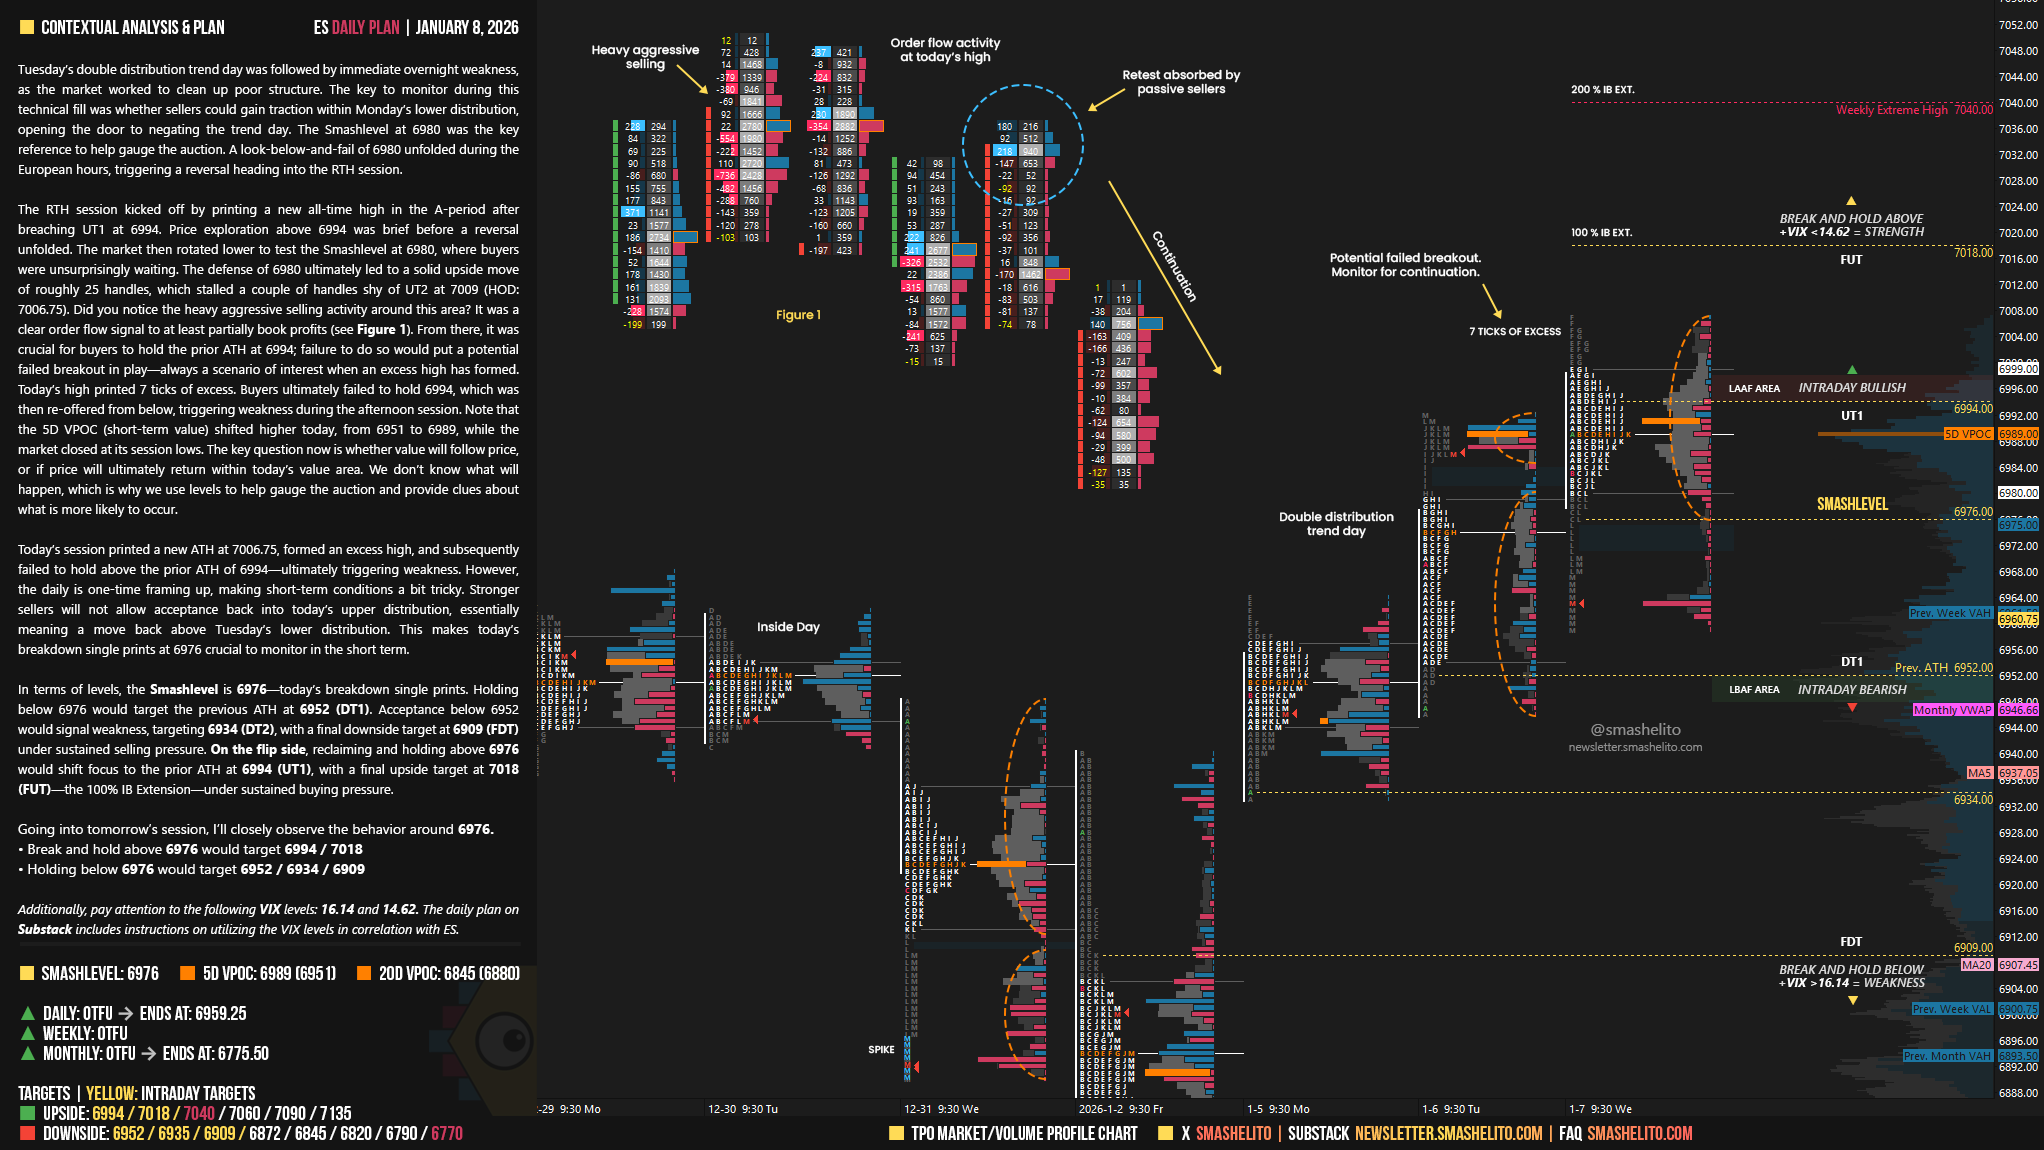
Tuesday’s double distribution trend day was followed by immediate overnight weakness, as the market worked to clean up poor structure. The key to monitor during this technical fill was whether sellers could gain traction within Monday’s lower distribution, opening the door to negating the trend day. The Smashlevel at 6980 was the key reference to help gauge the auction. A look-below-and-fail of 6980 unfolded during the European hours, triggering a reversal heading into the RTH session.
The RTH session kicked off by printing a new all-time high in the A-period after breaching UT1 at 6994. Price exploration above 6994 was brief before a reversal unfolded. The market then rotated lower to test the Smashlevel at 6980, where buyers were unsurprisingly waiting. The defense of 6980 ultimately led to a solid upside move of roughly 25 handles, which stalled a couple of handles shy of UT2 at 7009 (HOD: 7006.75). Did you notice the heavy aggressive selling activity around this area? It was a clear order flow signal to at least partially book profits (see Figure 1).
From there, it was crucial for buyers to hold the prior ATH at 6994; failure to do so would put a potential failed breakout in play—always a scenario of interest when an excess high has formed. Today’s high printed 7 ticks of excess. Buyers ultimately failed to hold 6994, which was then re-offered from below, triggering weakness during the afternoon session. Note that the 5D VPOC (short-term value) shifted higher today, from 6951 to 6989, while the market closed at its session lows.
The key question now is whether value will follow price, or if price will ultimately return within today’s value area. We don’t know what will happen, which is why we use levels to help gauge the auction and provide clues about what is more likely to occur.
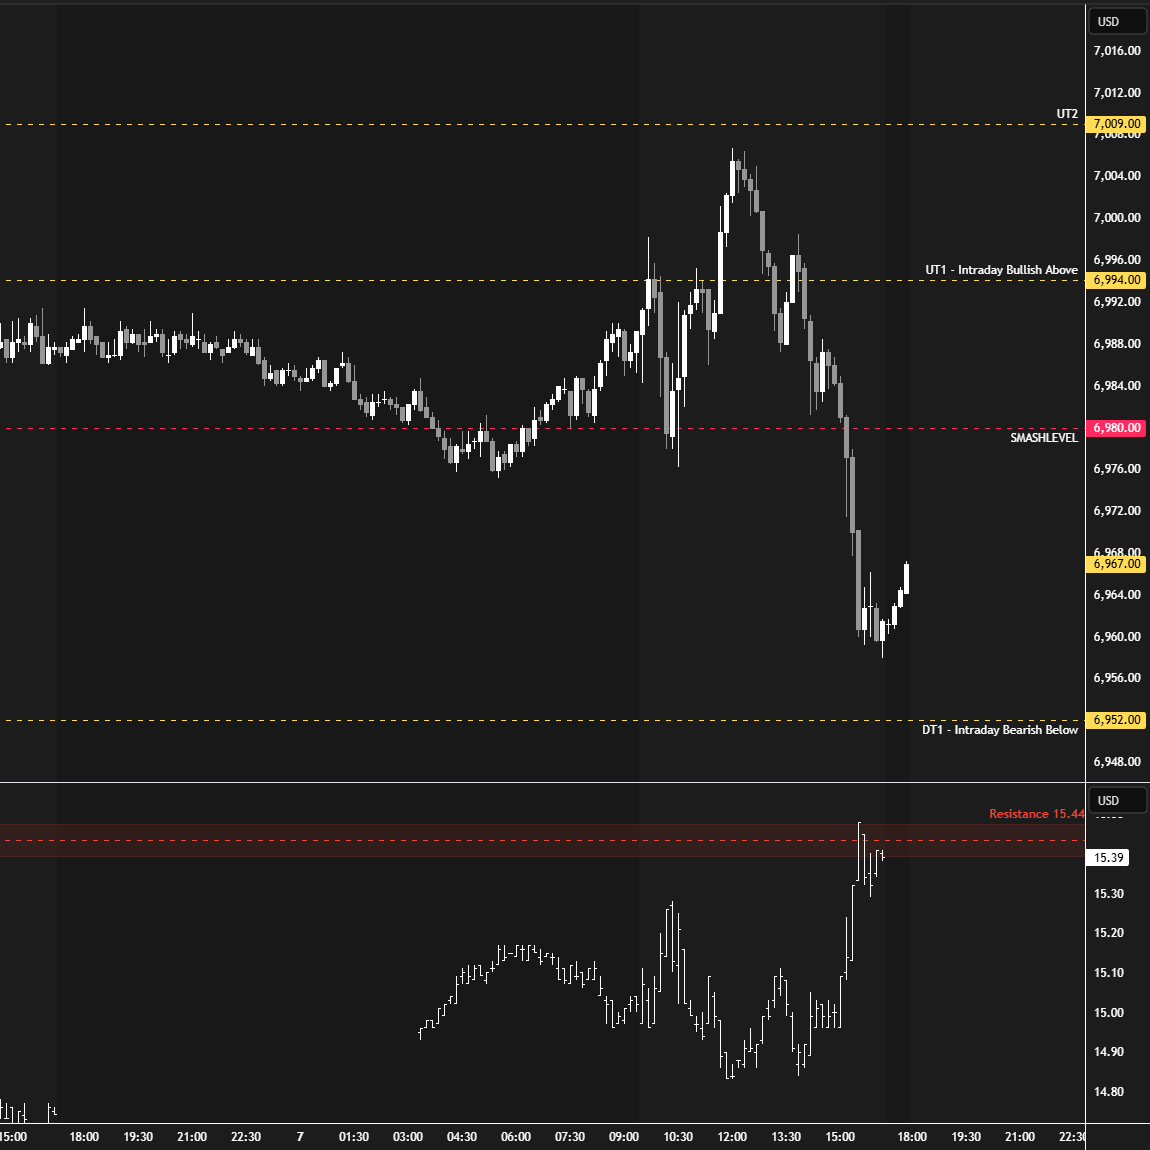
Today’s session printed a new ATH at 7006.75, formed an excess high, and subsequently failed to hold above the prior ATH of 6994—ultimately triggering weakness. However, the daily is one-time framing up, making short-term conditions a bit tricky. Stronger sellers will not allow acceptance back into today’s upper distribution, essentially meaning a move back above Tuesday’s lower distribution. This makes today’s breakdown single prints at 6976 crucial to monitor in the short term.
In terms of levels, the Smashlevel is 6976—today’s breakdown single prints. Holding below 6976 would target the previous ATH at 6952 (DT1). Acceptance below 6952 would signal weakness, targeting 6934 (DT2), with a final downside target at 6909 (FDT) under sustained selling pressure.
On the flip side, reclaiming and holding above 6976 would shift focus to the prior ATH at 6994 (UT1), with a final upside target at 7018 (FUT)—the 100% IB Extension—under sustained buying pressure.
Levels of Interest
Going into tomorrow’s session, I’ll closely observe the behavior around 6976.
Break and hold above 6976 would target 6994 / 7018
Holding below 6976 would target 6952 / 6934 / 6909
Additionally, pay attention to the following VIX levels: 16.14 and 14.62. These levels can provide confirmation of strength or weakness.
Break and hold above 7018 with VIX below 14.62 would confirm strength.
Break and hold below 6909 with VIX above 16.14 would confirm weakness.
Overall, it's important to exercise caution when trading outside of the highlighted yellow levels. A non-cooperative VIX may suggest possible reversals i.e trade setups.
Smash, thanks for everything. I wanted to ask you, do you have any tolerance level for the levels? For example, do you expect it to be at least a certain number of ticks away to be considered valid for the level? Thanks!
Thanks Smash!