
ES Daily Plan | February 9, 2026
Market Context & Key Levels for the Day Ahead

— For new subscribers
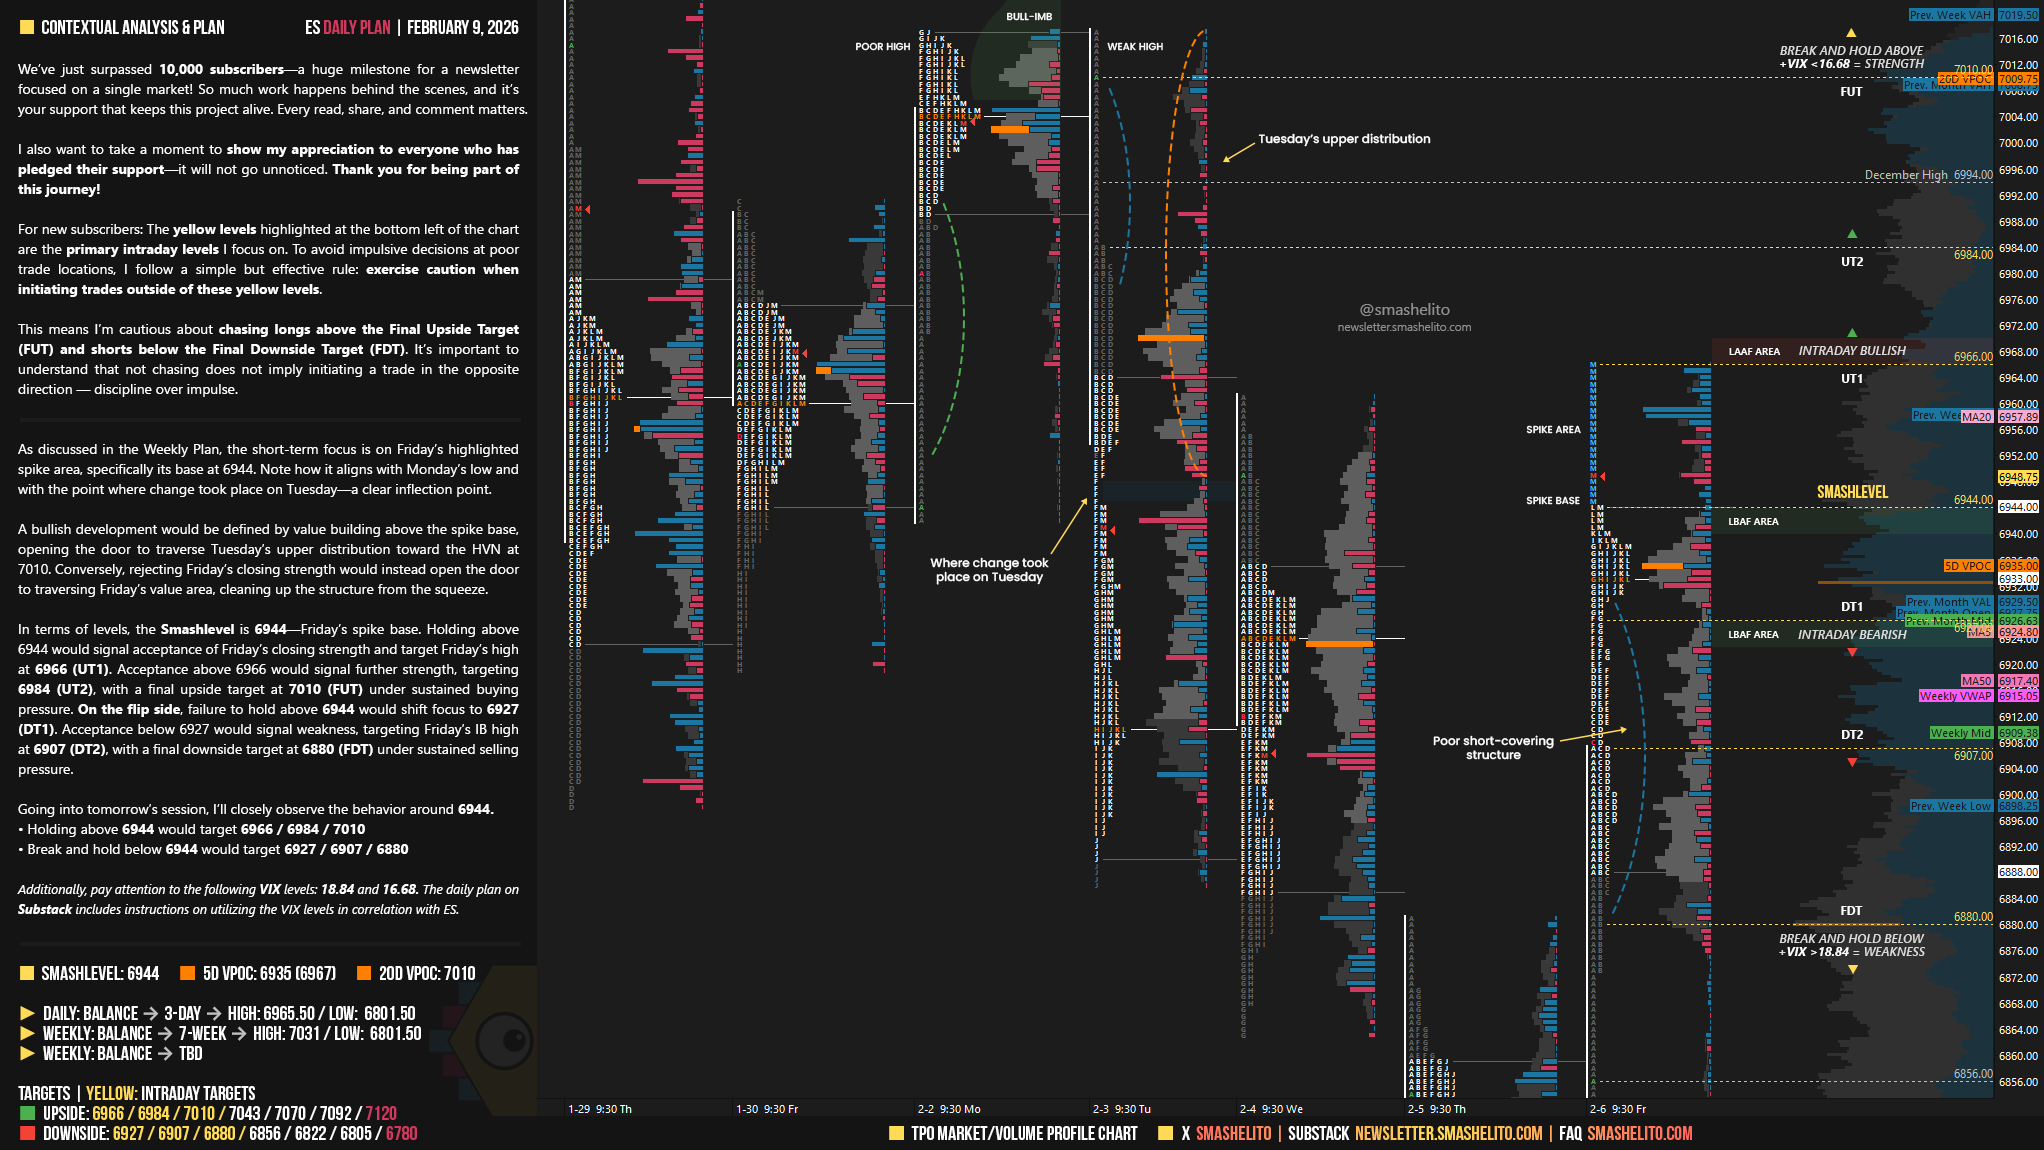
The yellow levels highlighted at the bottom left of the chart are the primary intraday levels I focus on. To avoid impulsive decisions at poor trade locations, I follow a simple but effective rule: exercise caution when initiating trades outside of these yellow levels.
This means I’m cautious about chasing longs above the Final Upside Target (FUT) and shorts below the Final Downside Target (FDT). It’s important to understand that not chasing does not imply initiating a trade in the opposite direction — discipline over impulse.
Be sure to review the Weekly Plan for a broader perspective, key levels, and market expectations for the week ahead.

10,000+ Subscribers
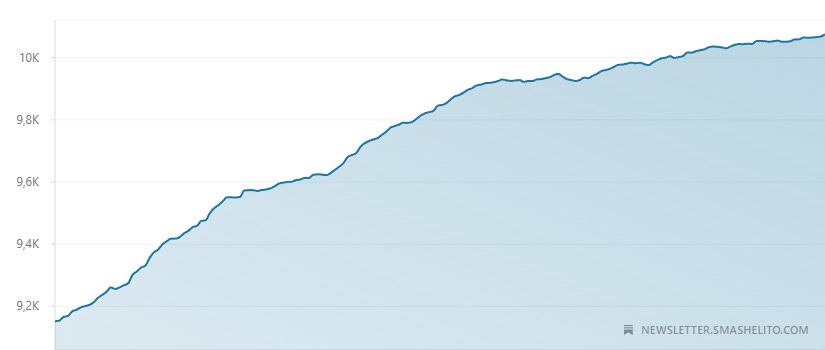
We’ve just surpassed 10,000 subscribers—a huge milestone for a newsletter focused on a single market! So much work happens behind the scenes, and it’s your support that keeps this project alive. Every read, share, and comment matters.
I also want to take a moment to show my appreciation to everyone who has pledged their support—it will not go unnoticed. Thank you for being part of this journey!
Contextual Analysis & Plan
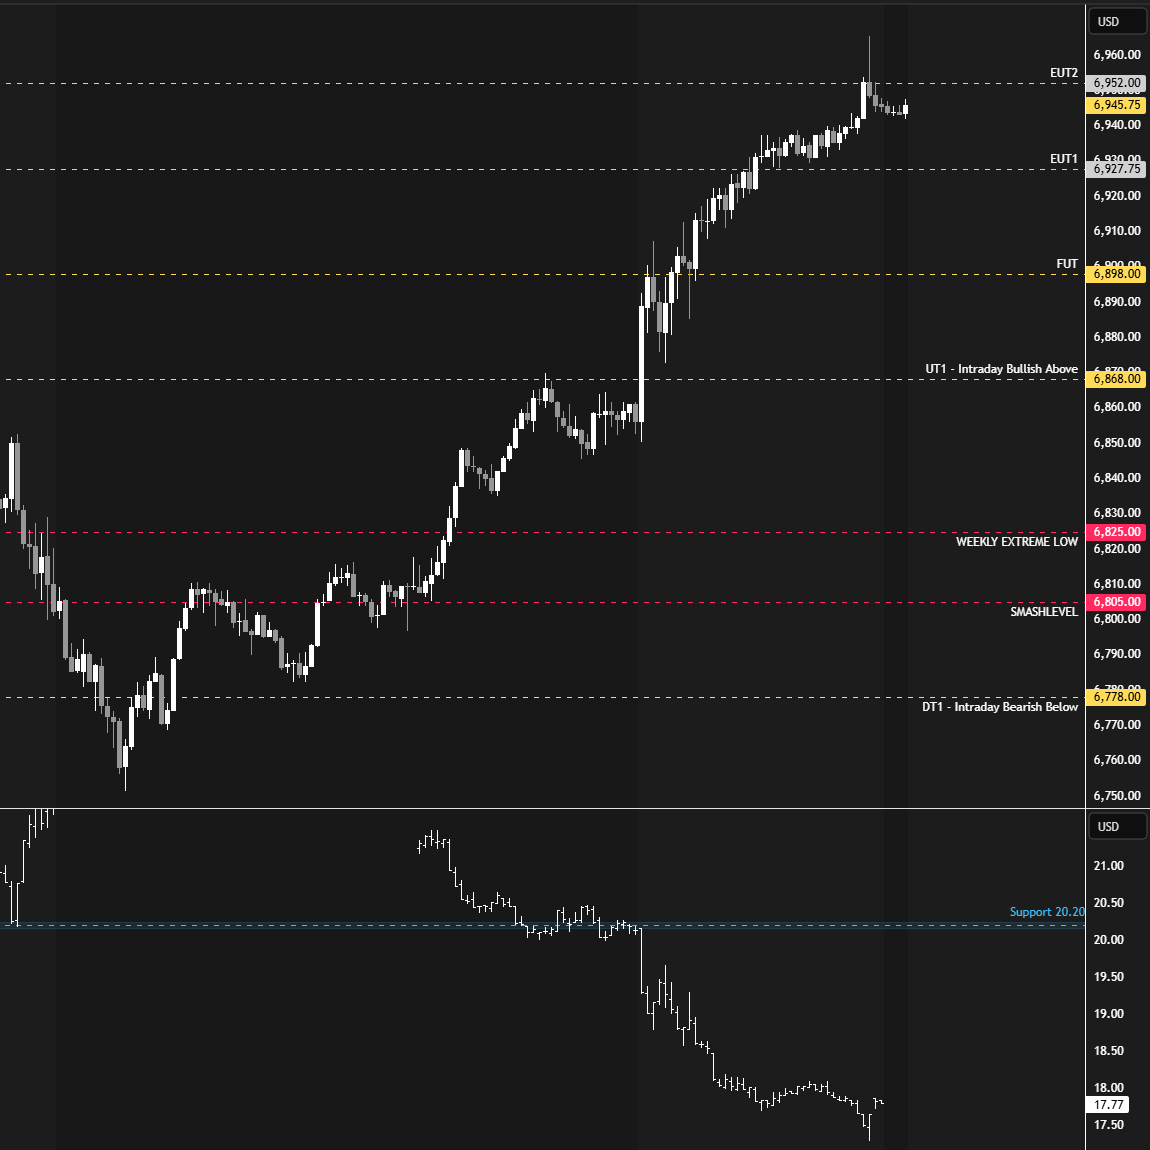
The key on Friday, as outlined in the session preparations, was to monitor whether sellers could hold below the previous month’s low at 6822, as failure to do so could trigger a short-covering rally. Sellers ultimately failed to hold below 6822, resulting in a significant squeeze that closed 150 handles above Thursday’s LOD. It was also noted that such a squeeze would likely require the VIX to move below 20—a scenario that played out immediately during the RTH session (see Figure 1).
As discussed in the Weekly Plan, the short-term focus is on Friday’s highlighted spike area, specifically its base at 6944. Note how it aligns with Monday’s low and with the point where change took place on Tuesday—a clear inflection point.
A bullish development would be defined by value building above the spike base, opening the door to traverse Tuesday’s upper distribution toward the HVN at 7010. Conversely, rejecting Friday’s closing strength would instead open the door to traversing Friday’s value area, cleaning up the structure from the squeeze.
In terms of levels, the Smashlevel is 6944—Friday’s spike base. Holding above 6944 would signal acceptance of Friday’s closing strength and target Friday’s high at 6966 (UT1). Acceptance above 6966 would signal further strength, targeting 6984 (UT2), with a final upside target at 7010 (FUT) under sustained buying pressure.
On the flip side, failure to hold above 6944 would shift focus to 6927 (DT1). Acceptance below 6927 would signal weakness, targeting Friday’s IB high at 6907 (DT2), with a final downside target at 6880 (FDT) under sustained selling pressure.
Levels of Interest
Going into tomorrow’s session, I’ll closely observe the behavior around 6944.
Holding above 6944 would target 6966 / 6984 / 7010
Break and hold below 6944 would target 6927 / 6907 / 6880
Additionally, pay attention to the following VIX levels: 18.84 and 16.68. These levels can provide confirmation of strength or weakness.
Break and hold above 7010 with VIX below 16.68 would confirm strength.
Break and hold below 6880 with VIX above 18.84 would confirm weakness.
Overall, it's important to exercise caution when trading outside of the highlighted yellow levels. A non-cooperative VIX may suggest possible reversals i.e trade setups.
Way to go on the 10k subscribers Smash, well deserved!! 👌🏻
What a great start to the week to learn that you reached this milestone in your newsletter! You truly deserve many more, and I'm sure they will come. You are a wonderful mentor, and I am deeply grateful that you allow me to be part of this enriching journey. Your knowledge is invaluable, and having access to it is a true privilege. May life continue to shower you with blessings, good health, and abundance for you and all your loved ones.