
ES Daily Plan | February 6, 2026
Market Context & Key Levels for the Day Ahead

— For new subscribers
The yellow levels highlighted at the bottom left of the chart are the primary intraday levels I focus on. To avoid impulsive decisions at poor trade locations, I follow a simple but effective rule: exercise caution when initiating trades outside of these yellow levels.
This means I’m cautious about chasing longs above the Final Upside Target (FUT) and shorts below the Final Downside Target (FDT). It’s important to understand that not chasing does not imply initiating a trade in the opposite direction — discipline over impulse.
Be sure to review the Weekly Plan for a broader perspective, key levels, and market expectations for the week ahead.

Contextual Analysis & Plan
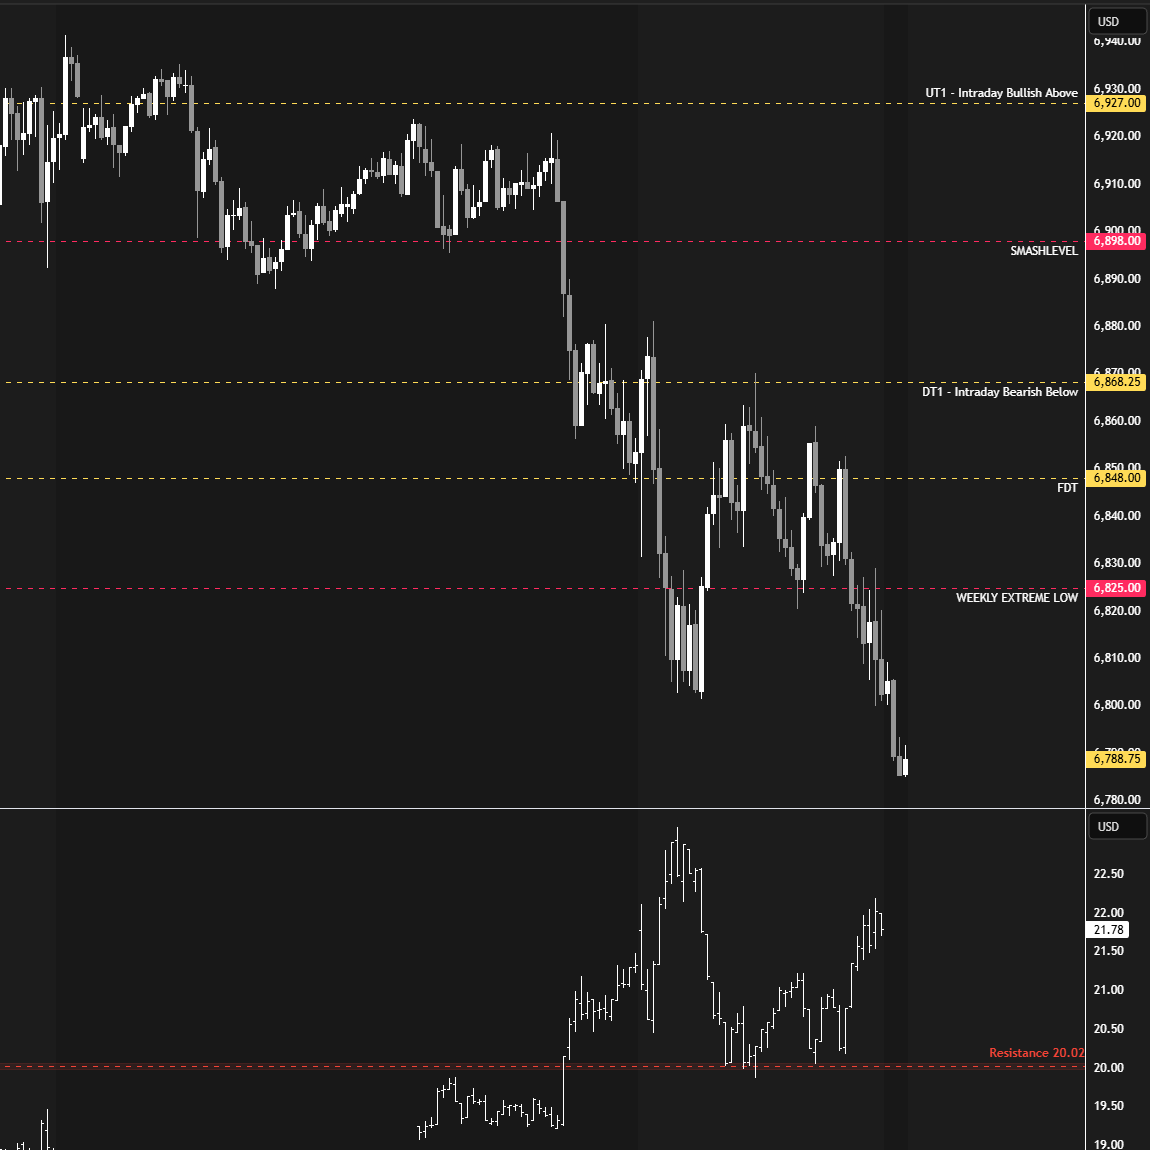
Quick update today to get the levels out as fast as possible. As discussed in the previous plan, the short-term levels of interest were 6927, marking the 2026 opening price, and last week’s low at 6898. Value was established overnight between these levels following failed attempts to gain acceptance outside the 6927–6898 range.
Change took place two hours ahead of the RTH open, when initiating sellers decisively took out the 6898 level, resulting in a liquidation that cleared all intraday downside targets toward the FDT at 6848. This sequence was accompanied by the VIX breaching its resistance at 20.02. The VIX has breached its resistance repeatedly over the past few sessions, which is notable. The key during the RTH session, which opened outside of Wednesday’s range on a true gap down, was whether buyers could find acceptance back within Wednesday’s range. Failure to do so would confirm that the overnight bearish move was accepted. Buyers ultimately failed to gain traction back within Wednesday’s range and to hold above UT1 at 6868—an intraday bearish confirmation that led to additional weakness. Notably, during all bounce attempts today, the VIX held above its resistance, including during the mid-day 60-handle reversal, which was notable.
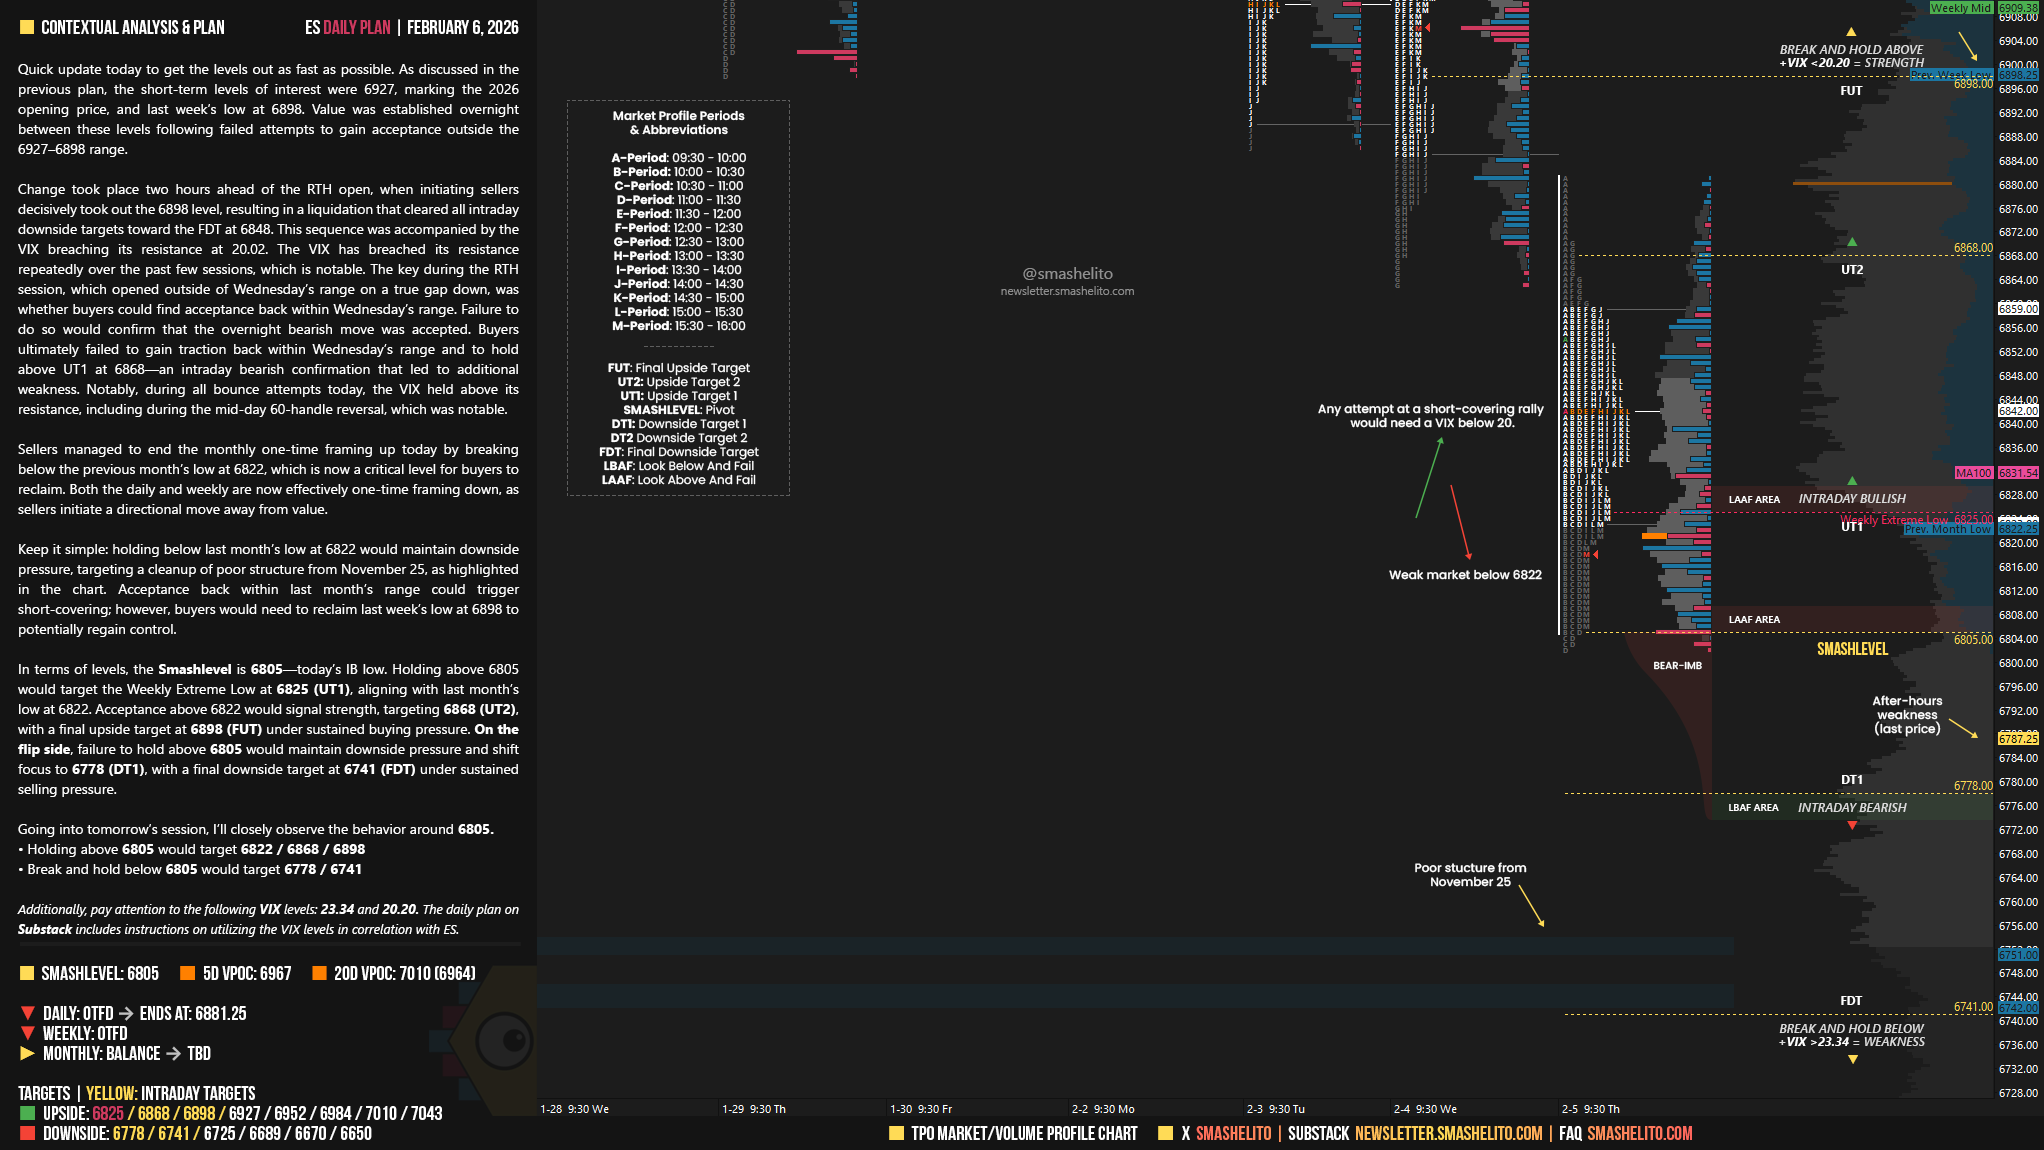
Sellers managed to end the monthly one-time framing up today by breaking below the previous month’s low at 6822, which is now a critical level for buyers to reclaim. Both the daily and weekly are now effectively one-time framing down, as sellers initiate a directional move away from value.
Keep it simple: holding below last month’s low at 6822 would maintain downside pressure, targeting a cleanup of poor structure from November 25, as highlighted in the chart. Acceptance back within last month’s range could trigger short-covering; however, buyers would need to reclaim last week’s low at 6898 to potentially regain control.
In terms of levels, the Smashlevel is 6805—today’s IB low. Holding above 6805 would target the Weekly Extreme Low at 6825 (UT1), aligning with last month’s low at 6822. Acceptance above 6822 would signal strength, targeting 6868 (UT2), with a final upside target at 6898 (FUT) under sustained buying pressure.
On the flip side, failure to hold above 6805 would maintain downside pressure and shift focus to 6778 (DT1), with a final downside target at 6741 (FDT) under sustained selling pressure.
Levels of Interest
Going into tomorrow’s session, I’ll closely observe the behavior around 6805.
Holding above 6805 would target 6822 / 6868 / 6898
Break and hold below 6805 would target 6778 / 6741
Additionally, pay attention to the following VIX levels: 23.34 and 20.20. These levels can provide confirmation of strength or weakness.
Break and hold above 6898 with VIX below 20.20 would confirm strength.
Break and hold below 6741 with VIX above 23.34 would confirm weakness.
Overall, it's important to exercise caution when trading outside of the highlighted yellow levels. A non-cooperative VIX may suggest possible reversals i.e trade setups.
Best daily analysis on the Internet, period. I feel guilty getting all this hard work for free. Thanks always!
Thanks Smash! Let's see if sellers can hold below the weekly extreme.