
ES Daily Plan | April 16, 2026
Market Context & Key Levels for the Day Ahead

— For new subscribers
The yellow levels highlighted at the bottom left of the chart are the primary intraday levels I focus on. To avoid impulsive decisions at poor trade locations, I follow a simple but effective rule: exercise caution when initiating trades outside of these yellow levels.
This means I’m cautious about chasing longs above the Final Upside Target (FUT) and shorts below the Final Downside Target (FDT). It’s important to understand that not chasing does not imply initiating a trade in the opposite direction, discipline over impulse.
Be sure to review the Weekly Plan for a broader perspective, key levels, and market expectations for the week ahead.

Contextual Analysis & Plan
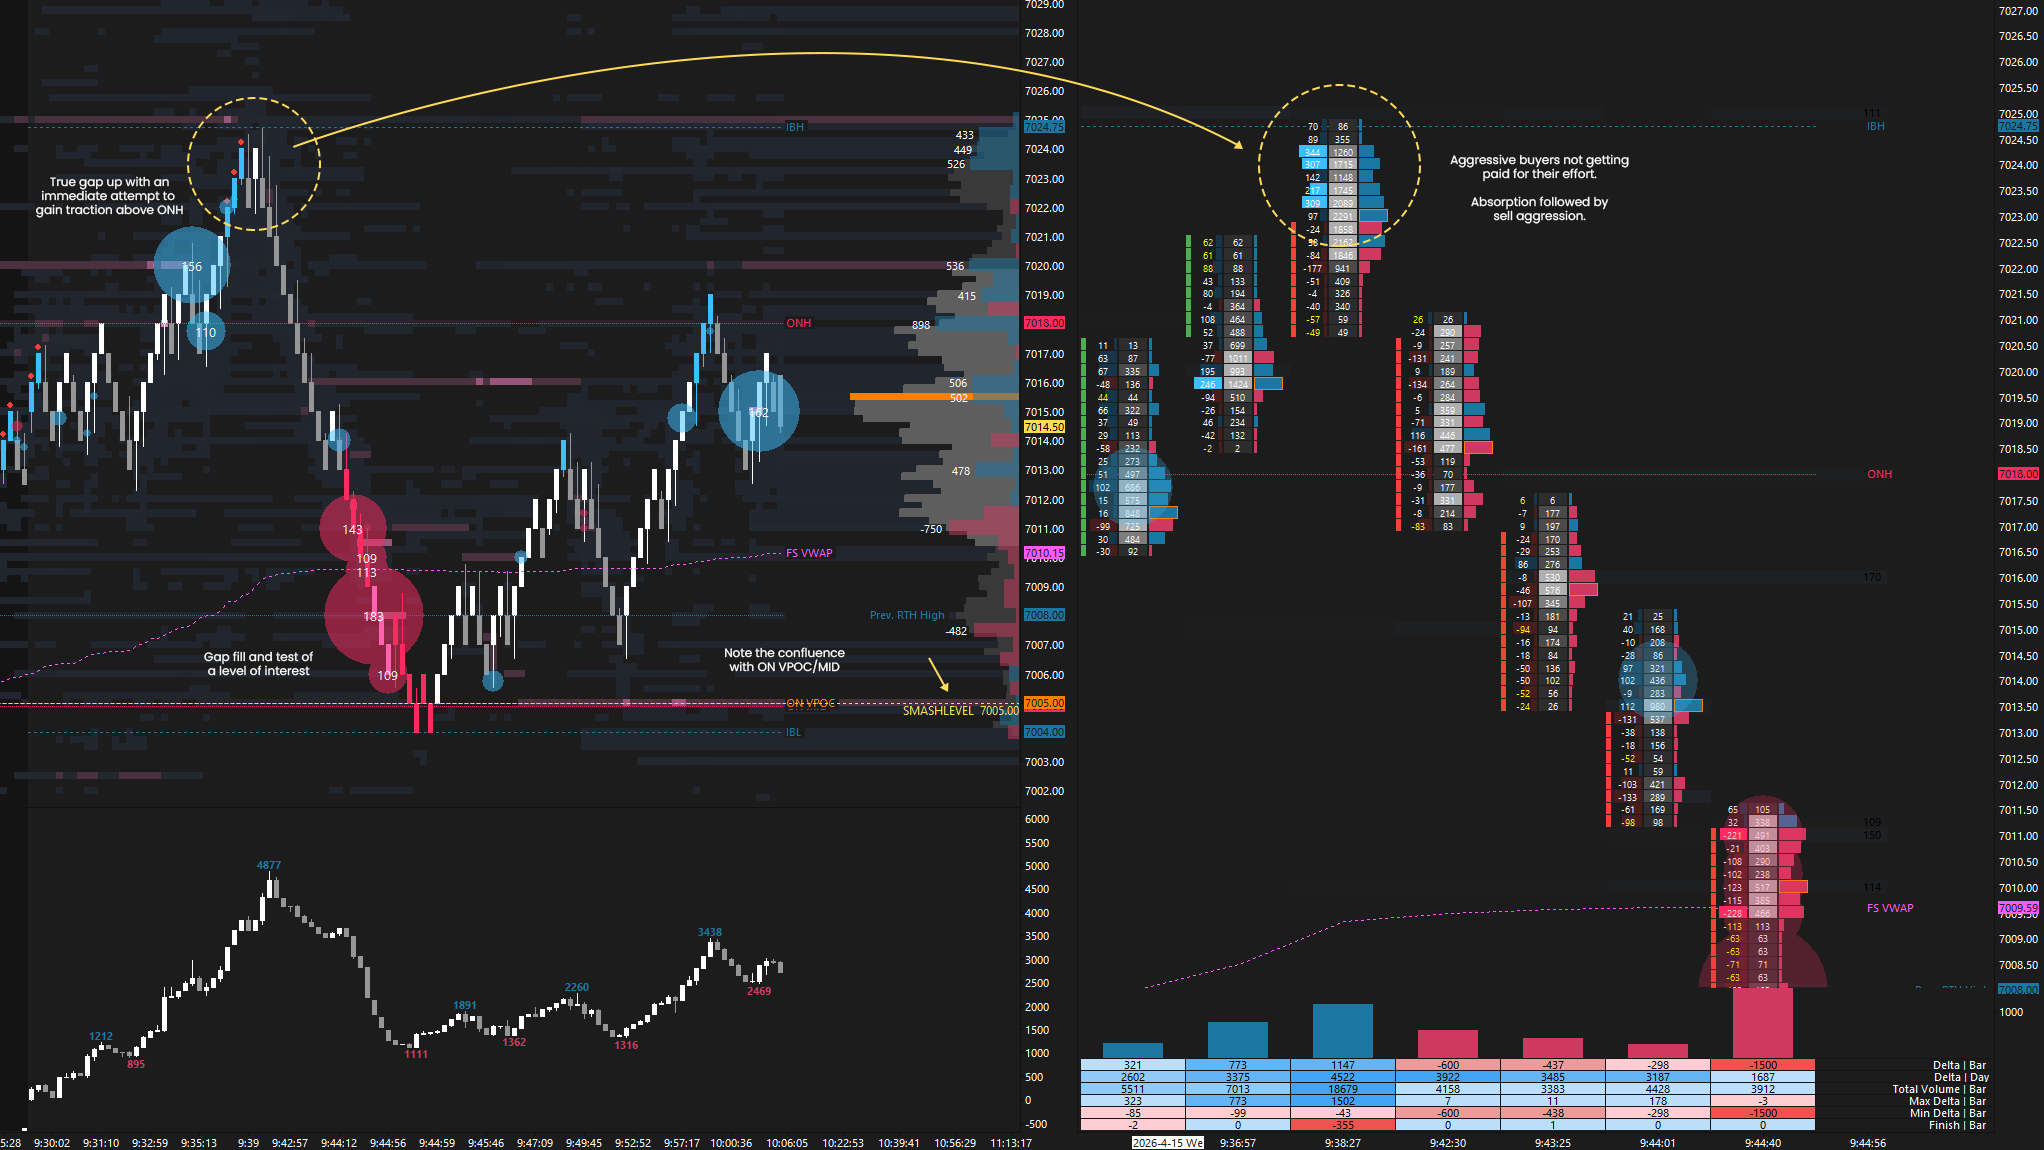
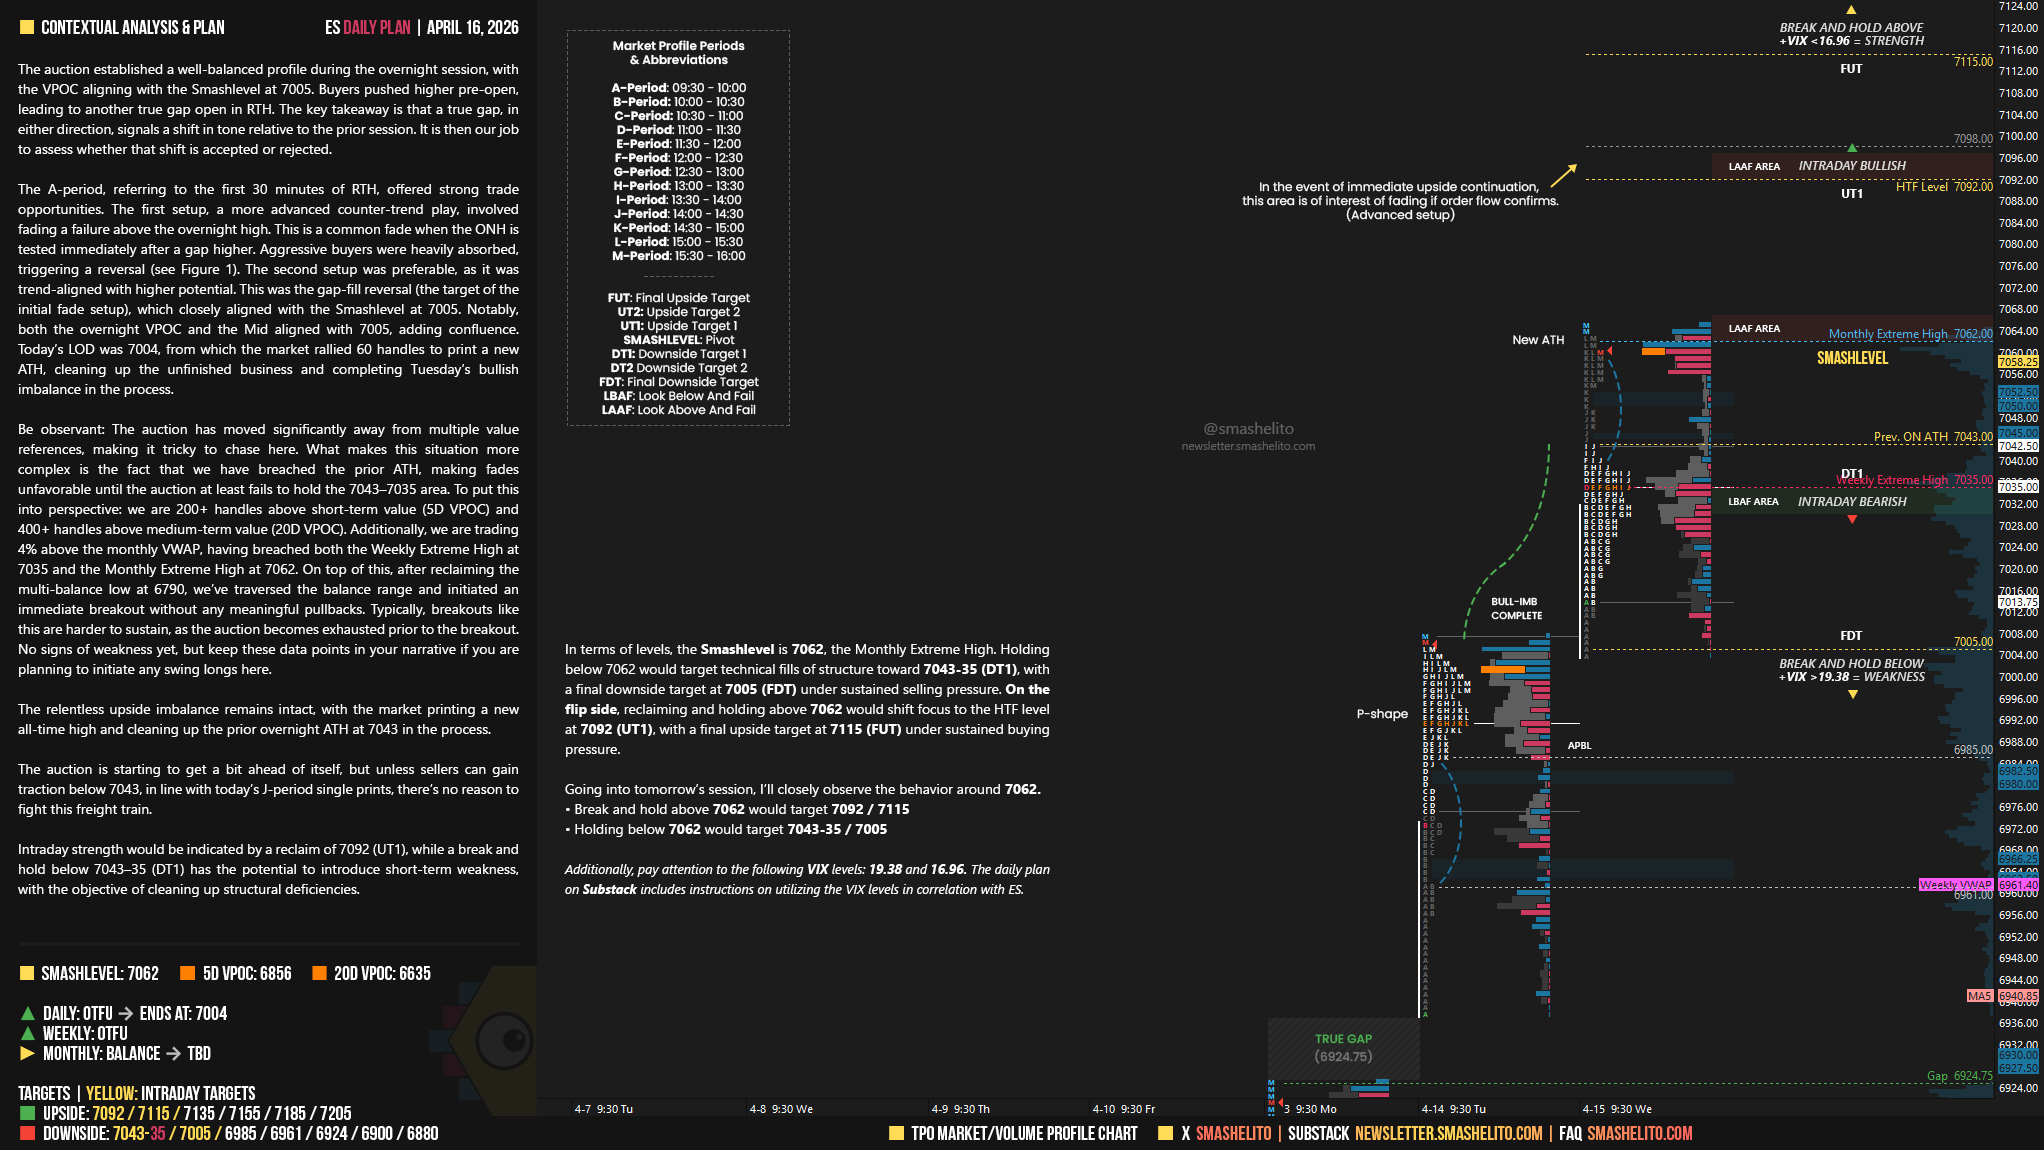
The auction established a well-balanced profile during the overnight session, with the VPOC aligning with the Smashlevel at 7005. Buyers pushed higher pre-open, leading to another true gap open in RTH. The key takeaway is that a true gap, in either direction, signals a shift in tone relative to the prior session. It is then our job to assess whether that shift is accepted or rejected.
The A-period, referring to the first 30 minutes of RTH, offered strong trade opportunities. The first setup, a more advanced counter-trend play, involved fading a failure above the overnight high. This is a common fade when the ONH is tested immediately after a gap higher. Aggressive buyers were heavily absorbed, triggering a reversal (see Figure 1). The second setup was preferable, as it was trend-aligned with higher potential. This was the gap-fill reversal (the target of the initial fade setup), which closely aligned with the Smashlevel at 7005. Notably, both the overnight VPOC and the Mid aligned with 7005, adding confluence. Today’s LOD was 7004, from which the market rallied 60 handles to print a new ATH, cleaning up the unfinished business and completing Tuesday’s bullish imbalance in the process.
Be observant: The auction has moved significantly away from multiple value references, making it tricky to chase here. What makes this situation more complex is the fact that we have breached the prior ATH, making fades unfavorable until the auction at least fails to hold the 7043–7035 area. To put this into perspective: we are 200+ handles above short-term value (5D VPOC) and 400+ handles above medium-term value (20D VPOC). Additionally, we are trading 4% above the monthly VWAP, having breached both the Weekly Extreme High at 7035 and the Monthly Extreme High at 7062. On top of this, after reclaiming the multi-balance low at 6790, we’ve traversed the balance range and initiated an immediate breakout without any meaningful pullbacks. Typically, breakouts like this are harder to sustain, as the auction becomes exhausted prior to the breakout. No signs of weakness yet, but keep these data points in your narrative if you are planning to initiate any swing longs here.
As always, markets don’t become “overbought” or “oversold.” I would not get involved with these terms. It’s all about whether prices are accepted or rejected. As long as higher prices are accepted, the market can keep moving upward.
Smashlevels Recap
The relentless upside imbalance remains intact, with the market printing a new all-time high and cleaning up the prior overnight ATH at 7043 in the process.
The auction is starting to get a bit ahead of itself, but unless sellers can gain traction below 7043, in line with today’s J-period single prints, there’s no reason to fight this freight train.
Intraday strength would be indicated by a reclaim of 7092 (UT1), while a break and hold below 7043–35 (DT1) has the potential to introduce short-term weakness, with the objective of cleaning up structural deficiencies.
In terms of levels, the Smashlevel is 7062, the Monthly Extreme High. Holding below 7062 would target technical fills of structure toward 7043-35 (DT1), with a final downside target at 7005 (FDT) under sustained selling pressure.
On the flip side, reclaiming and holding above 7062 would shift focus to the HTF level at 7092 (UT1), with a final upside target at 7115 (FUT) under sustained buying pressure.
Visual Representation
Levels of Interest
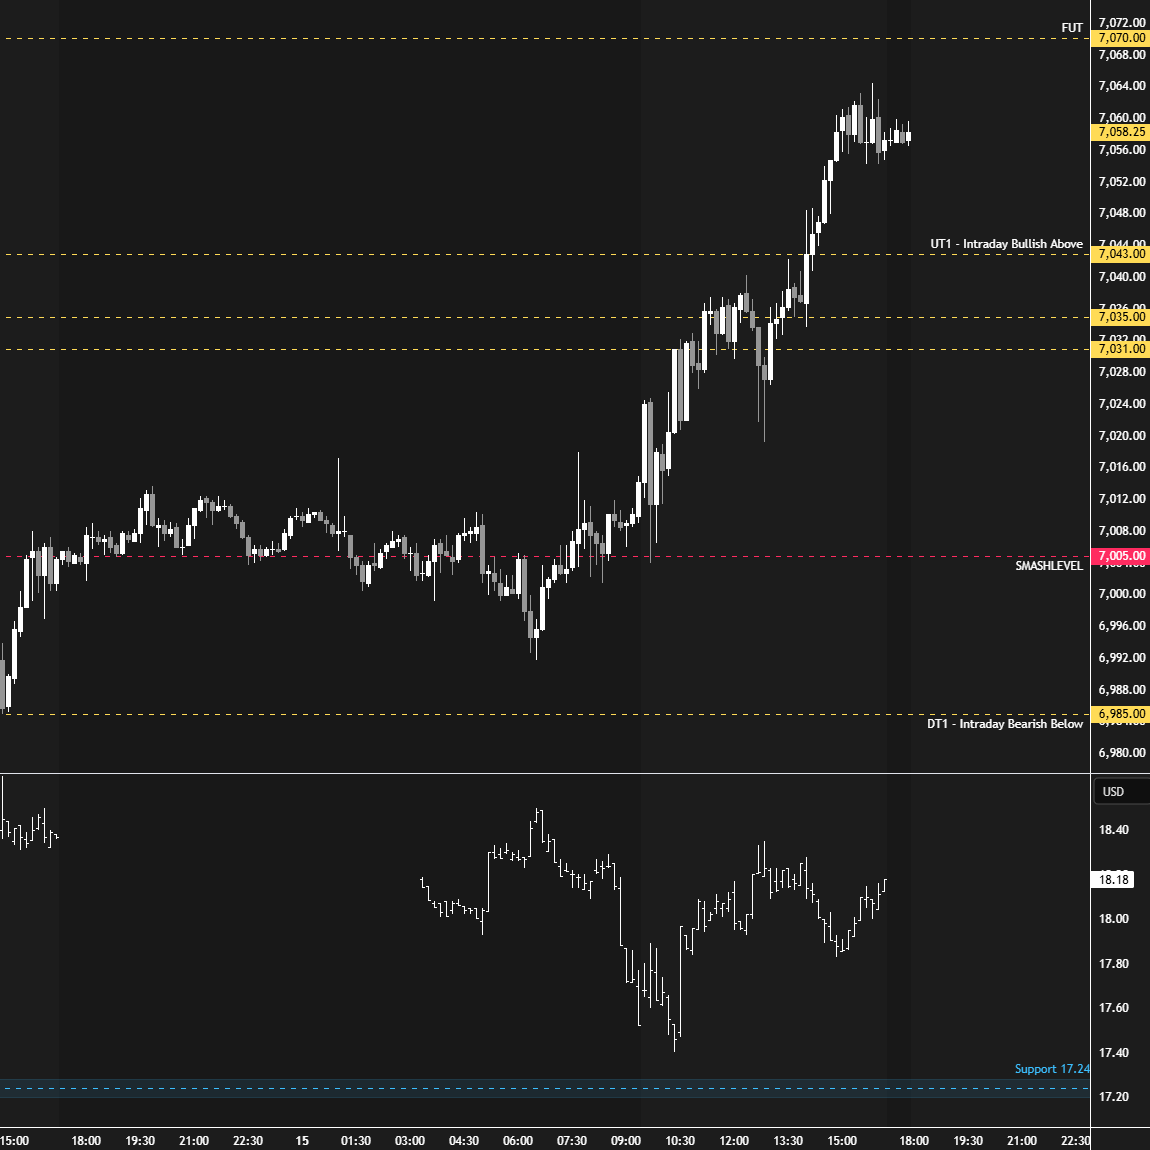
Going into tomorrow’s session, I’ll closely observe the behavior around 7062.
Break and hold above 7062 would target 7092 / 7115
Holding below 7062 would target 7043-35 / 7005
Additionally, pay attention to the following VIX levels: 19.38 and 16.96. These levels can provide confirmation of strength or weakness.
Break and hold above 7115 with VIX below 16.96 would confirm strength.
Break and hold below 7005 with VIX above 19.38 would confirm weakness.
Overall, it's important to exercise caution when trading outside of the highlighted yellow levels. A non-cooperative VIX may suggest possible reversals i.e trade setups.
When is the last time we exceeded the weekly extreme high two weeks in a row ?
Thanks Smash. What do you mean by a “reclaim” of 7092? Are you referring to back adjusted ATH?