
ES Weekly Plan | September 22-26, 2025
Recap, Market Context & Key Levels for the Week Ahead

Welcome to this week’s plan. Inside, you’ll find a quick review of last week’s price action, key economic events, market structure, context for the week ahead, and the levels I’ll be focusing on. Let’s get prepared.
Contents
Last Week in Review & Bonus Chart
Economic & Earnings Calendar
Market Structure
Contextual Analysis & Plan
Key Levels of Interest
Last Week in Review & Bonus Chart
Last week’s plan: ES Weekly Plan | September 15-19, 2025
Heading into last week, the main focus was to navigate the market with a cautious approach, given the lineup of key events such as FOMC, VIXperation, and quarterly OPEX. Additionally, contract rollover was taking place, adding further complexity. I typically scale back activity during rollover periods, as order flow tends to become noticeably less reliable. Still, the week offered some good opportunities, particularly Friday’s RTH session, which we will discuss in more detail below.
The market kicked off the week with a rather uneventful session on Monday, printing a narrow 18-handle range after holding the key level at 6645 overnight. As a reminder, I transitioned to the ESZ25 (December) contract on Monday. I do not back-adjust my charts, which is why there is a roll gap visible.
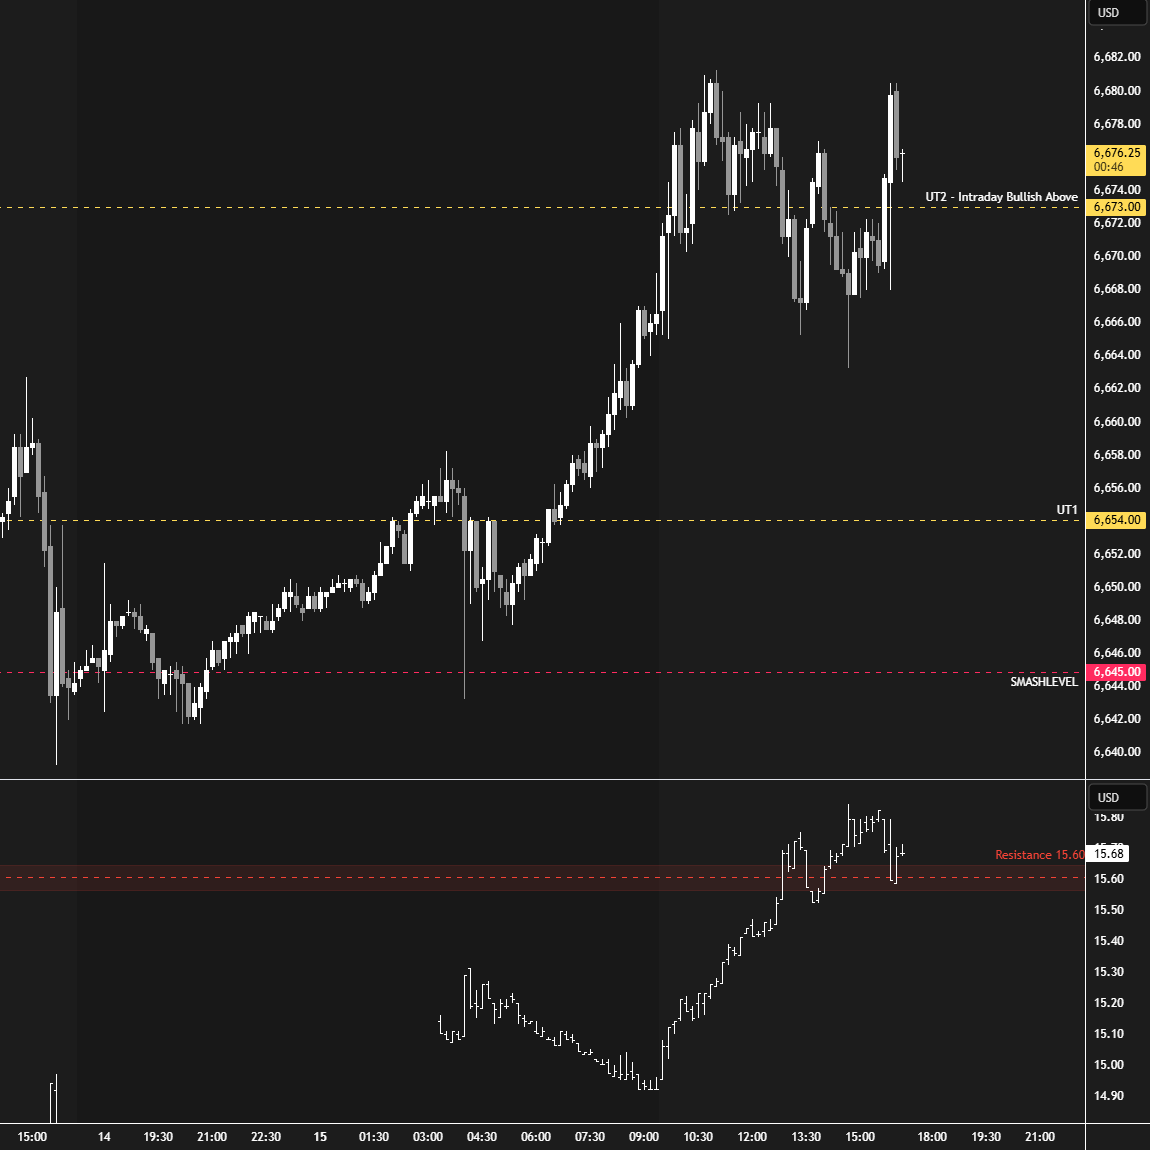
Tuesday saw another quiet session, with the market forming a 2-day balance ahead of Wednesday’s FOMC—the main event of the week, likely to dictate the next directional move. A new ATH was made overnight at 6697.75.
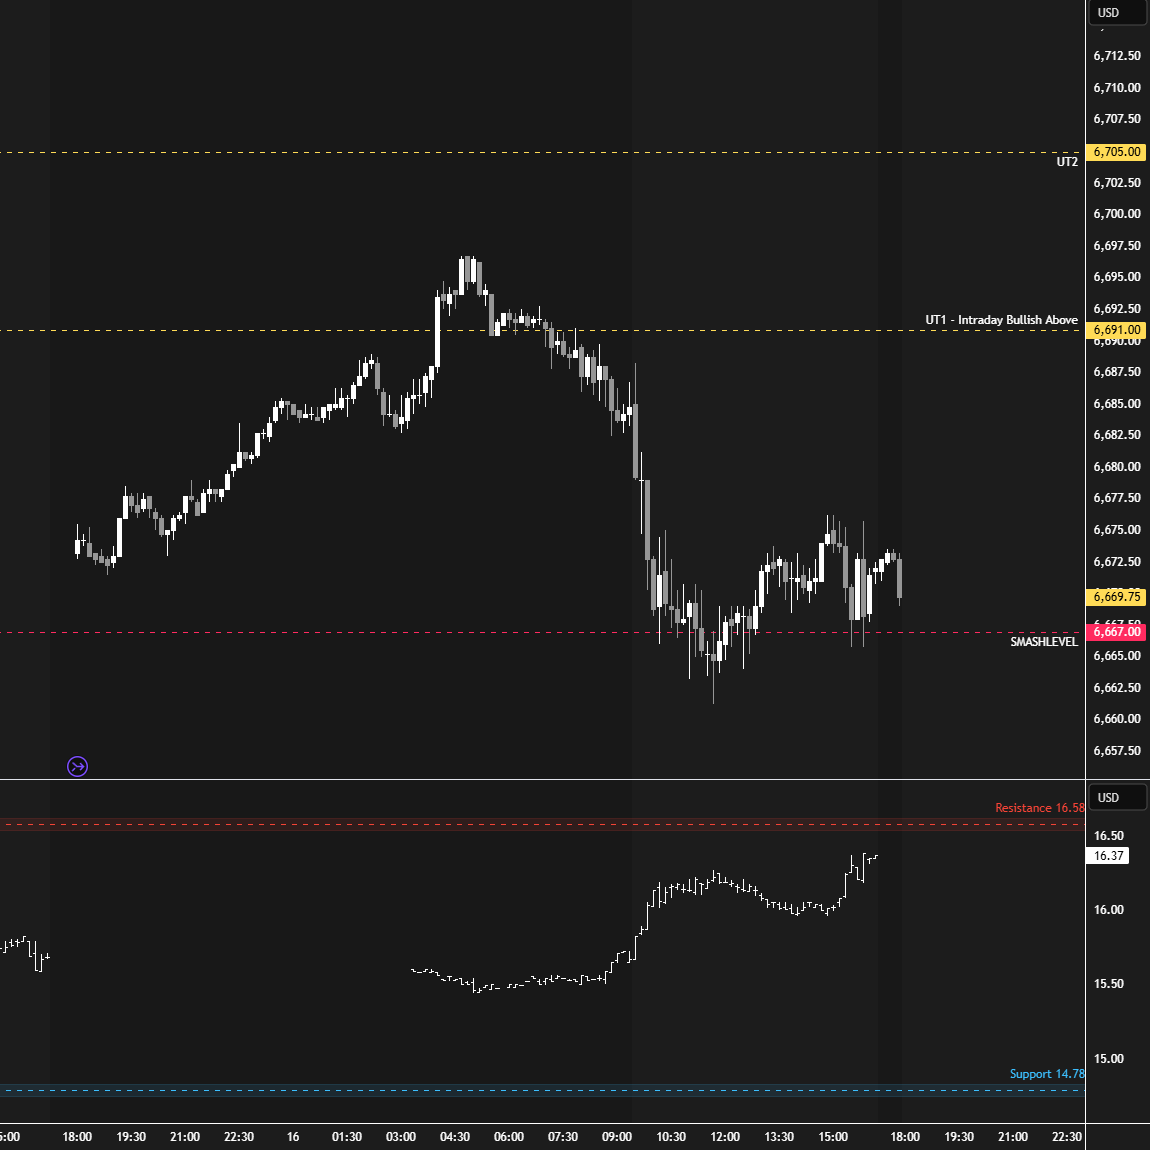
On Wednesday, sellers attempted a move lower post-FOMC, clearing all intraday downside targets in the process. However, a significant excess low was established, followed by price returning within Monday’s and Tuesday’s range.
The key heading into Thursday was whether buyers could reclaim 6681, which would open the door to cleaning up the unfinished business at the overnight ATH. Sellers, meanwhile, needed acceptance back below Wednesday’s halfback at 6649 to potentially trigger fills of the notable excess low.
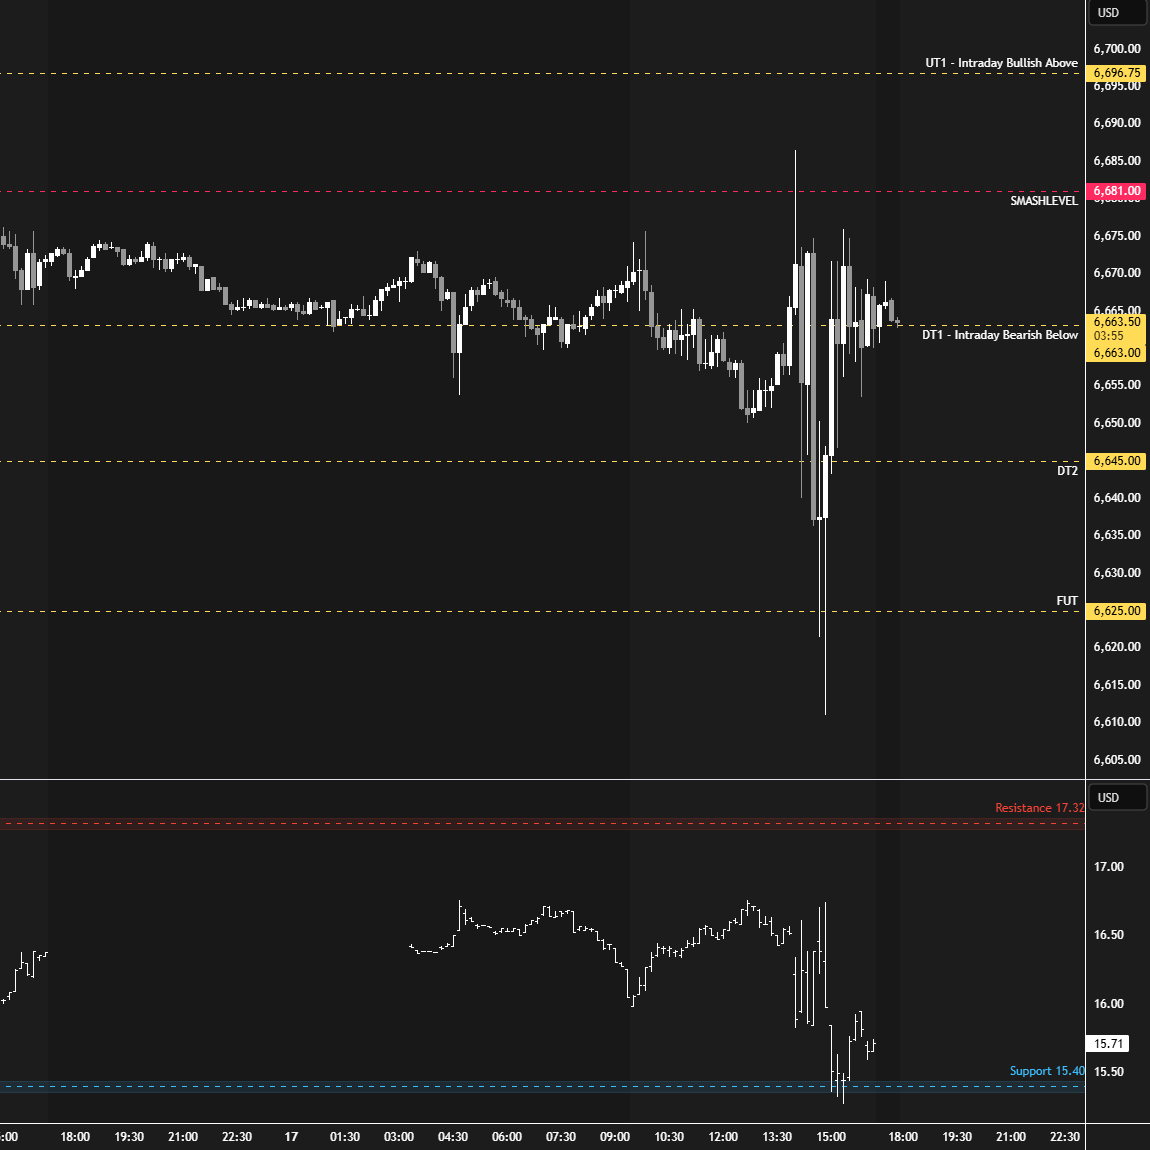
On Thursday, buyers reclaimed the 6681 level overnight, leading to a strong continuation higher—fueled by news headlines. In the process, all intraday upside targets were cleared, with the FUT at 6708 effectively capping upside momentum throughout the session. Another ON ATH printed at 6719.75.
The key takeaway on Thursday was that the market established value cleanly higher relative to the past few sessions, signaling strength.
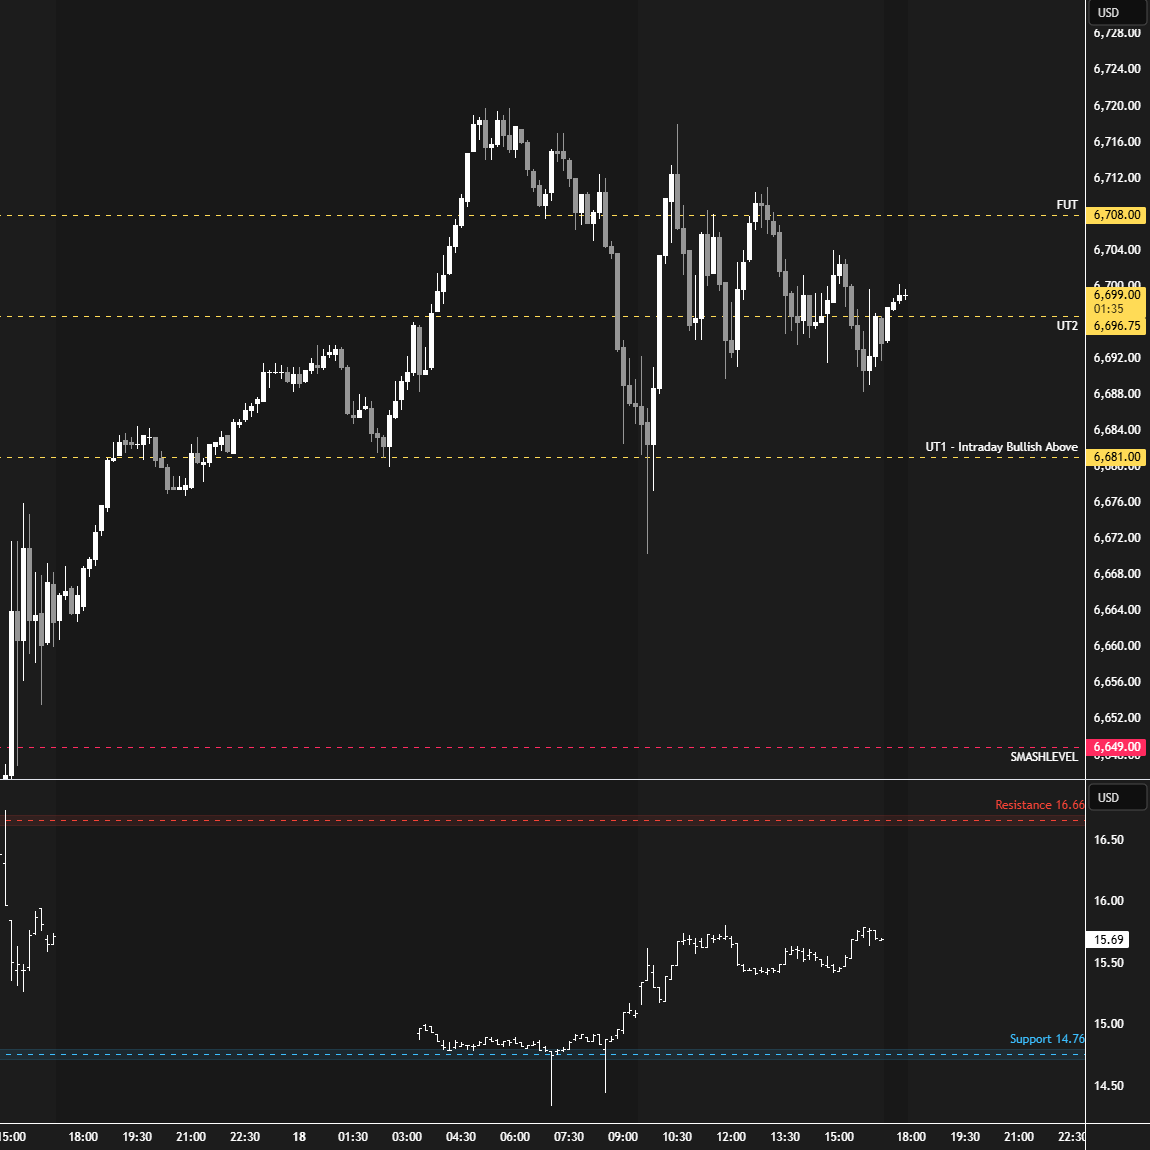
On Friday, the Smashlevel was 6687, marking Thursday’s opening level and the developing weekly value area high. A strong market would establish value above this level, continuing to build on Thursday’s session, which had established value cleanly higher.
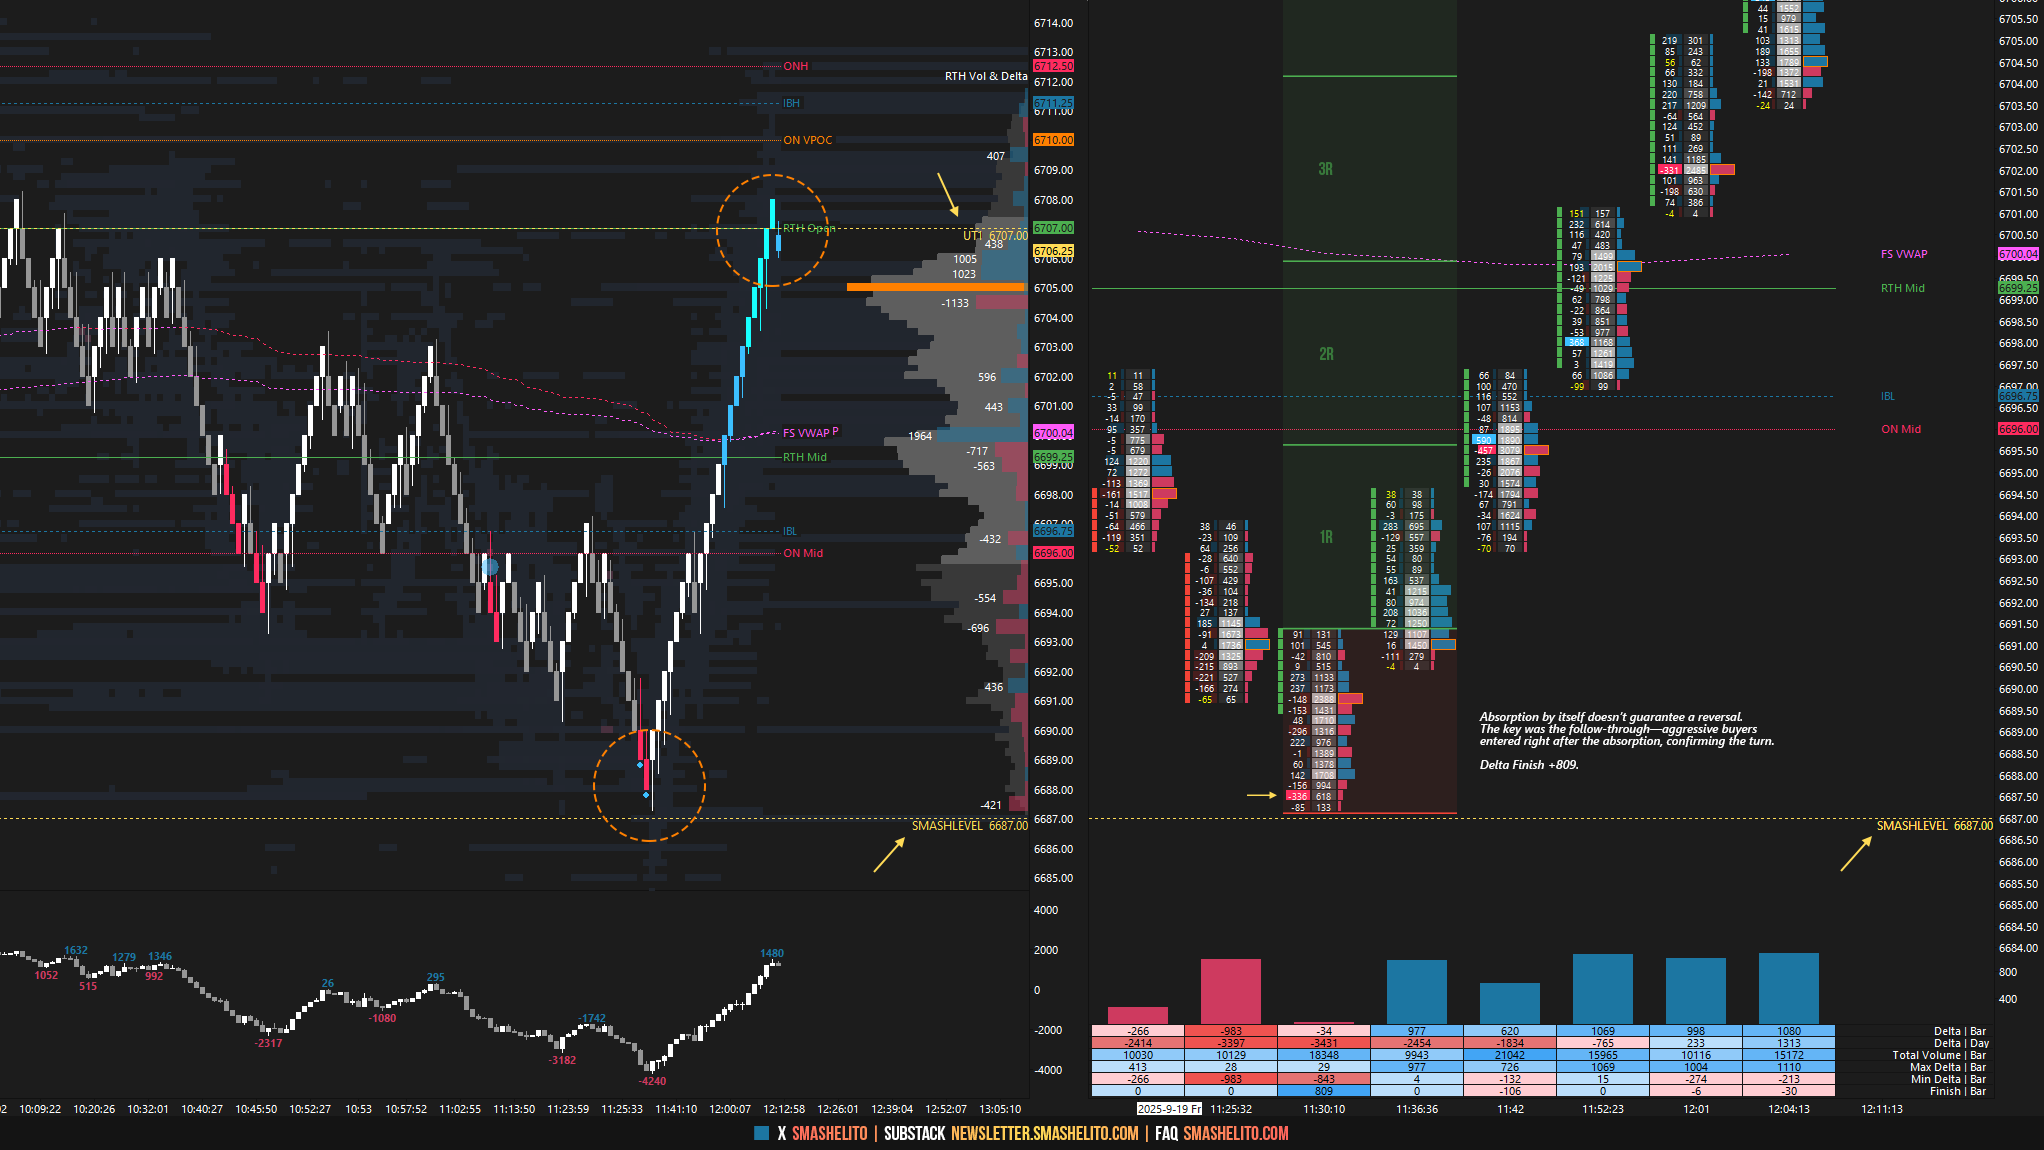
The 6687 level proved to be a significant reference, holding a quick spike below in the overnight session and then holding almost to the tick during the RTH session. The retest of 6687 during the RTH session was notable from an order flow perspective. Price showed signs of exhaustion approaching 6687, with aggressive sellers absorbed, followed by strong buying aggression. As a result, a significant reversal unfolded (see Figure 1).
This example illustrates my approach to the market: I begin with pre-open analysis, leveraging both market structure and volume profile to identify key levels of interest and potential areas of support and resistance. Once the session begins, the focus shifts to observing order flow activity around these levels—tracking how buyers and sellers interact, where absorption or exhaustion occurs, and where momentum can confirm or invalidate the pre-open analysis. If there is no meaningful order flow activity at a level, it is essentially meaningless, regardless of what the pre-open analysis suggested. While new levels can also be created dynamically during the session, this pre-open framework remains my primary approach. Combining pre-market structural insights with real-time order flow monitoring allows me to make more informed decisions and respond dynamically to market developments.
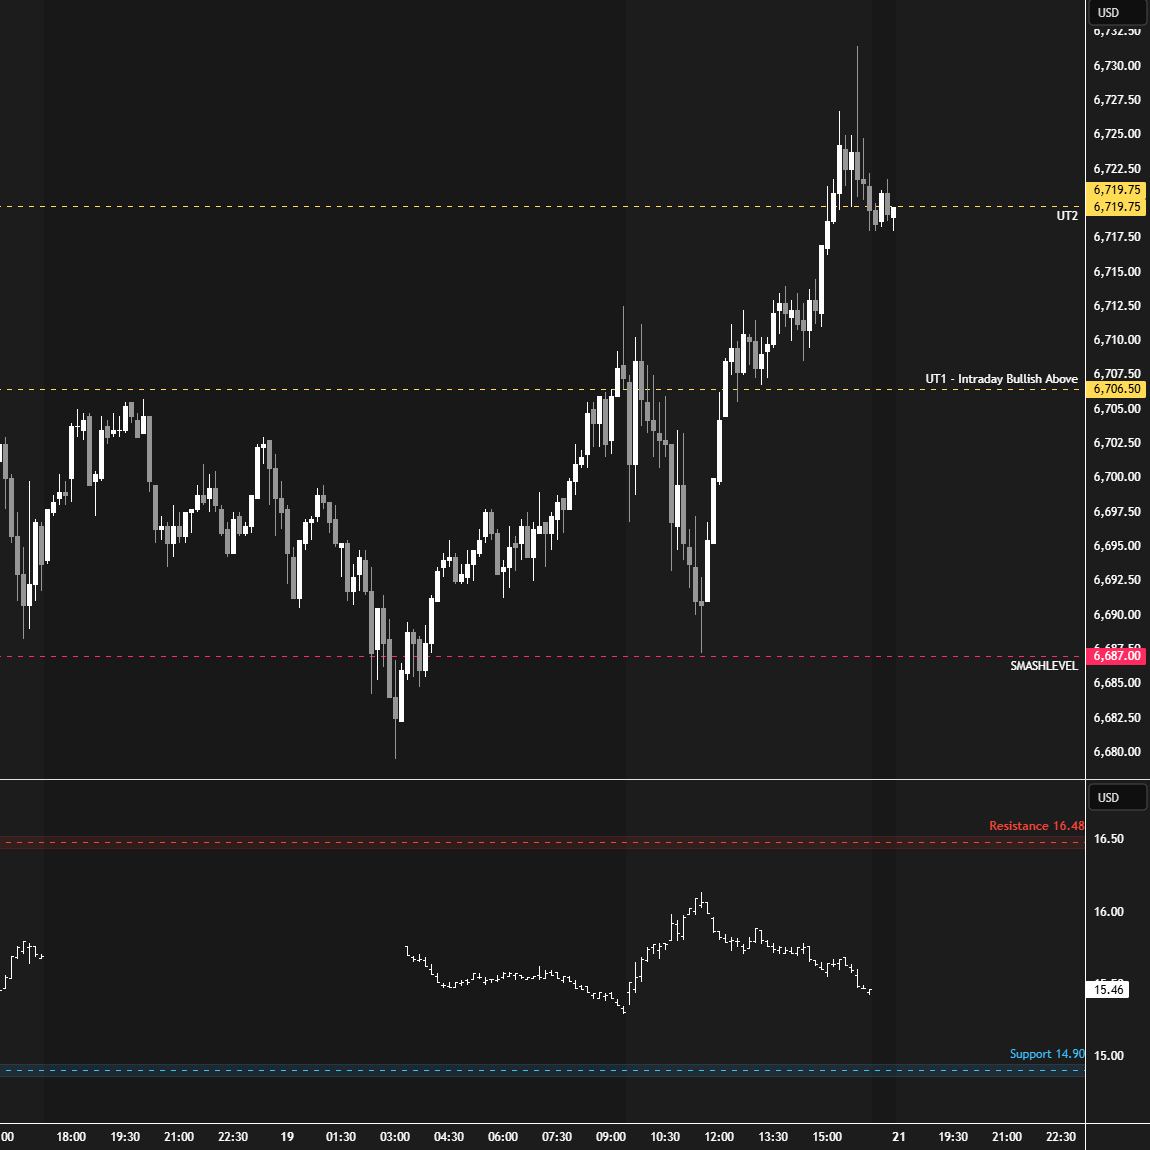
Friday’s session cleaned up the overnight ATH at 6719.75 and printed a new RTH ATH at 6731.50 after forming an upward spike during the M-period. This closing strength will be key to monitor moving forward.
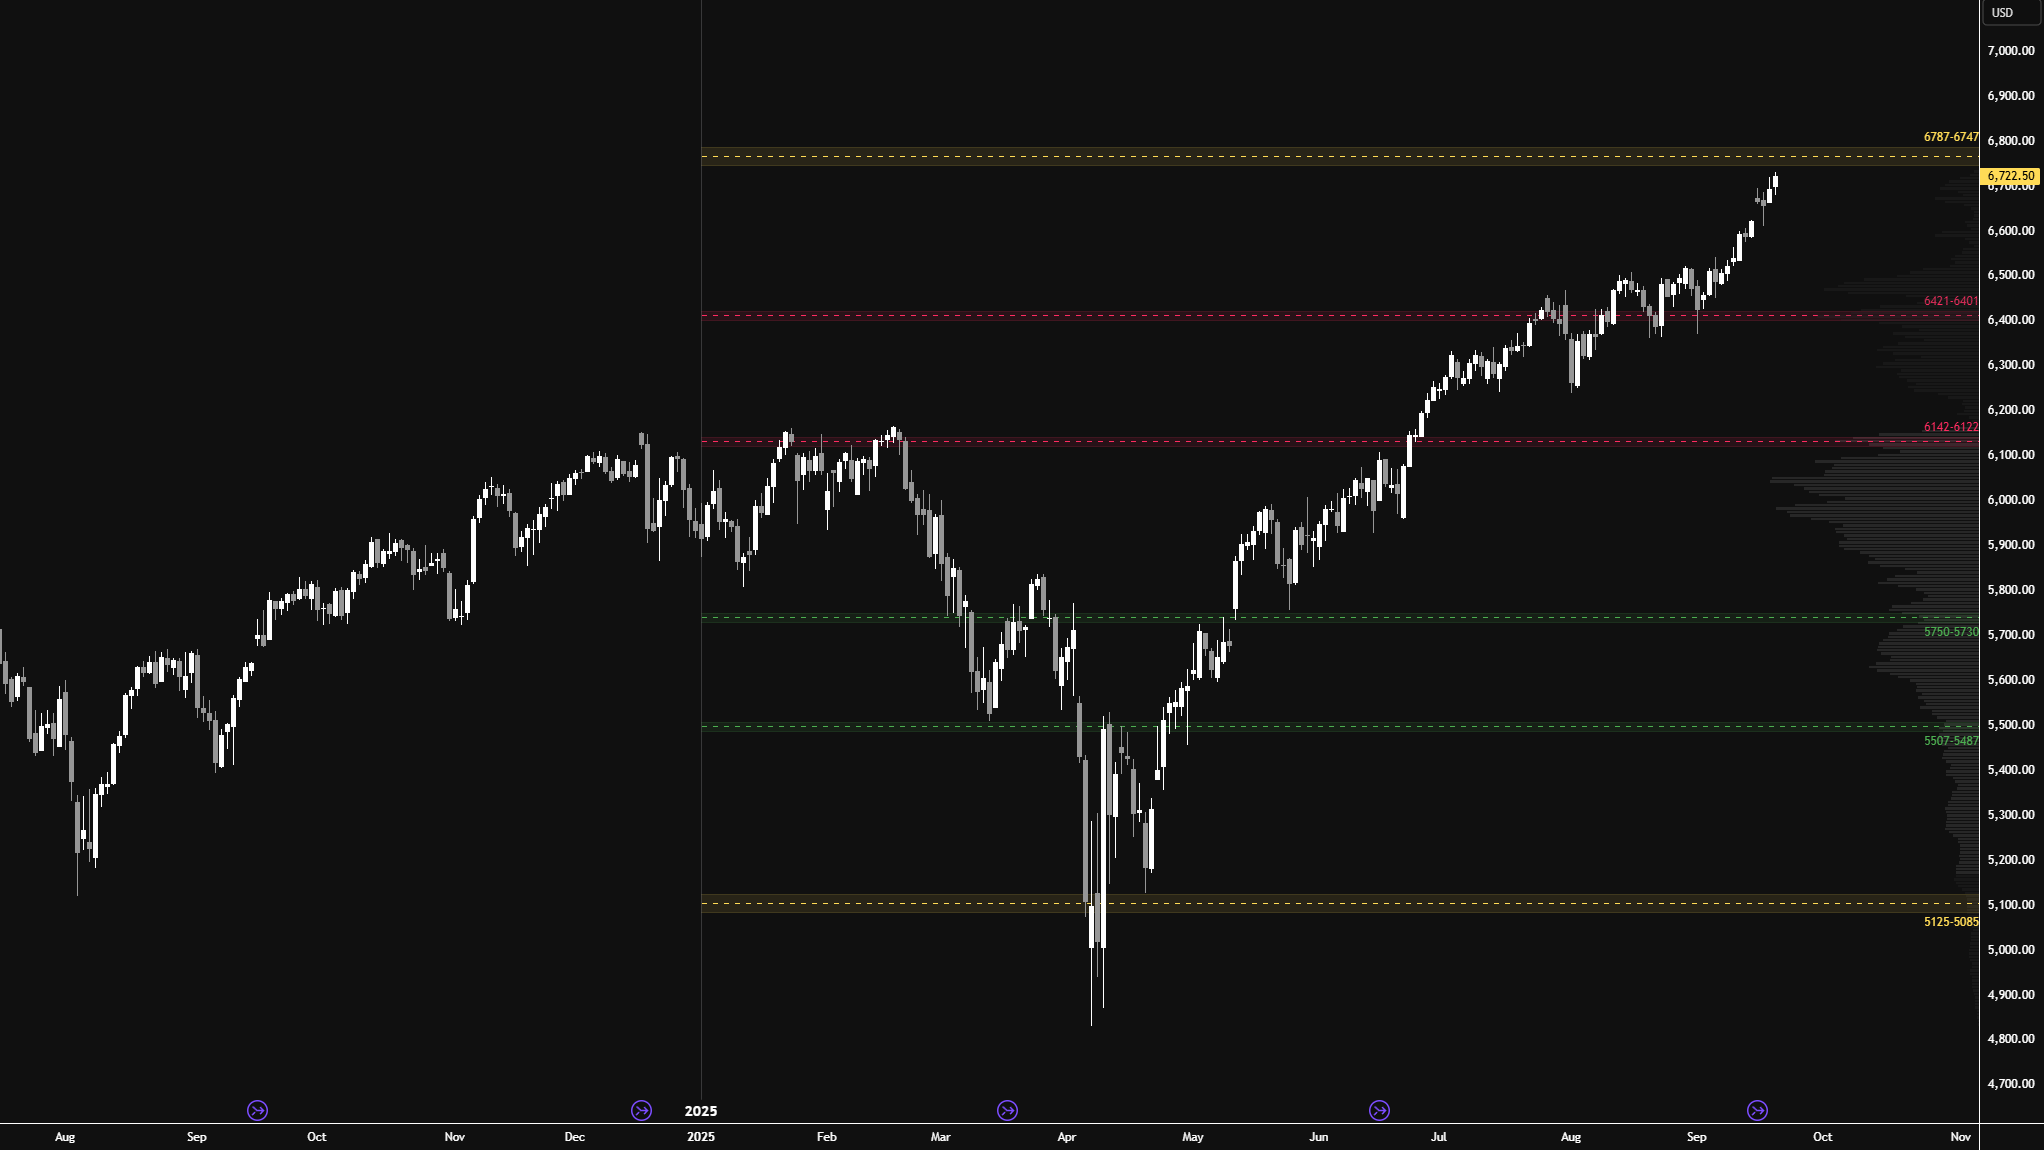
I will continue to include the HTF chart from a good friend of mine (see Figure 2), featuring levels generated by one of his models at the start of 2025. As you can see, this year’s price action has respected these levels remarkably well.
The market is approaching the 6747–6787 area of interest aggressively, which is notable. It’s worth mentioning that I haven’t adjusted any of these levels during rollover periods and have simply kept them on my charts, which has worked extremely well. A more “accurate” chart would use the levels on SPX, but that’s a discussion for another time.
The key takeaway from this chart is that the closer we get to the 6747–6787 area, the less interested I am in initiating any swing trades to the long side. A more reasonable approach would be to wait patiently for pullbacks to 6421–6401 or 6142–6122. This doesn’t necessarily mean the 6747–6787 area is a place to be short—after all, we remain in a strong bull trend that can’t be ignored. As short-term traders, we are fortunate that we don’t need to maintain a bias for long periods and can adjust and adapt quickly intraday. Short-term traders will also be the first to spot any potential momentum shifts.
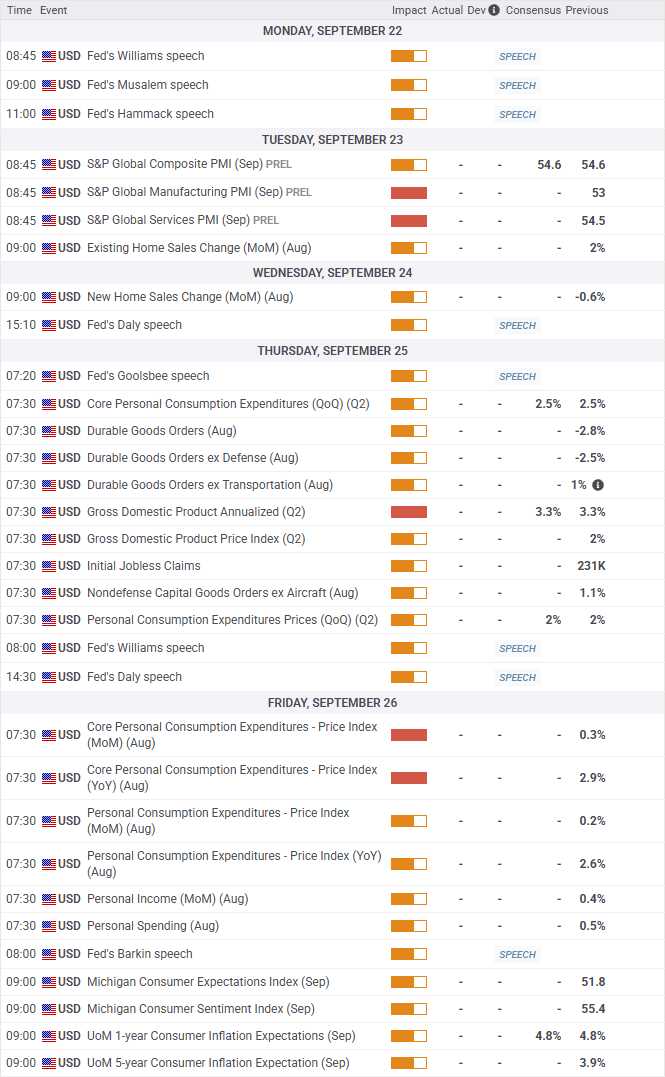
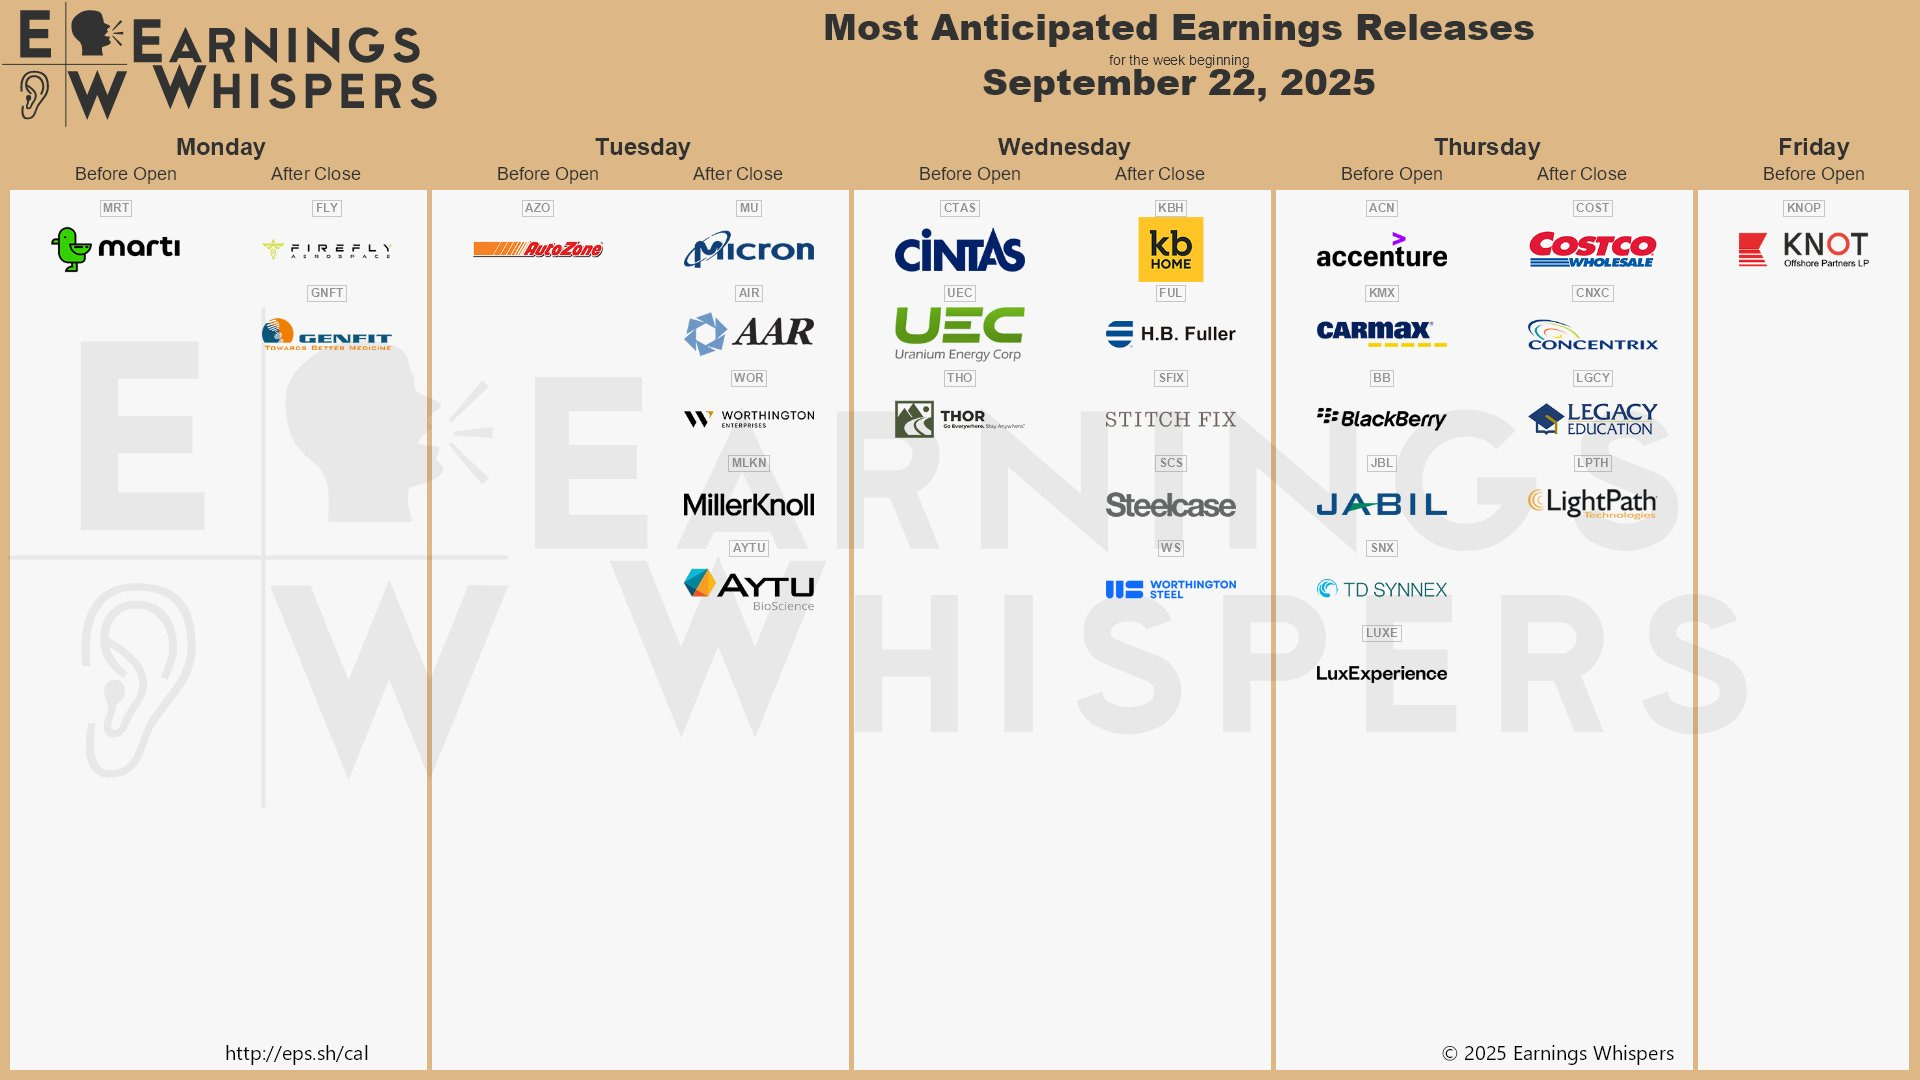
Economic & Earnings Calendar
Market Structure
🟩 Daily: OTFU → Ends at: 6687.25
🟩 Weekly: OTFU → Ends at: 6611
🟩 Monthly: OTFU → Ends at: 6239.50
Balance: A market condition where price consolidates within a defined range, reflecting indecision as the market awaits more market-generated information. We apply balance guidelines—favoring fade trades at range extremes (highs/lows) and preparing for breakout setups if balance resolves.
One-Time Framing Up (OTFU): A market condition where each subsequent bar forms a higher low, signaling a strong upward trend.
One-Time Framing Down (OTFD): A market condition where each subsequent bar forms a lower high, signaling a strong downward trend.
FYI: During rollover, one-time framing and balance can look distorted because of the roll gap. I don’t back-adjust my charts, so expect these concepts to be temporarily skewed.
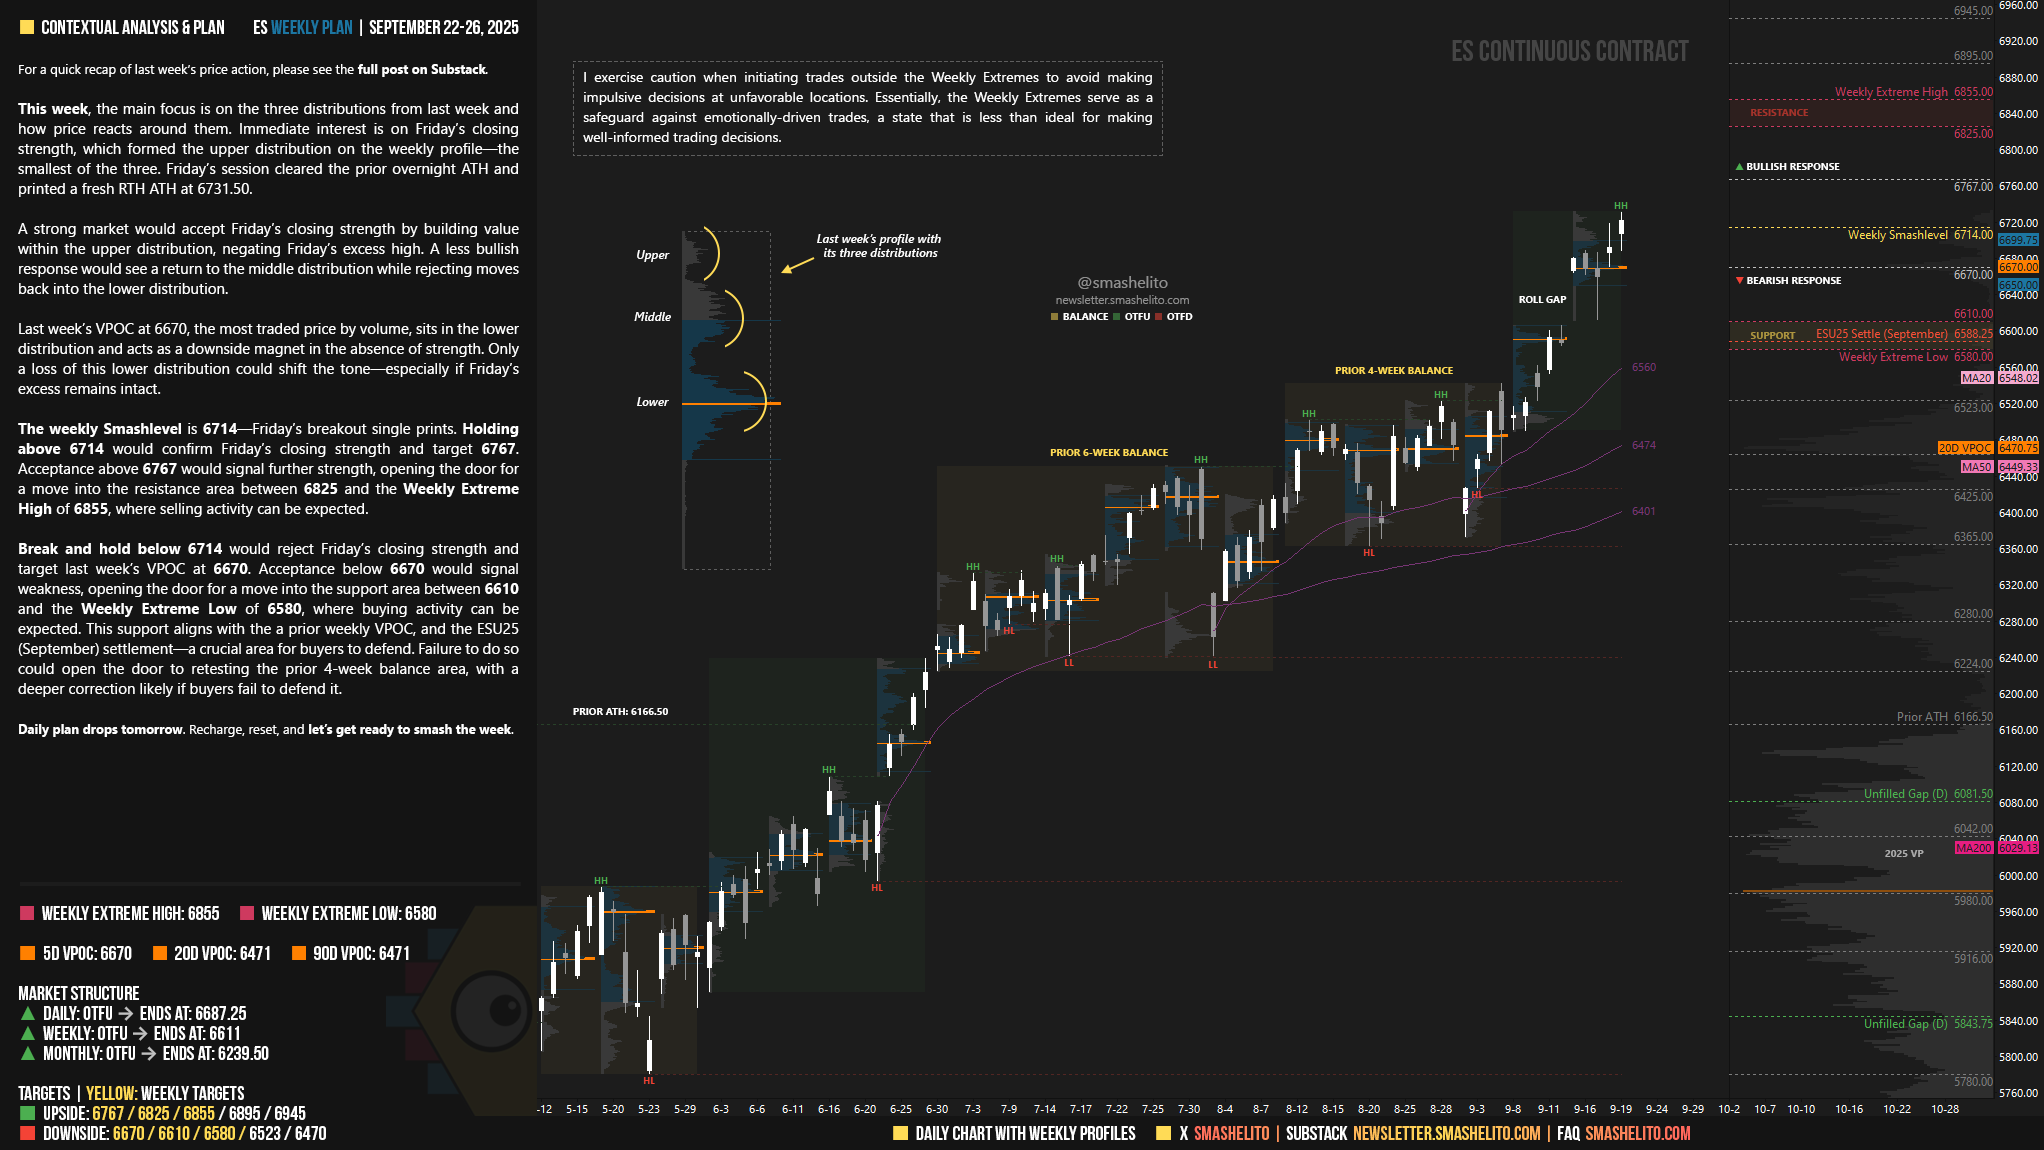
Contextual Analysis & Plan
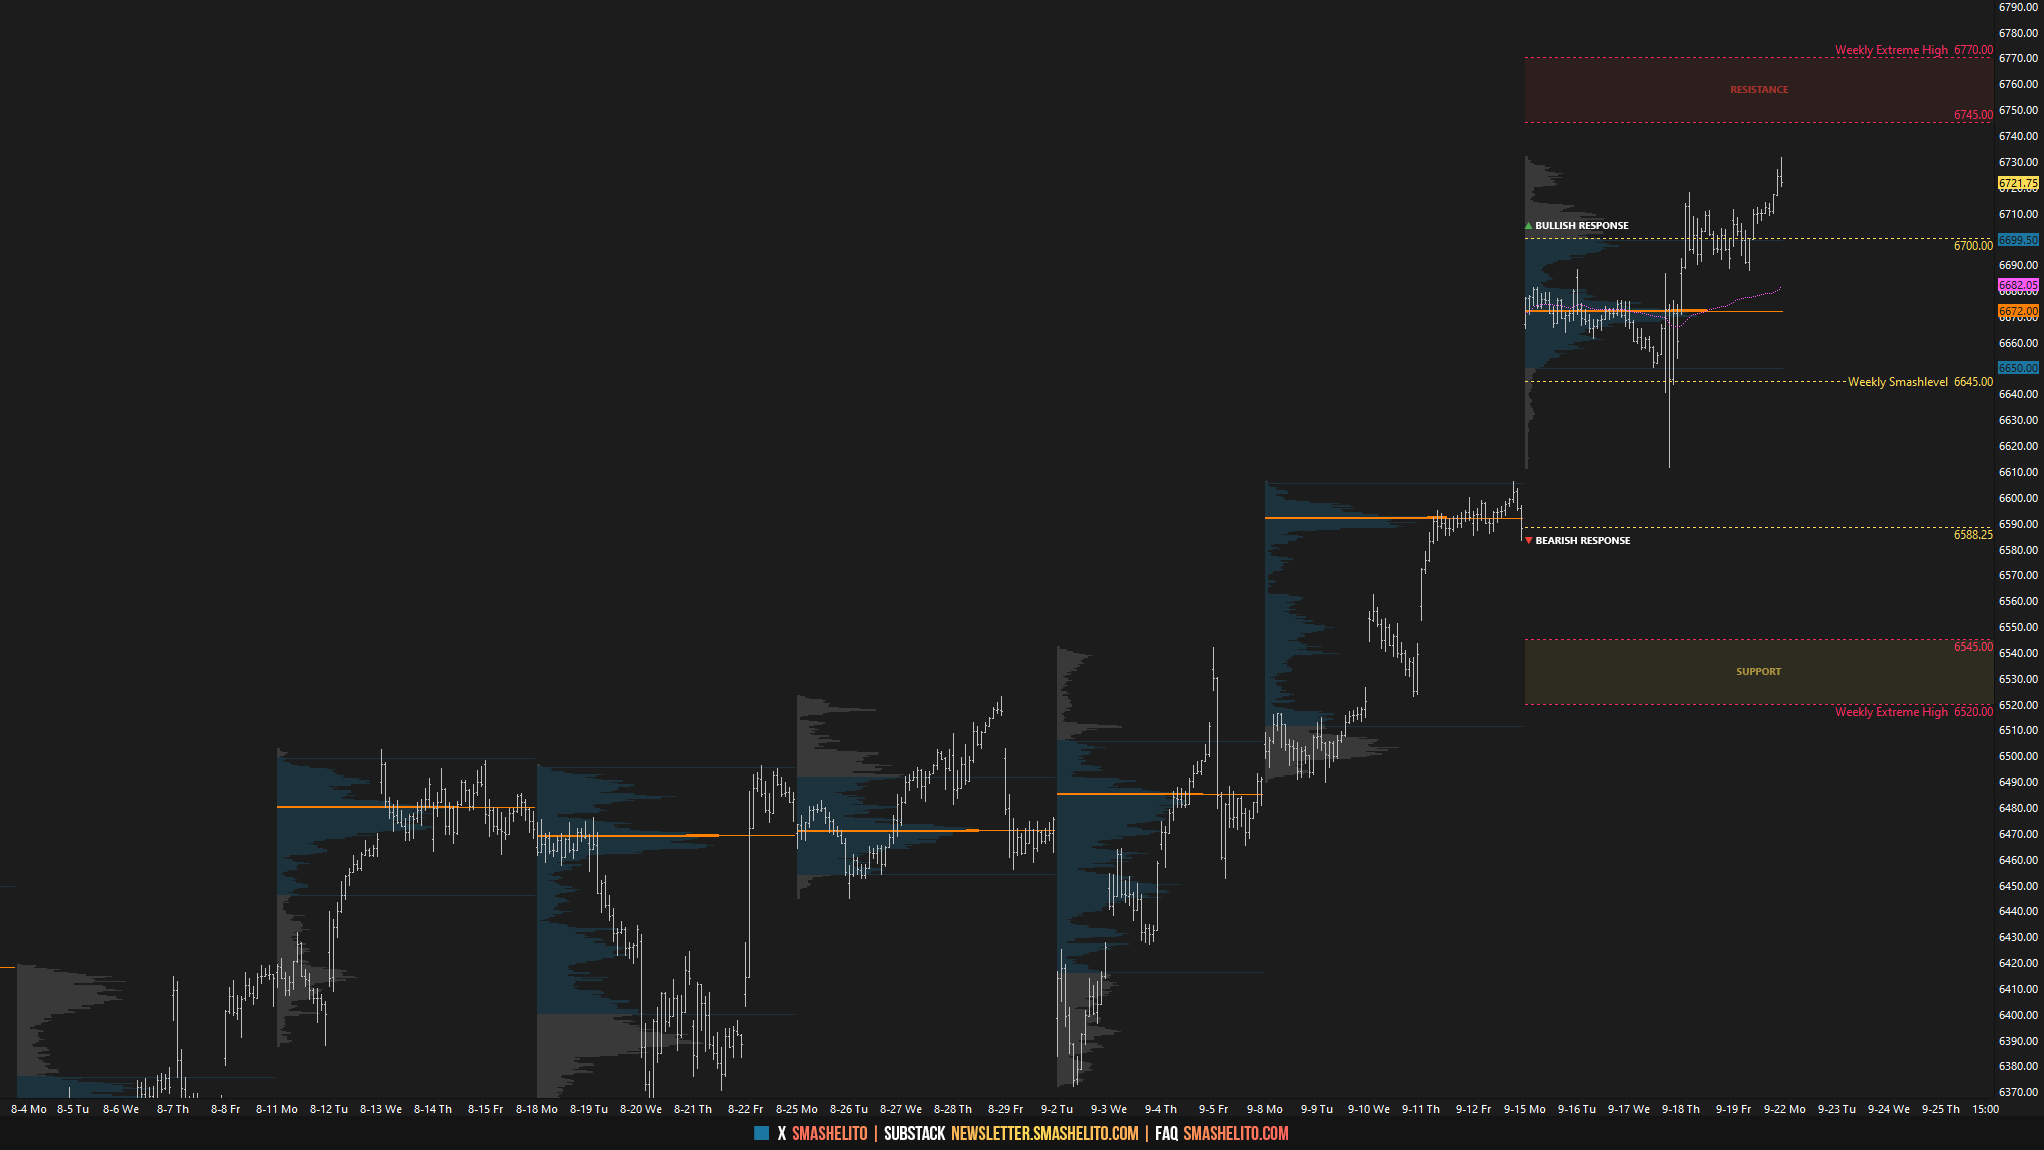
This week, the main focus is on the three distributions from last week and how price reacts around them. Immediate interest is on Friday’s closing strength, which formed the upper distribution on the weekly profile—the smallest of the three. Friday’s session cleared the prior overnight ATH and printed a fresh RTH ATH at 6731.50.
A strong market would accept Friday’s closing strength by building value within the upper distribution, negating Friday’s excess high. A less bullish response would see a return to the middle distribution while rejecting moves back into the lower distribution.
Last week’s VPOC at 6670, the most traded price by volume, sits in the lower distribution and acts as a downside magnet in the absence of strength. Only a loss of this lower distribution could shift the tone—especially if Friday’s excess remains intact.
The weekly Smashlevel is 6714—Friday’s breakout single prints. Holding above 6714 would confirm Friday’s closing strength and target 6767. Acceptance above 6767 would signal further strength, opening the door for a move into the resistance area between 6825 and the Weekly Extreme High of 6855, where selling activity can be expected.
Break and hold below 6714 would reject Friday’s closing strength and target last week’s VPOC at 6670. Acceptance below 6670 would signal weakness, opening the door for a move into the support area between 6610 and the Weekly Extreme Low of 6580, where buying activity can be expected. This support aligns with the a prior weekly VPOC, and the ESU25 (September) settlement—a crucial area for buyers to defend. Failure to do so could open the door to retesting the prior 4-week balance area, with a deeper correction likely if buyers fail to defend it.
Key Levels of Interest
In the upcoming week, I will closely observe the behavior around 6714.
Holding above 6714 would target 6767 / 6825 / 6855* / 6895 / 6945
Break and hold below 6714 would target 6670 / 6610 / 6580* / 6523 / 6470
*Weekly Extremes. I exercise caution when initiating trades outside the Weekly Extremes to avoid making impulsive decisions at unfavorable locations. Essentially, the Weekly Extremes serve as a safeguard against emotionally-driven trades, a state that is less than ideal for making well-informed trading decisions.
Daily plan drops tomorrow. Recharge, reset, and let’s get ready to smash the week.
Oh smash , your work is precious god bless you and your efforts 🙏🏻🌹
Thanks Smash!