
ES Weekly Plan | September 15-19, 2025
Recap, Market Context & Key Levels for the Week Ahead

Welcome to this week’s plan. Inside, you’ll find a quick review of last week’s price action, key economic events, market structure, context for the week ahead, and the levels I’ll be focusing on. Let’s get prepared.
Contents
Last Week in Review & Bonus Chart
Economic & Earnings Calendar
Market Structure
Contract Rollover
Contextual Analysis & Plan
Key Levels of Interest
Last Week in Review & Bonus Chart
Last week’s plan: ES Weekly Plan | September 8-12, 2025
Heading into last week, the main focus was the 4-week balance area between 6541 and 6362, where responsive two-sided activity was taking place as the market awaited further market-generated information.
As discussed, a strong market would reclaim the August high at 6523, negating the weakness observed on Friday the 5th, when sellers rejected buyers’ attempt to move out of balance. This would open the door for another breakout attempt. Conversely, a weak response would involve acceptance below the prior 6-week balance high at 6451.
The market kicked off the week with a rather uneventful inside day on Monday, partially filling the poor structure from Friday the 5th. The Smashlevel at 6494 held up nicely throughout the session, proving a couple of short-term trade opportunities.
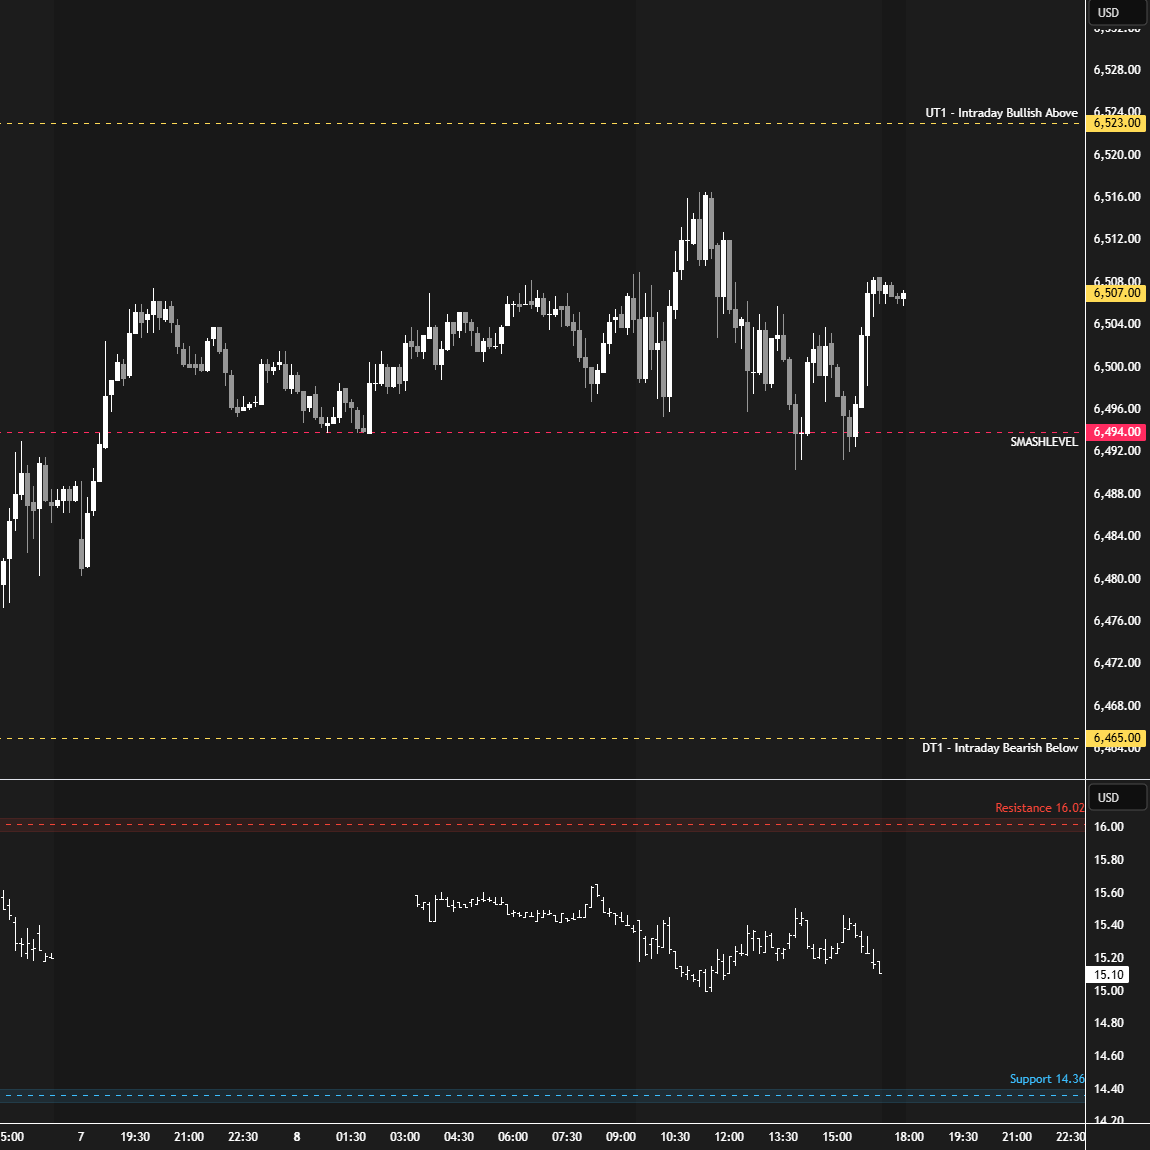
Tuesday’s session looked below Monday’s inside day, tested the pivotal 6494 level, and failed, resulting in an outside day up. The poor structure from Friday the 5th was fully cleaned up in the process. A closing spike formed in the M-period, which became our key reference moving forward.
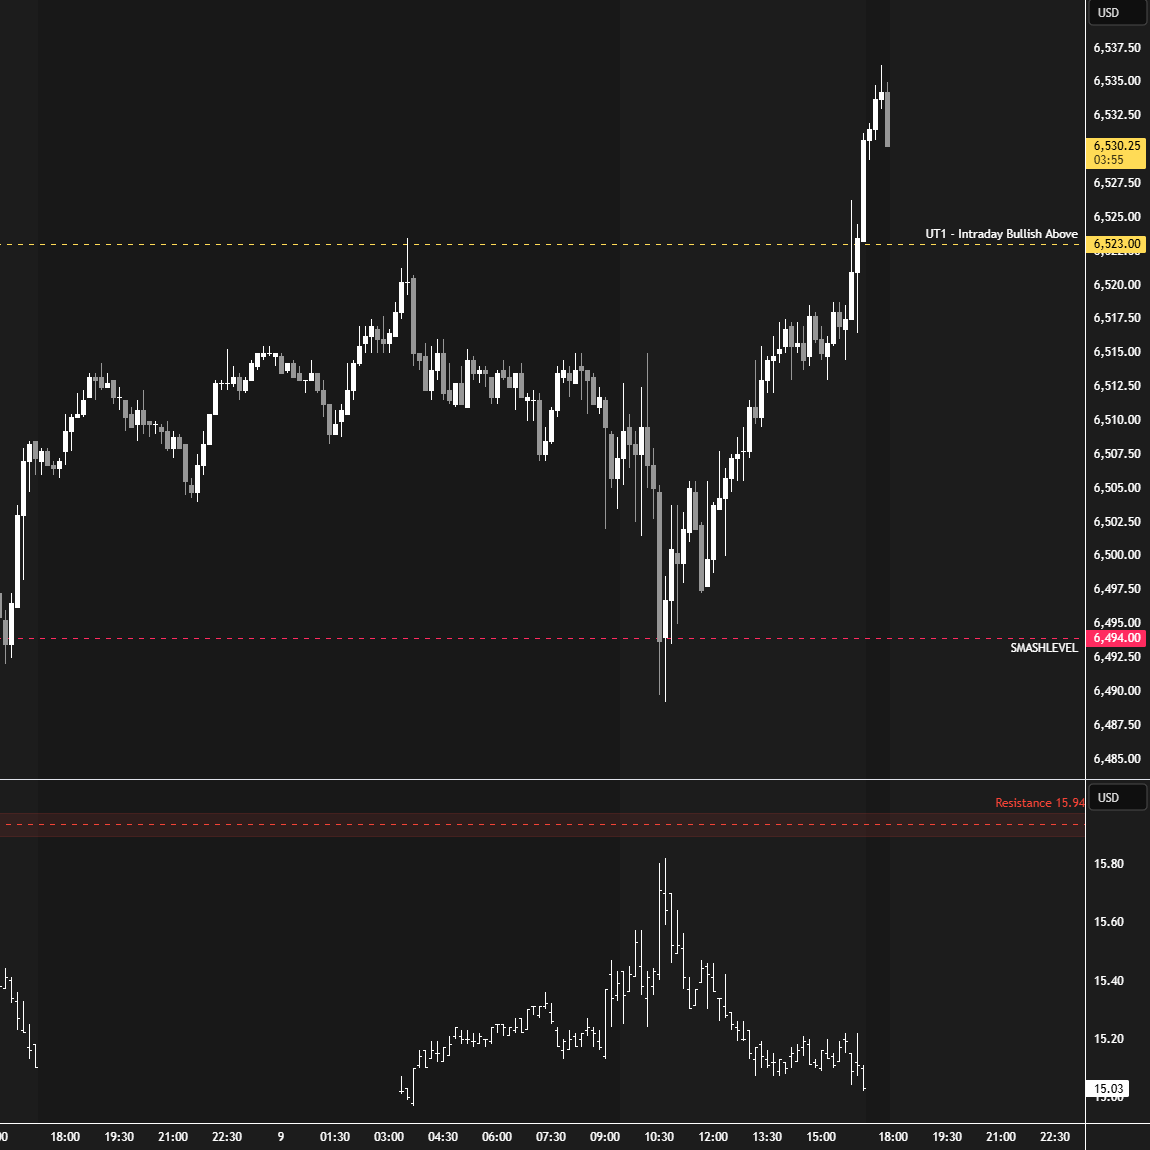
The key on Wednesday was to monitor whether the higher prices of Tuesday’s spike would be accepted or rejected. The market ultimately accepted Tuesday’s closing strength by establishing value higher, signaling strength. The spike area was retested late in the session, where responsive buyers stepped in.
A new all-time high printed, value was established cleanly higher, and the market was one-time framing up across all time frames after Wednesday’s session breached the 4-week balance high at 6542. That 6542 level was the key reference heading into Thursday.
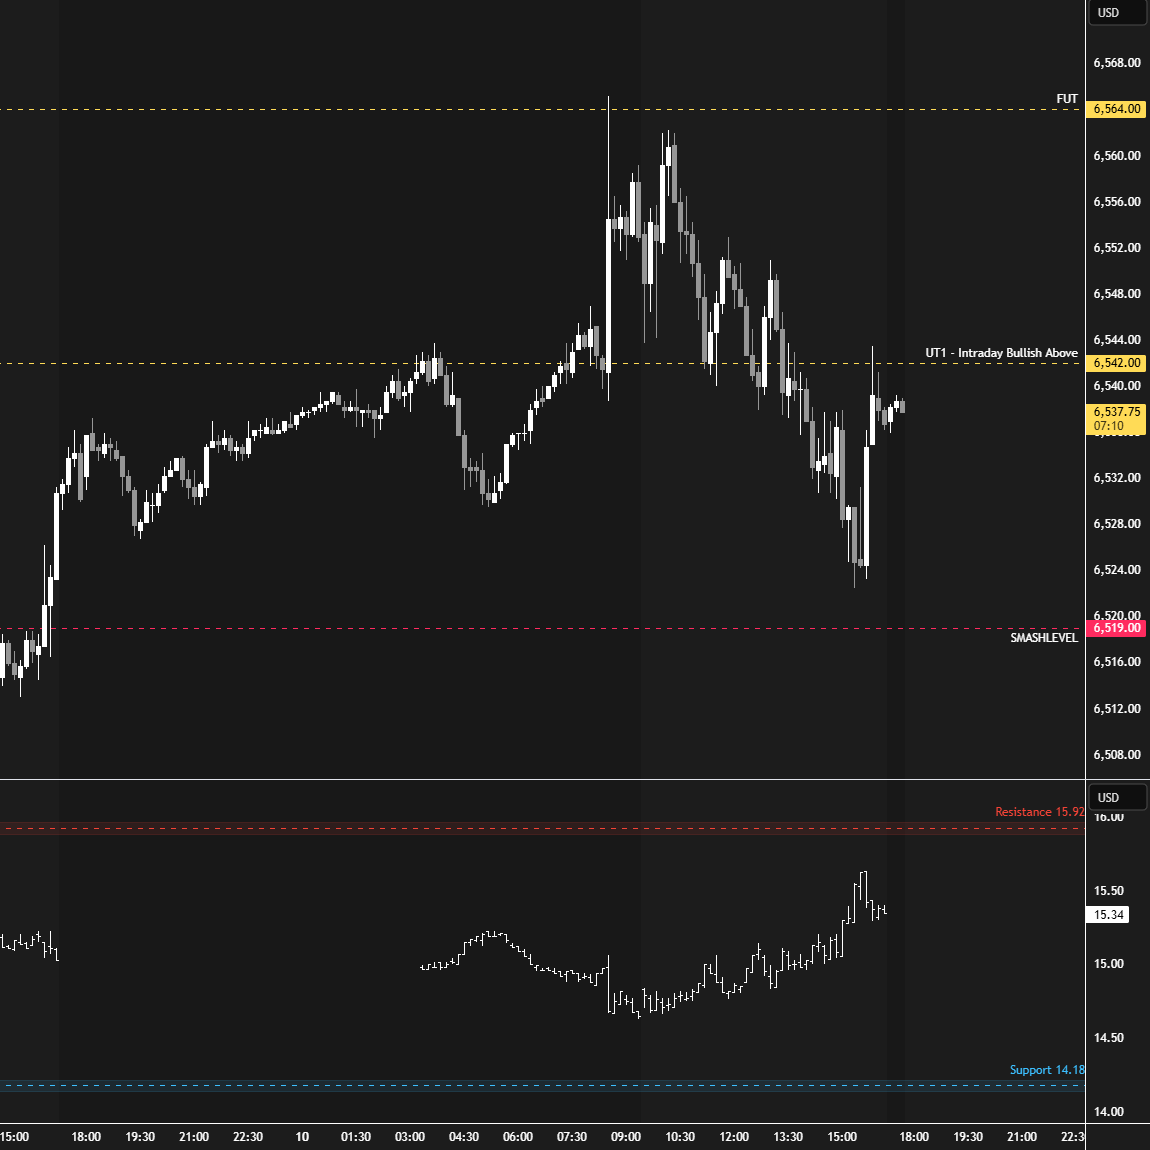
Thursday’s session held the 6542 level overnight and through the CPI release, setting the stage for upside continuation in RTH. All intraday upside targets were reached up to 6596, where the momentum stalled.
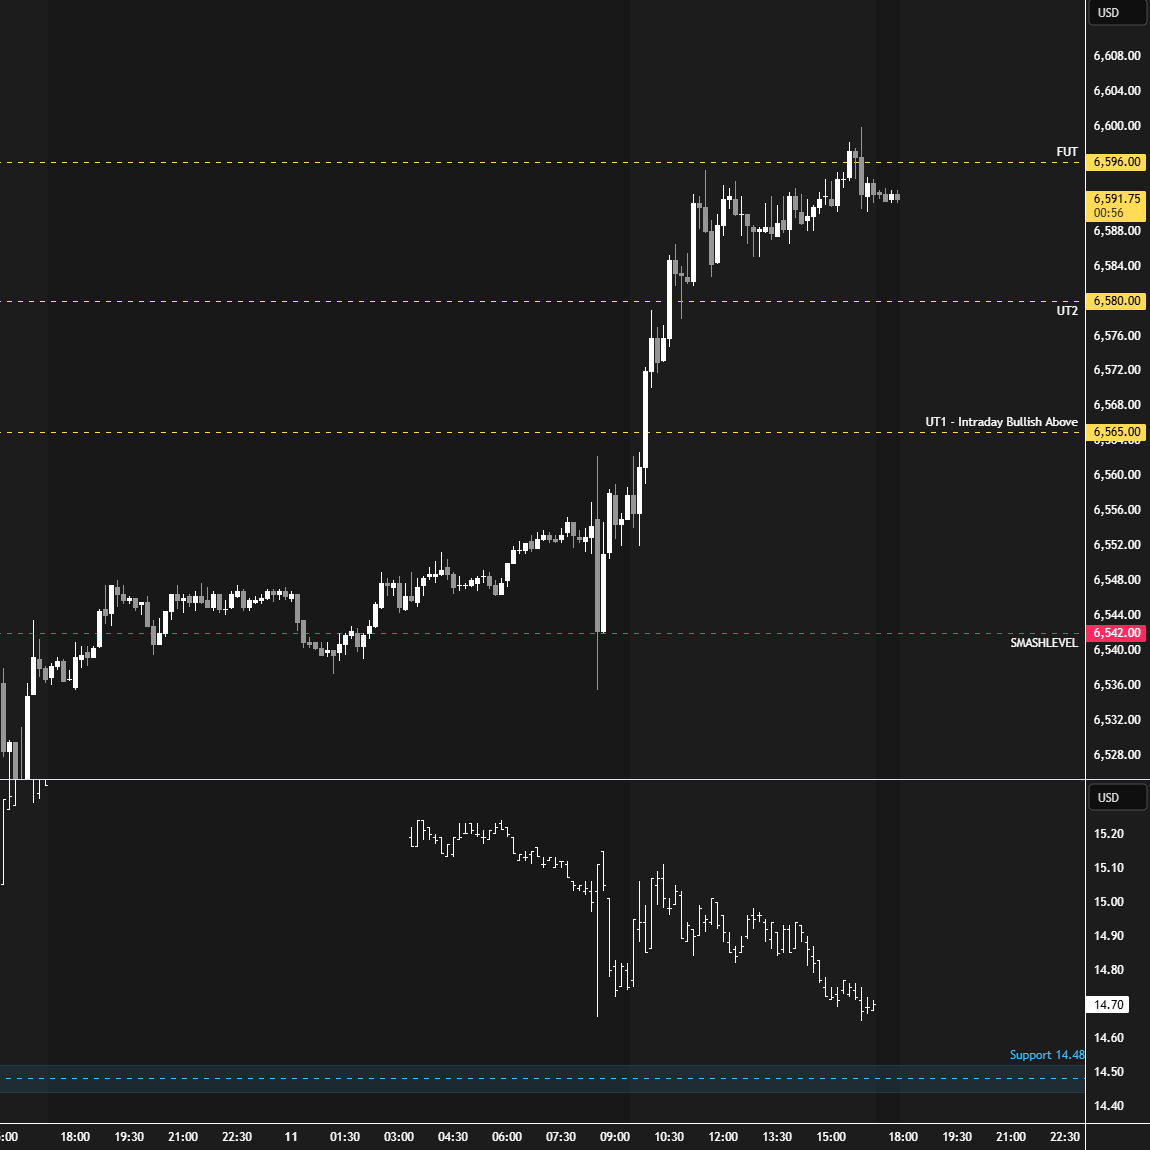
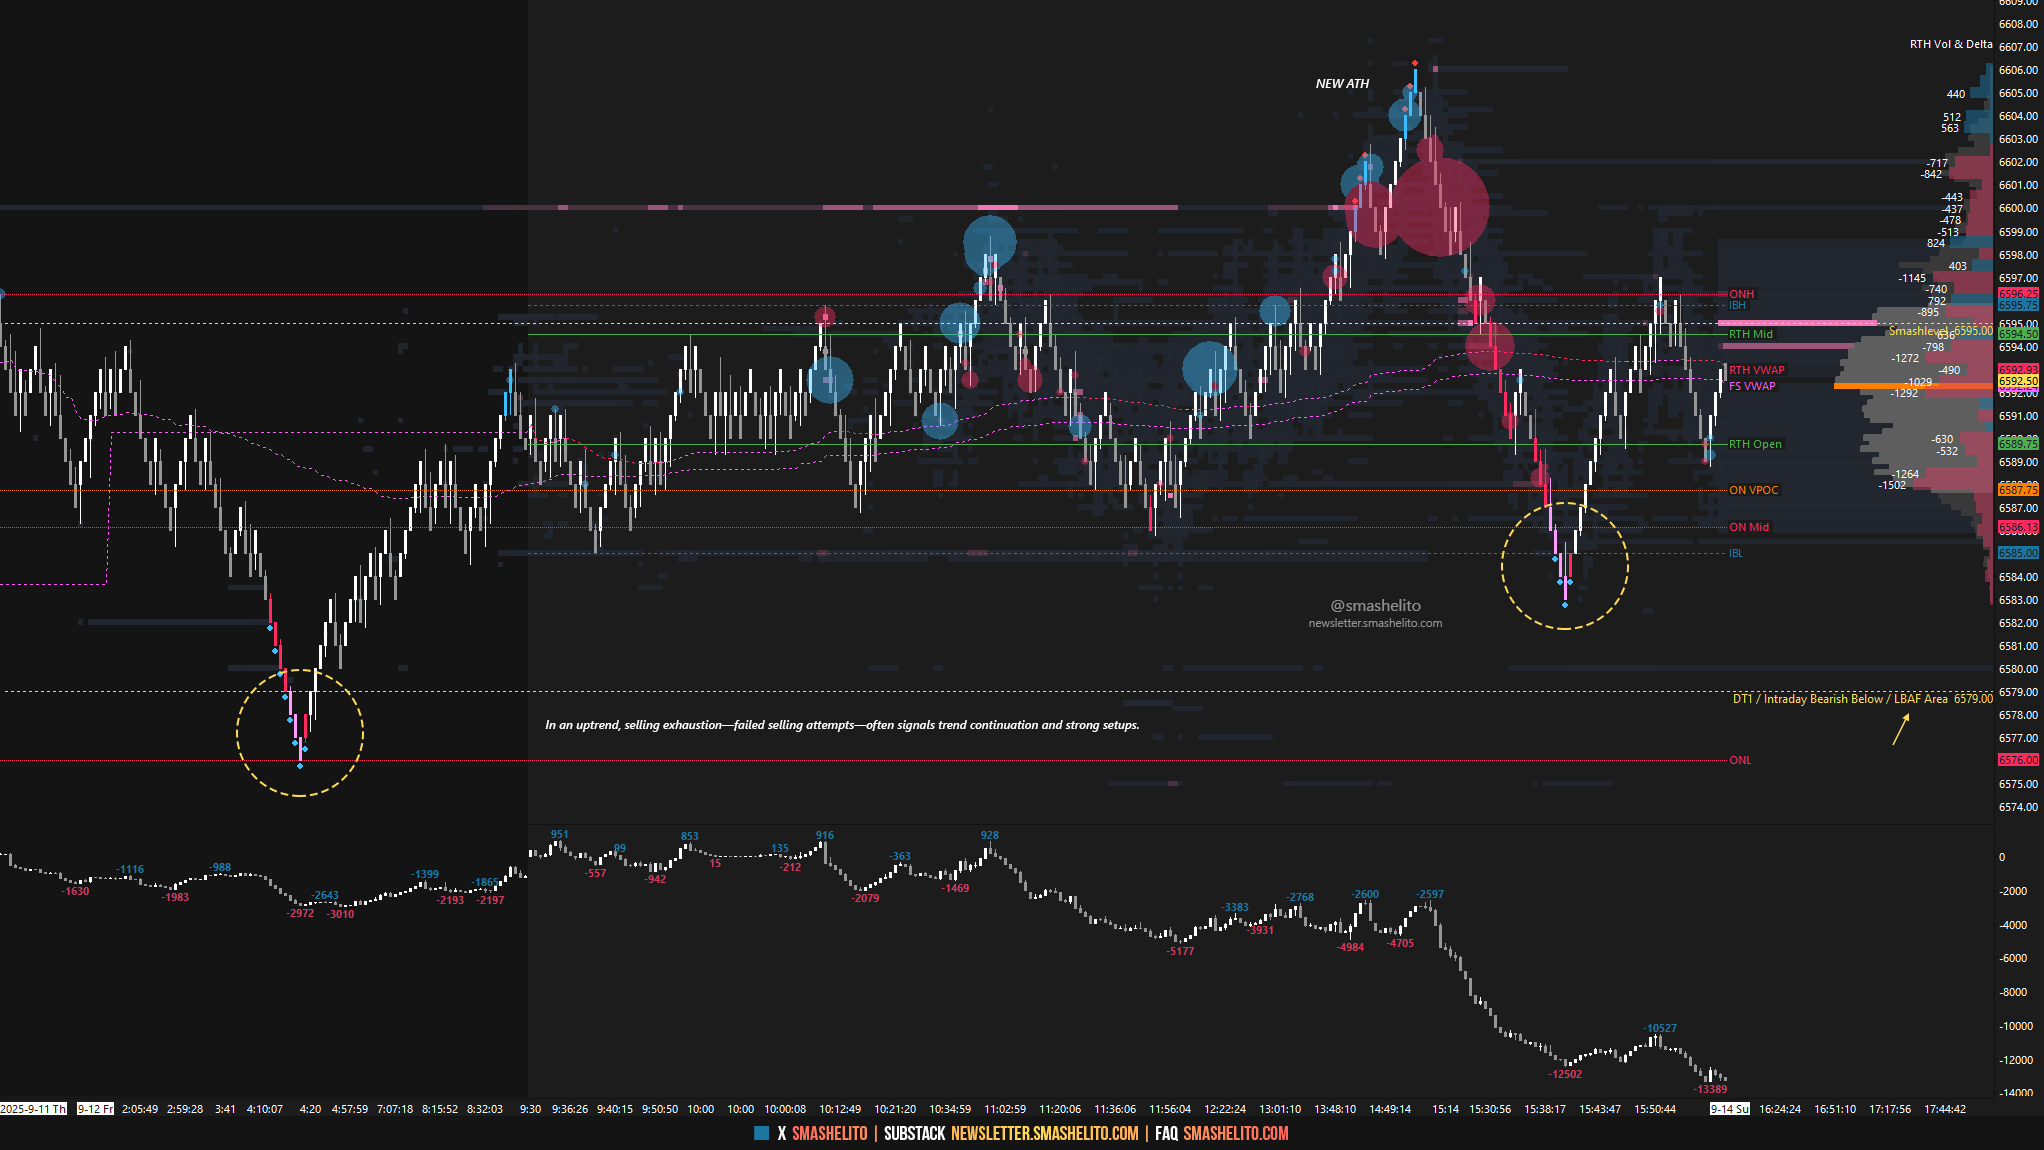
On Friday, the market consolidated within Thursday’s value area, suggesting bullish consolidation until proven otherwise. Buyers were active on dips (see Figure 1), and another ATH printed at 6606 — just 9 handles shy of the Weekly Extreme High at 6615.
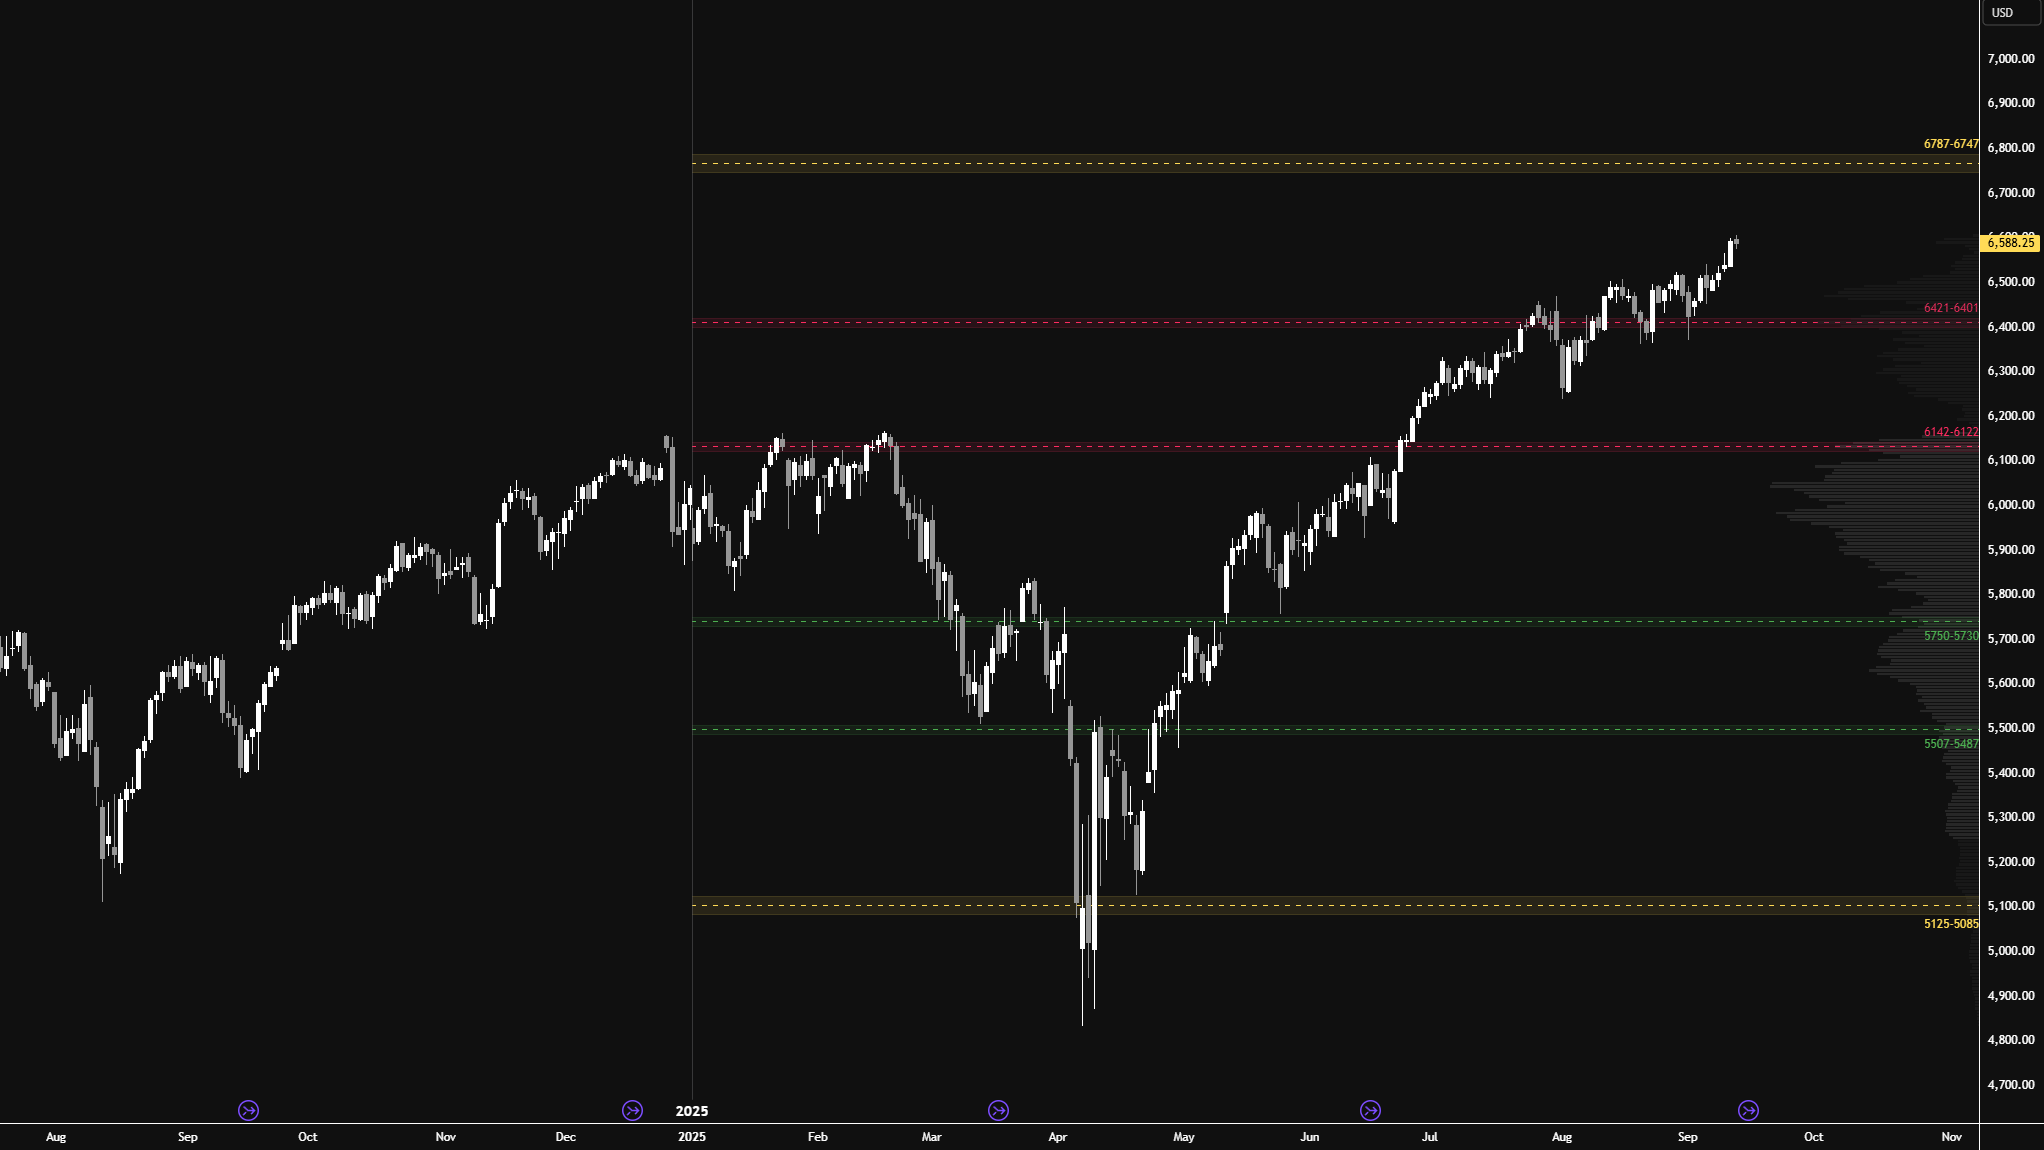
I will continue to include the HTF chart from a good friend of mine (see Figure 2), featuring levels generated by one of his models at the start of 2025. As you can see, this year’s price action has respected these levels remarkably well.
There’s not much to update—after defending the 6421–6401 area of interest, the market has continued to grind higher. The key question now is whether it’s heading toward the next area of interest between 6747–6787. This move doesn’t need to unfold in a straight line, which is why I don’t pay too much attention to this chart and instead focus on my day-to-day approach.
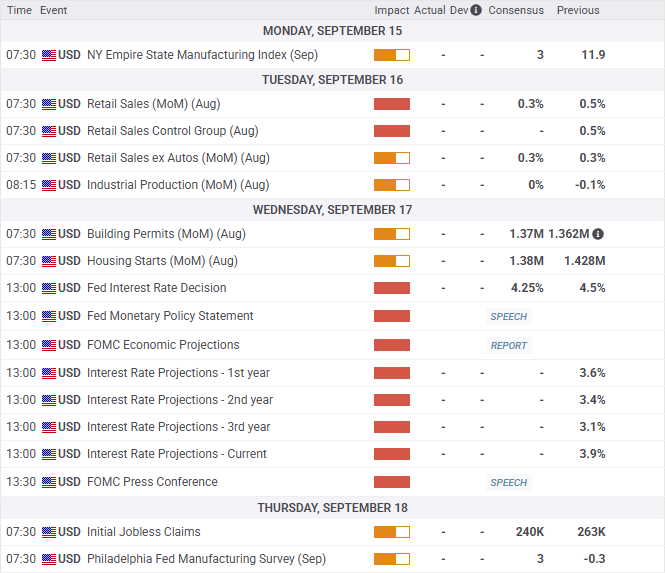
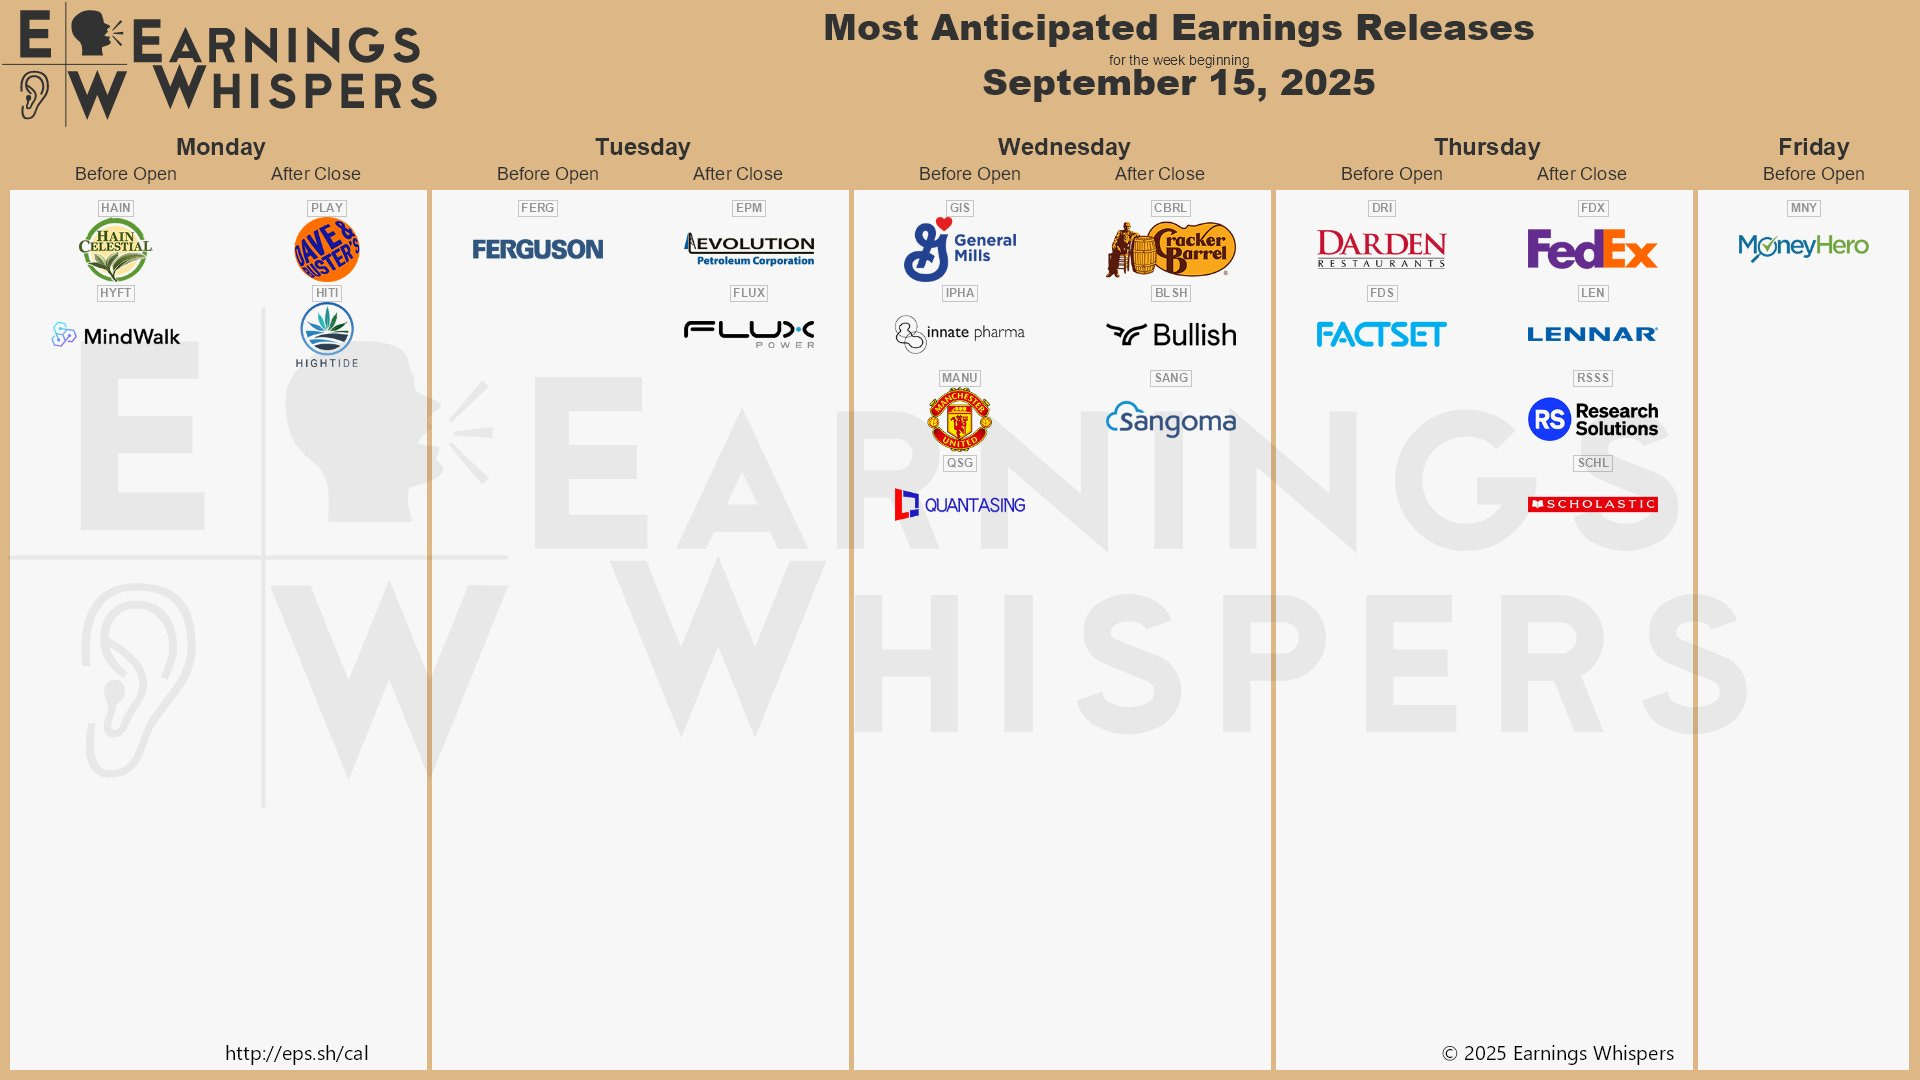
Economic & Earnings Calendar
Market Structure
🟩 Daily: OTFU → Ends at: 6583
🟩 Weekly: OTFU → Ends at: 6489.25
🟩 Monthly: OTFU → Ends at: 6239.50
Balance: A market condition where price consolidates within a defined range, reflecting indecision as the market awaits more market-generated information. We apply balance guidelines—favoring fade trades at range extremes (highs/lows) and preparing for breakout setups if balance resolves.
One-Time Framing Up (OTFU): A market condition where each subsequent bar forms a higher low, signaling a strong upward trend.
One-Time Framing Down (OTFD): A market condition where each subsequent bar forms a lower high, signaling a strong downward trend.
FYI: During rollover, one-time framing and balance can look distorted because of the roll gap. I don’t back-adjust my charts, so expect these concepts to be temporarily skewed.
Contract Rollover
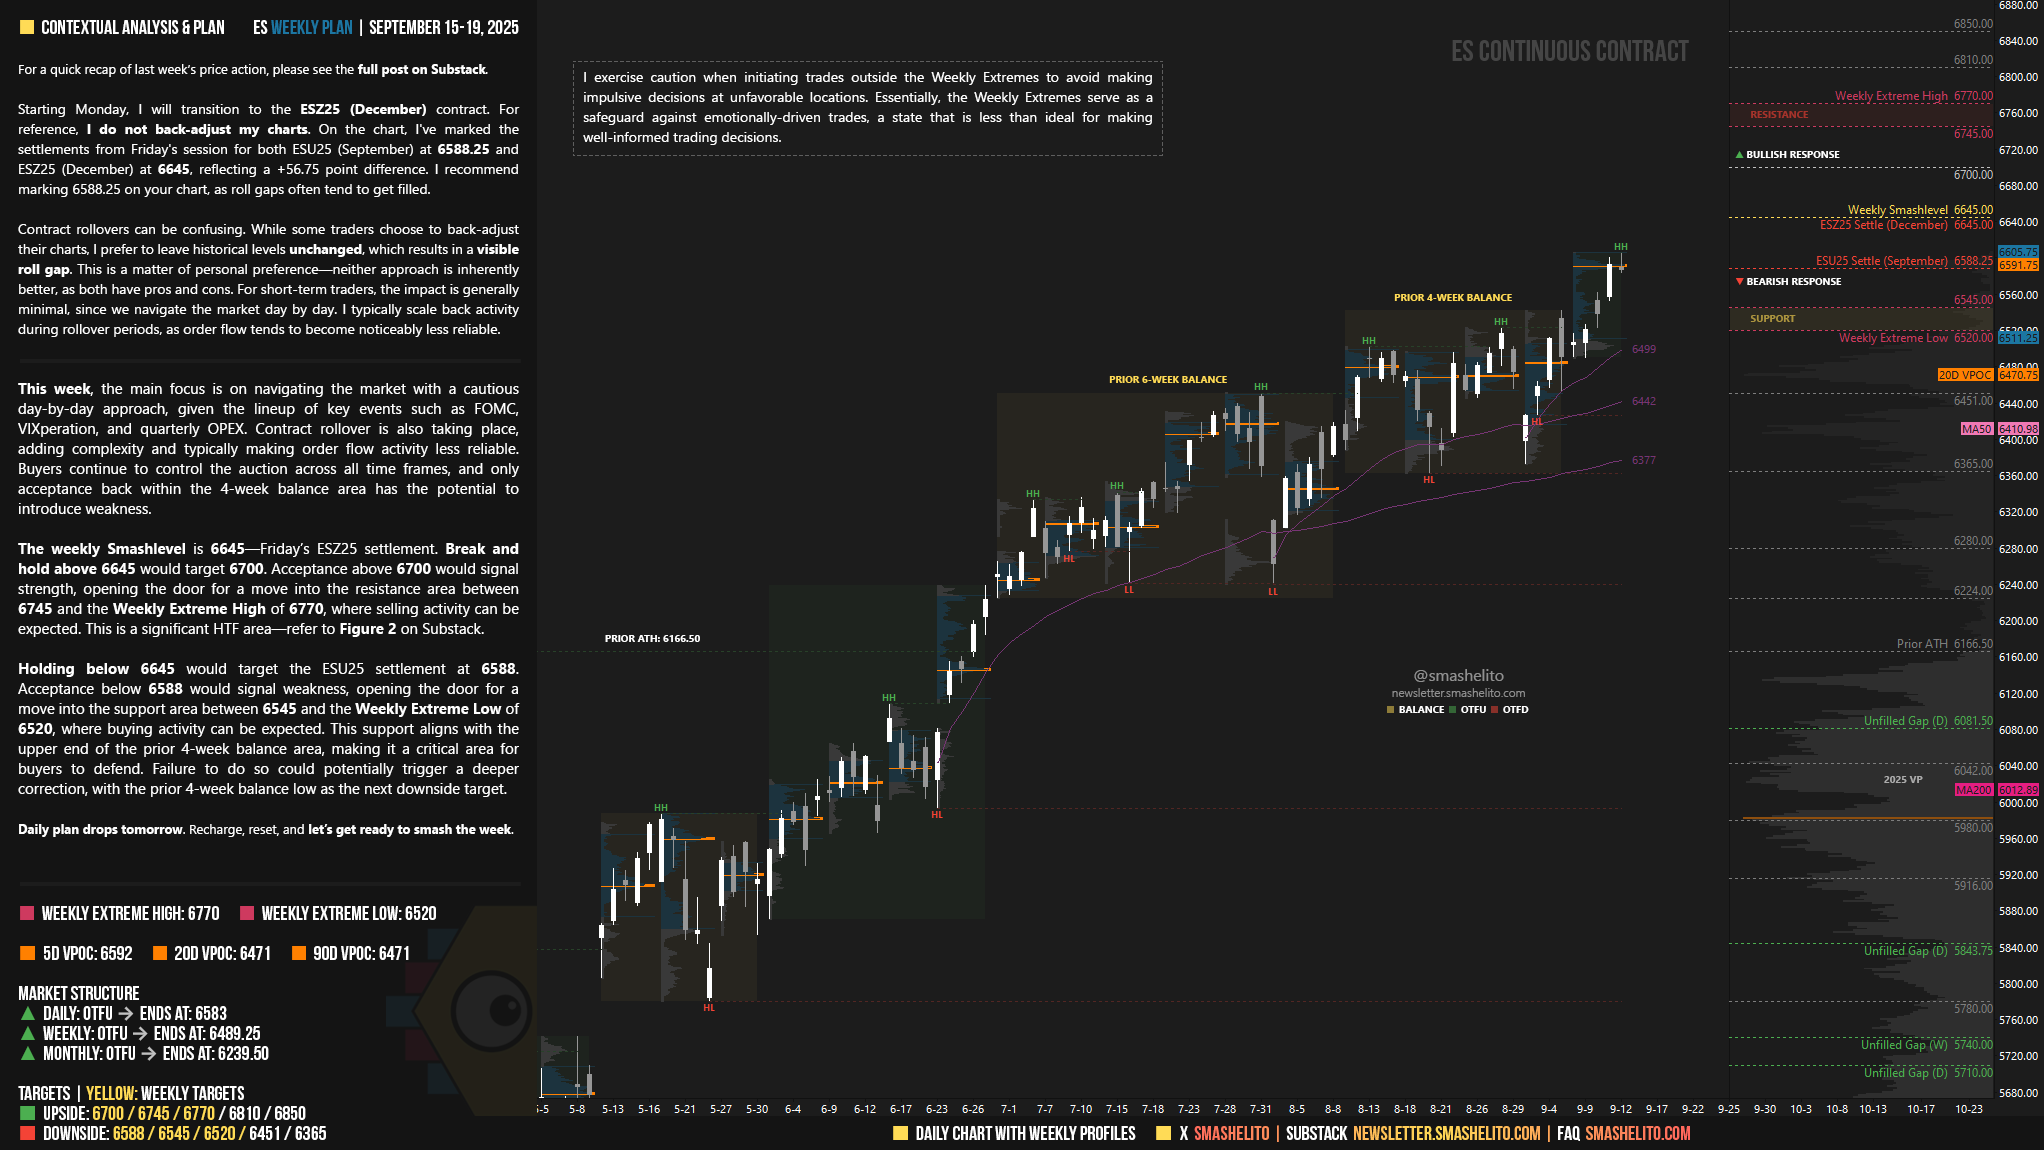
Starting Monday, I will transition to the ESZ25 (December) contract. For reference, I do not back-adjust my charts. On the chart, I've marked the settlements from Friday's session for both ESU25 (September) at 6588.25 and ESZ25 (December) at 6645, reflecting a +56.75 point difference. I recommend marking 6588.25 on your chart, as roll gaps often tend to get filled.
Contract rollovers can be confusing. While some traders choose to back-adjust their charts, I prefer to leave historical levels unchanged, which results in a visible roll gap. This is a matter of personal preference—neither approach is inherently better, as both have pros and cons. For short-term traders, the impact is generally minimal, since we navigate the market day by day. I typically scale back activity during rollover periods, as order flow tends to become noticeably less reliable.
Contextual Analysis & Plan
This week, the main focus is on navigating the market with a cautious day-by-day approach, given the lineup of key events such as FOMC, VIXperation, and quarterly OPEX. Contract rollover is also taking place, adding complexity and typically making order flow activity less reliable. Buyers continue to control the auction across all time frames, and only acceptance back within the 4-week balance area has the potential to introduce weakness.
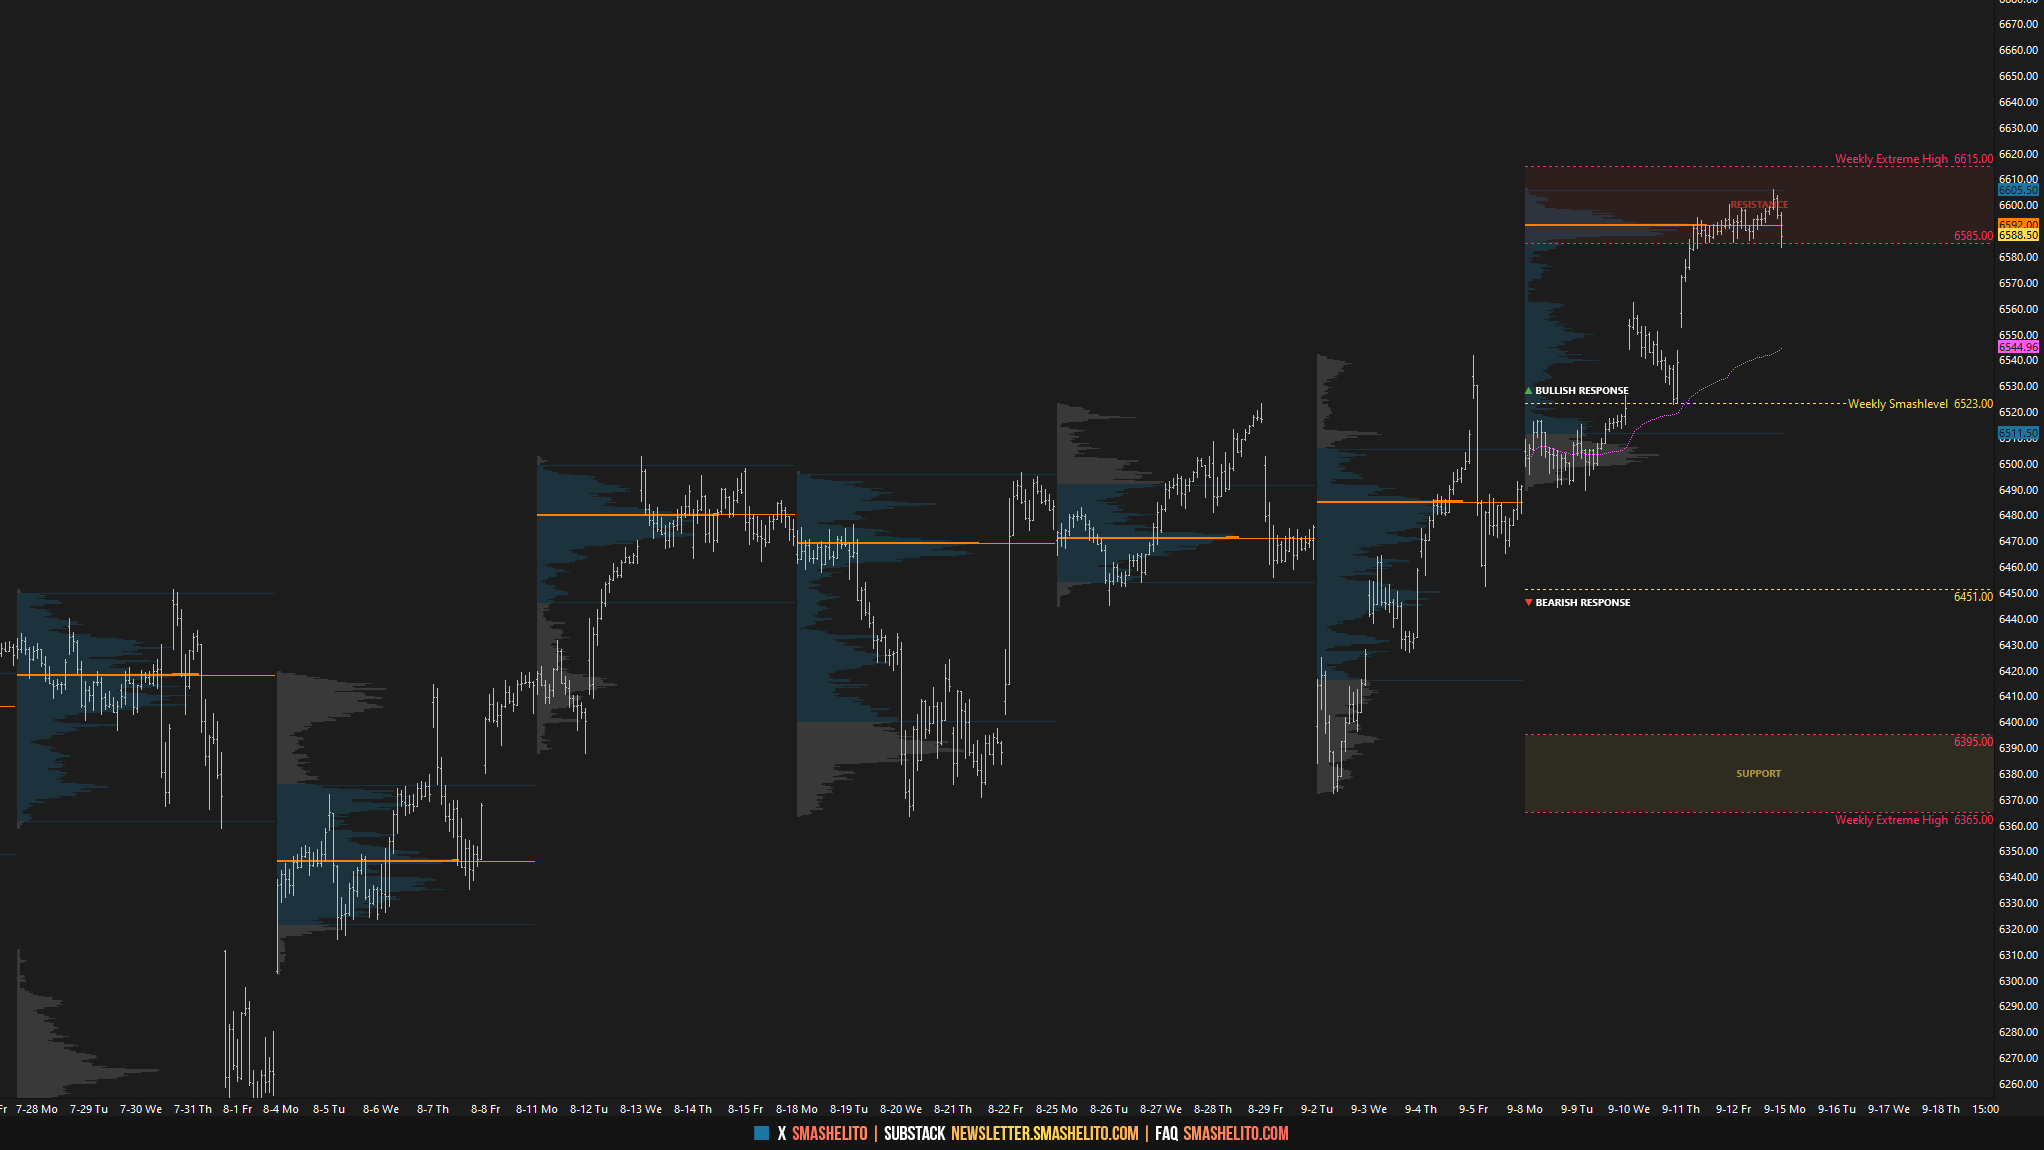
The weekly Smashlevel is 6645—Friday’s ESZ25 settlement. Break and hold above 6645 would target 6700. Acceptance above 6700 would signal strength, opening the door for a move into the resistance area between 6745 and the Weekly Extreme High of 6770, where selling activity can be expected. This is a significant HTF area—refer to Figure 2 on Substack.
Holding below 6645 would target the ESU25 settlement at 6588. Acceptance below 6588 would signal weakness, opening the door for a move into the support area between 6545 and the Weekly Extreme Low of 6520, where buying activity can be expected. This support aligns with the upper end of the prior 4-week balance area, making it a critical area for buyers to defend. Failure to do so could potentially trigger a deeper correction, with the prior 4-week balance low as the next downside target.
Key Levels of Interest
In the upcoming week, I will closely observe the behavior around 6645.
Break and hold above 6645 would target 6700 / 6745 / 6770* / 6810 / 6850
Holding below 6645 would target 6588 / 6545 / 6520* / 6451 / 6365
*Weekly Extremes. I exercise caution when initiating trades outside the Weekly Extremes to avoid making impulsive decisions at unfavorable locations. Essentially, the Weekly Extremes serve as a safeguard against emotionally-driven trades, a state that is less than ideal for making well-informed trading decisions.
Daily plan drops tomorrow. Recharge, reset, and let’s get ready to smash the week.
Thank you smash. Carrying the team on your back.
Thank you as always!