
ES Weekly Plan | Sep 29 - Oct 3, 2025
Recap, Market Context & Key Levels for the Week Ahead

Welcome to this week’s plan. Inside, you’ll find a quick review of last week’s price action, key economic events, market structure, context for the week ahead, and the levels I’ll be focusing on. Let’s get prepared.
Contents
Last Week in Review & Bonus Chart
Economic & Earnings Calendar
Market Structure
Contextual Analysis & Plan
Key Levels of Interest
Last Week in Review & Bonus Chart
Last week’s plan: ES Weekly Plan | September 22-26, 2025
Heading into last week, the main focus was on the three distributions from the prior week and how price would react around them. Immediate interest was on the upper distribution, formed by Friday the 19th’s closing strength—the smallest of the three distributions.
A strong market would build value within the upper distribution, while a less bullish response would involve a return to the middle distribution, rejecting moves back into the lower distribution. In the absence of strength, last week’s VPOC at 6670 could act as a downside magnet.
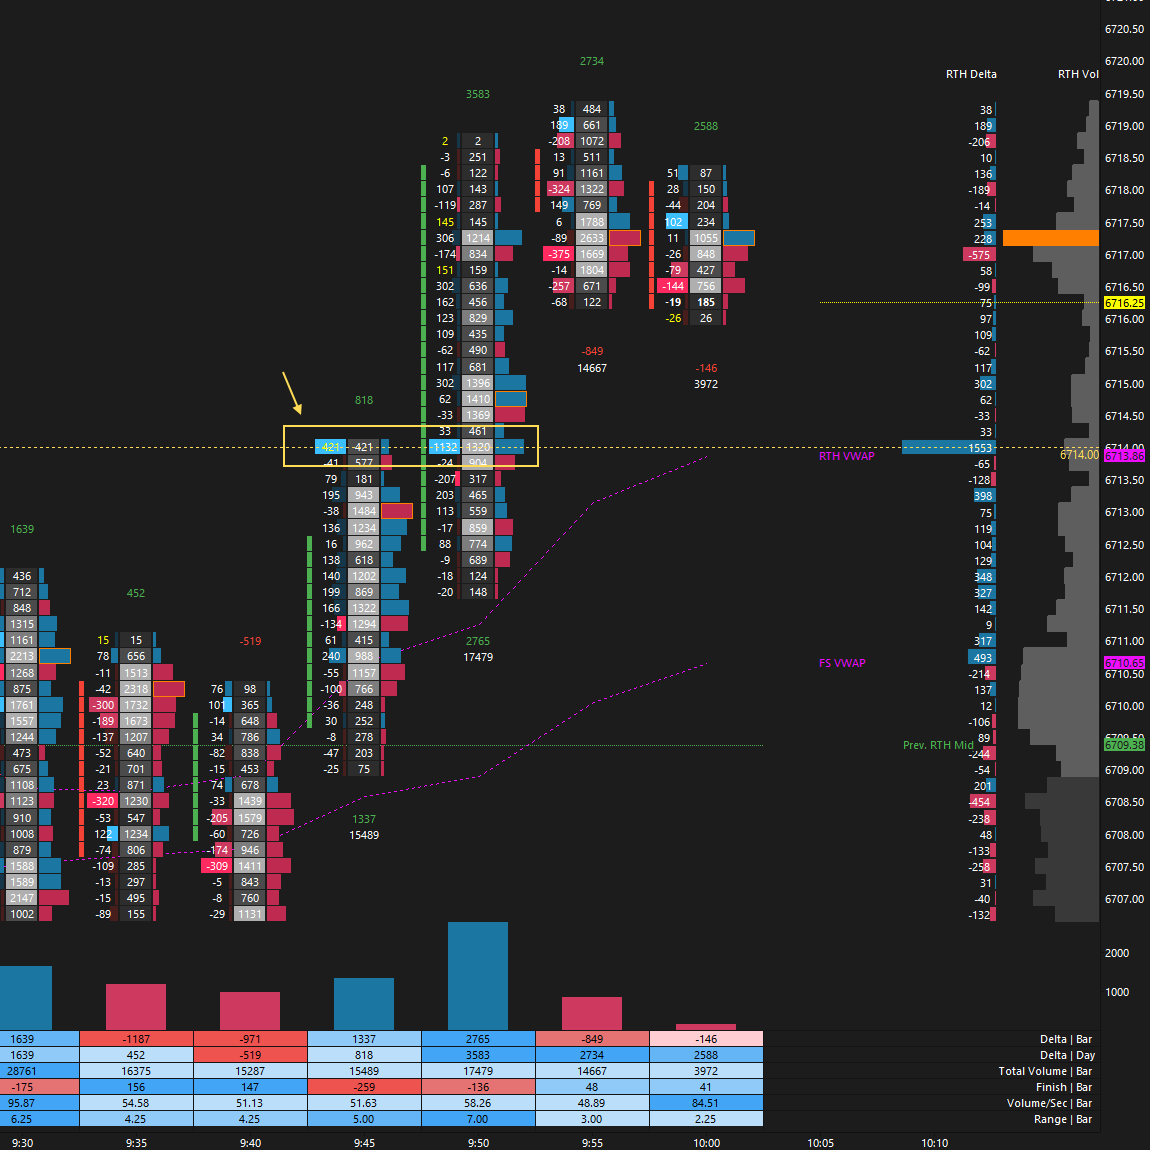
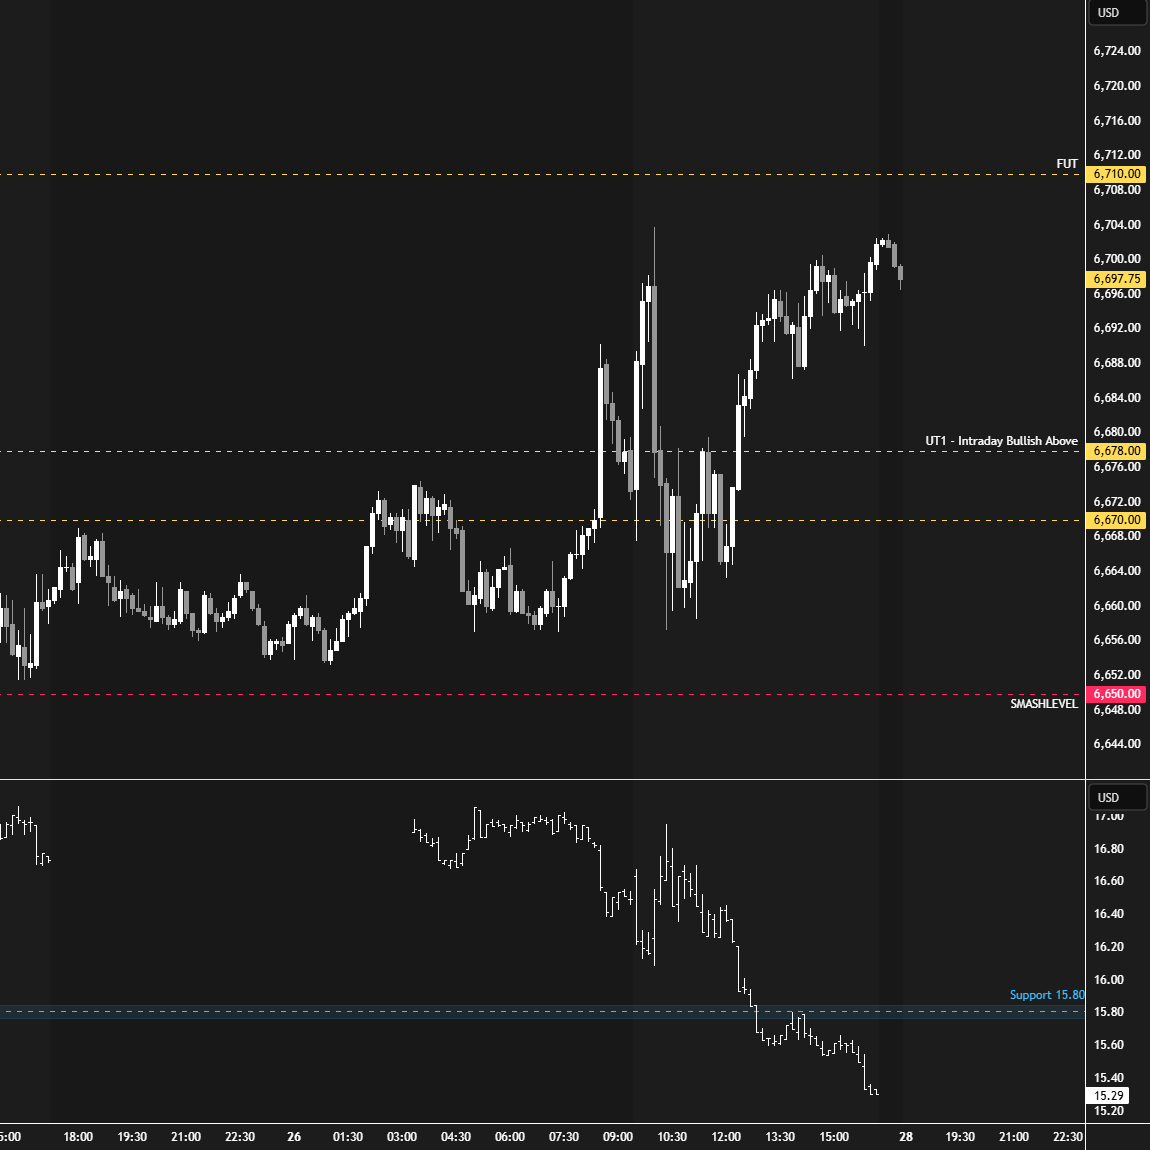
The market kicked off the week within Friday the 19th’s value area on Monday, giving sellers an opportunity to reject that day’s closing strength, which marked the upper of the three distributions. They ultimately failed, triggering a continuation higher, forming a triple distribution trend day, and establishing a new ATH. Notable orderflow activity was observed at the weekly Smashlevel at 6714 (see Figure 1).
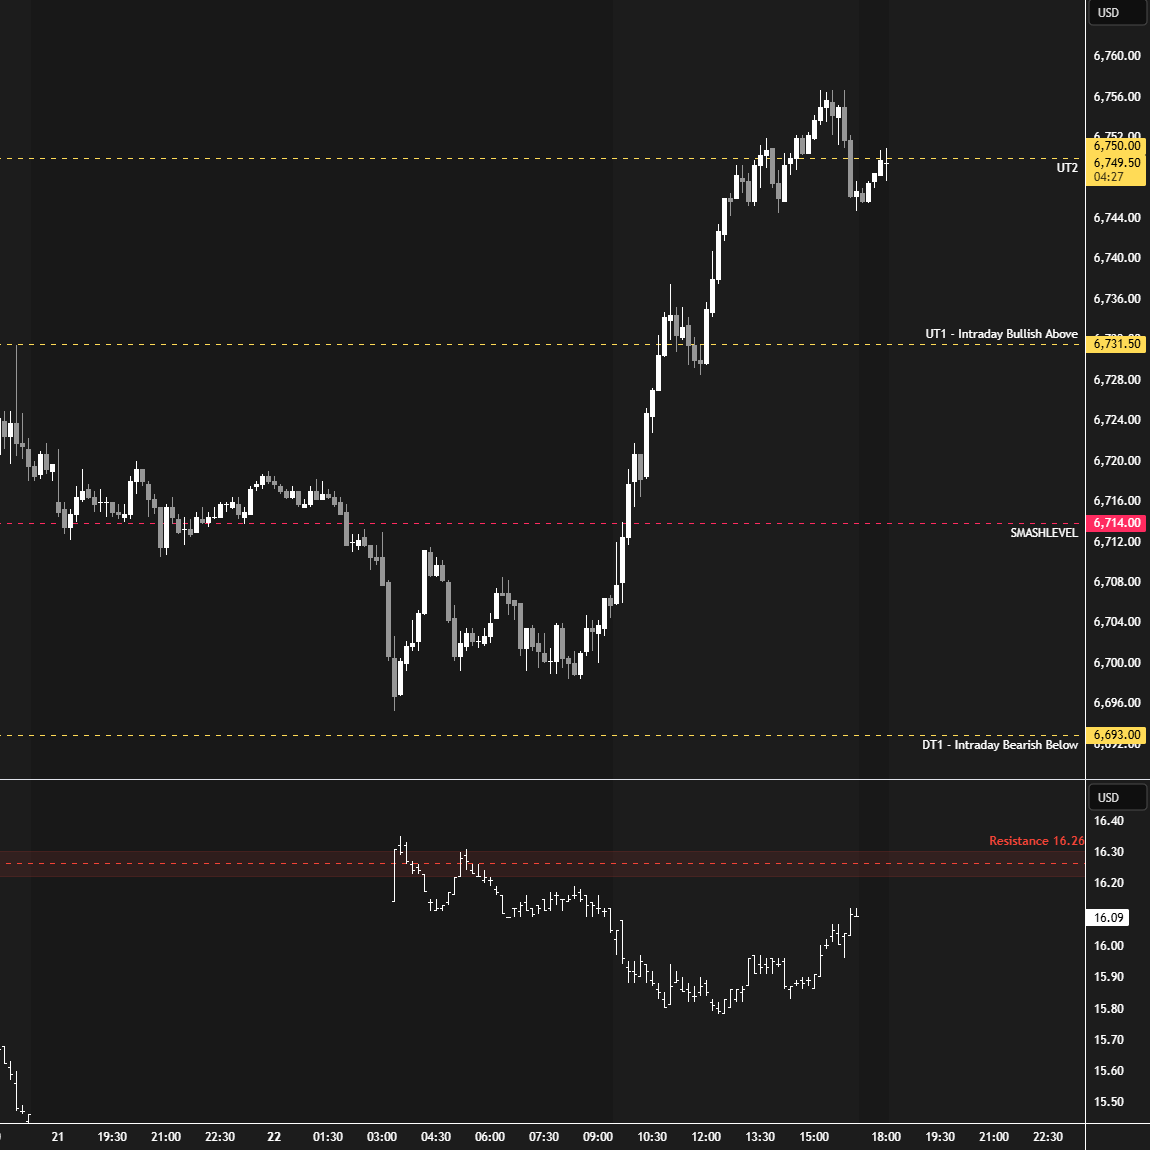
Tuesday’s session established a weak high against Monday’s, after which selling pressure emerged, ultimately retracing Monday’s gains and forming a triple distribution trend day to the downside. Heading into Wednesday, the key question was whether this weakness was simply weak-handed longs getting flushed or driven by stronger sellers. The weak-high formation earlier in the session suggested the former. Further weakness was possible if sellers could defend last week’s high at 6731.
On Wednesday, sellers successfully defended last week’s high at 6731, setting the stage for continued short-term downside pressure. A double distribution trend day was established, with the session closing within last week’s value area.
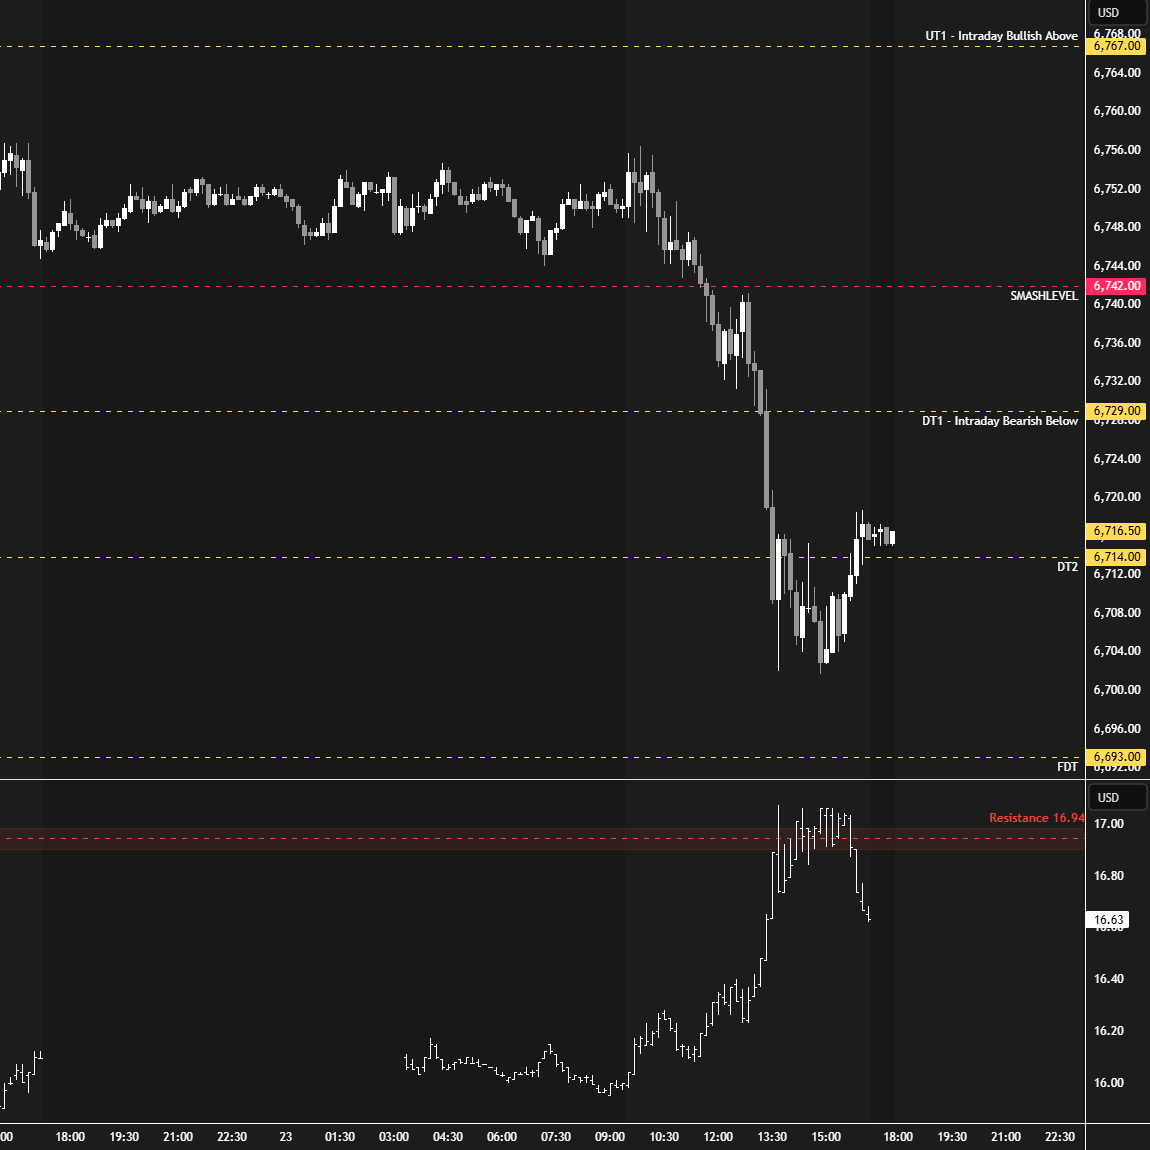
Heading into Thursday, buyers needed acceptance back above Wednesday’s upper distribution, 6706, to negate Wednesday’s trend day, while failure to do so would open the door to traversing last week’s value area toward 6649.
Sellers successfully defended 6706 overnight, resulting in a downside continuation in the RTH session, which opened on a true gap down. Last week’s value area was traversed in the process; however, buyers managed to close the session back above last week’s VAL. The gap at 6678 remained unfilled—our main focus heading into Friday’s session.
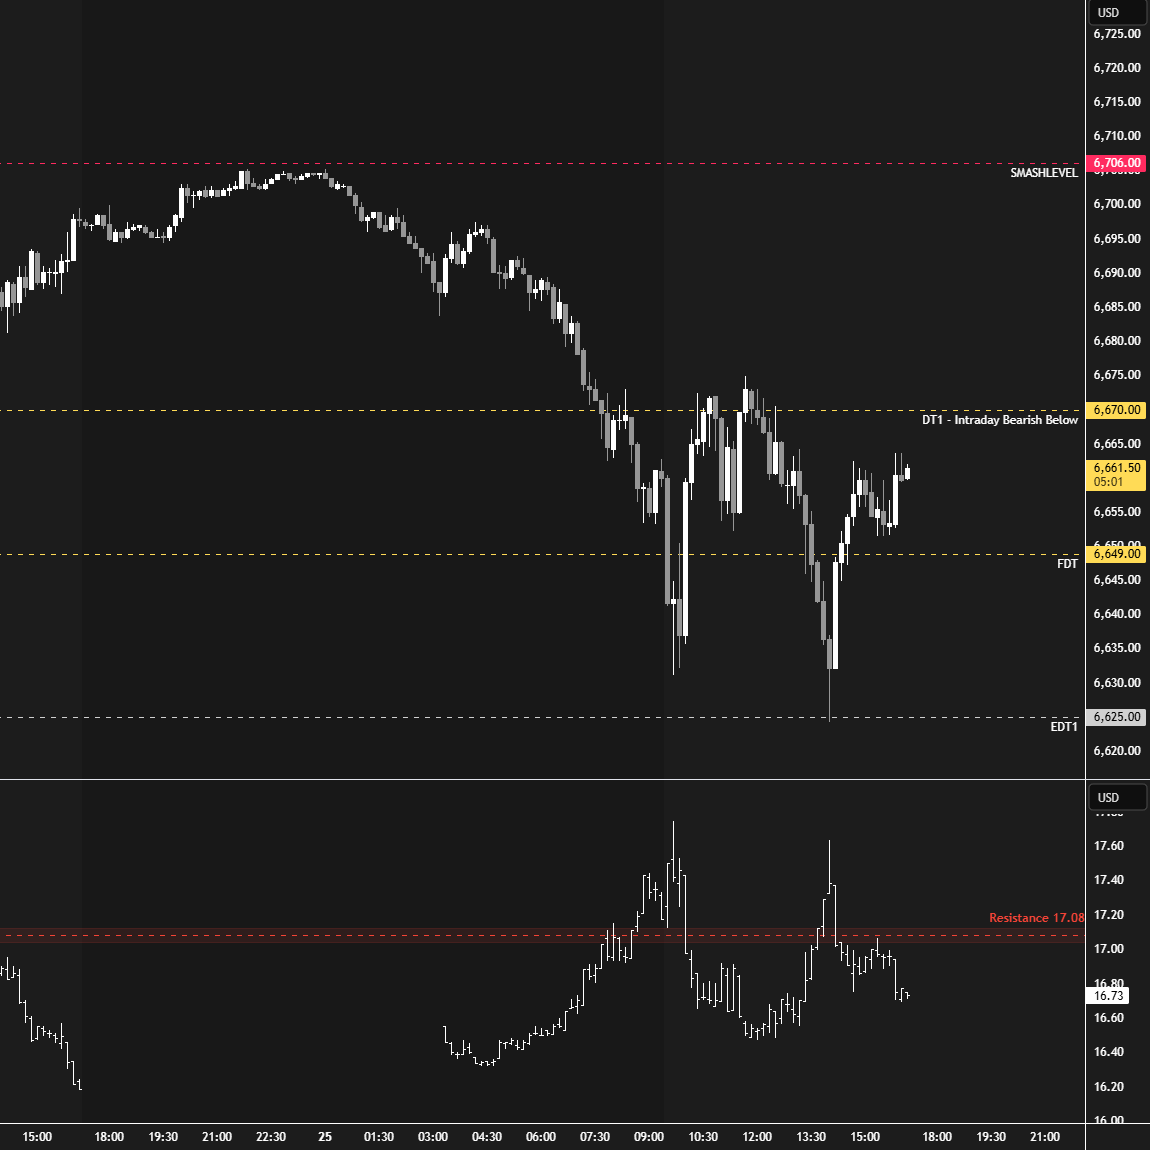
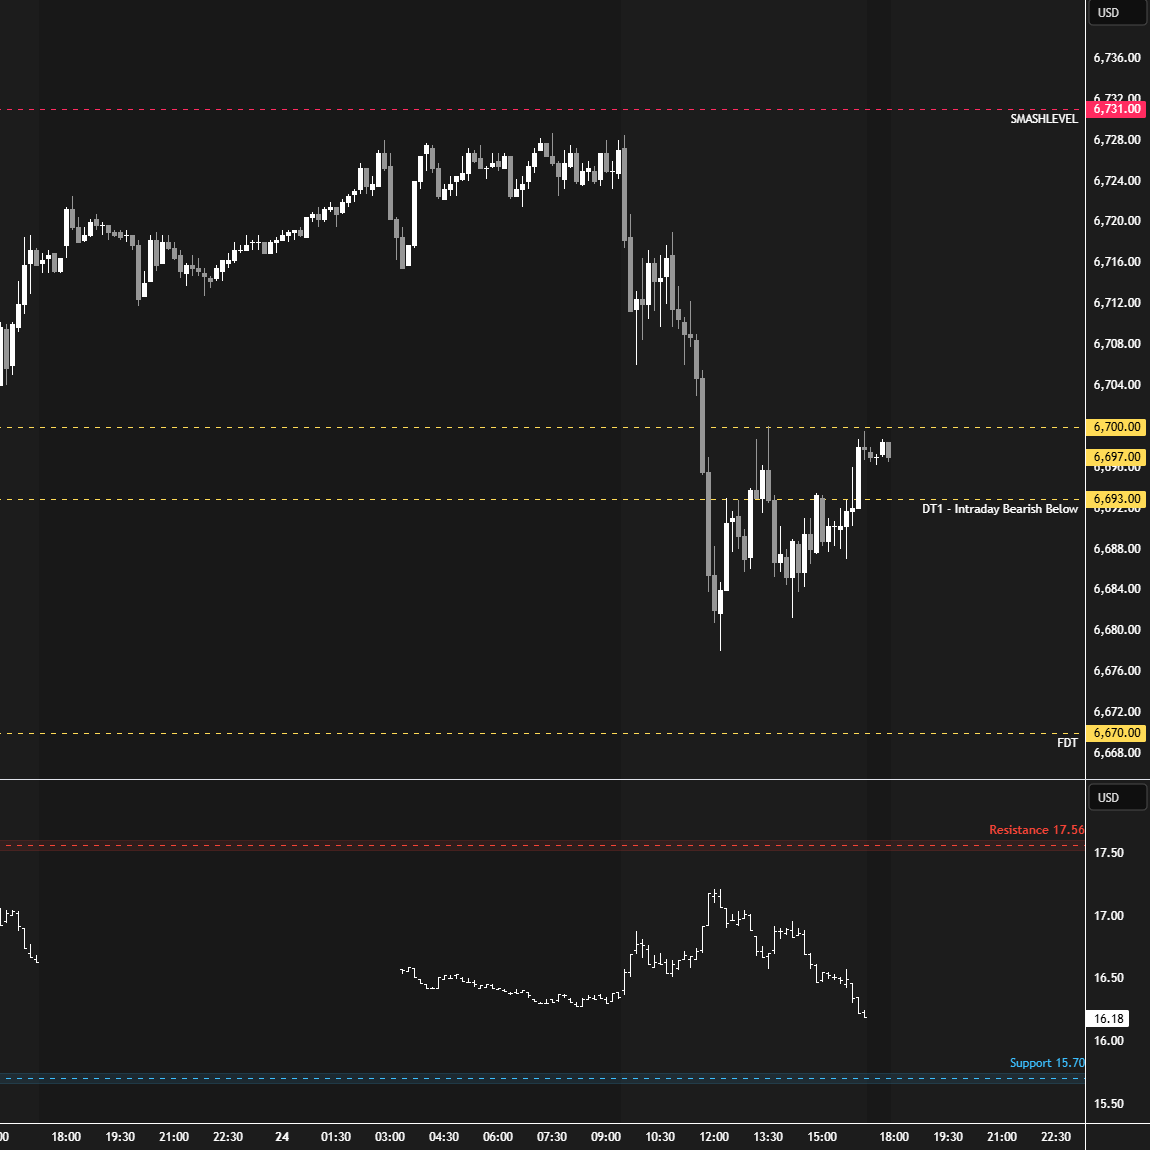
On Friday, the conditions were straightforward: filling the gap and gaining acceptance within Wednesday’s range would have signaled strength, making the 6670–6678 area a key level for sellers to defend. They failed to do so, resulting in a close within Wednesday’s range and keeping Thursday’s sellers trapped. The key question now is whether it is already time to clean up the all-time highs, or if sellers still have an ace up their sleeve. Monday’s RTH ATH at 6756.75 is considered weak due to its alignment with Tuesday’s high and is therefore carried forward as unfinished business.
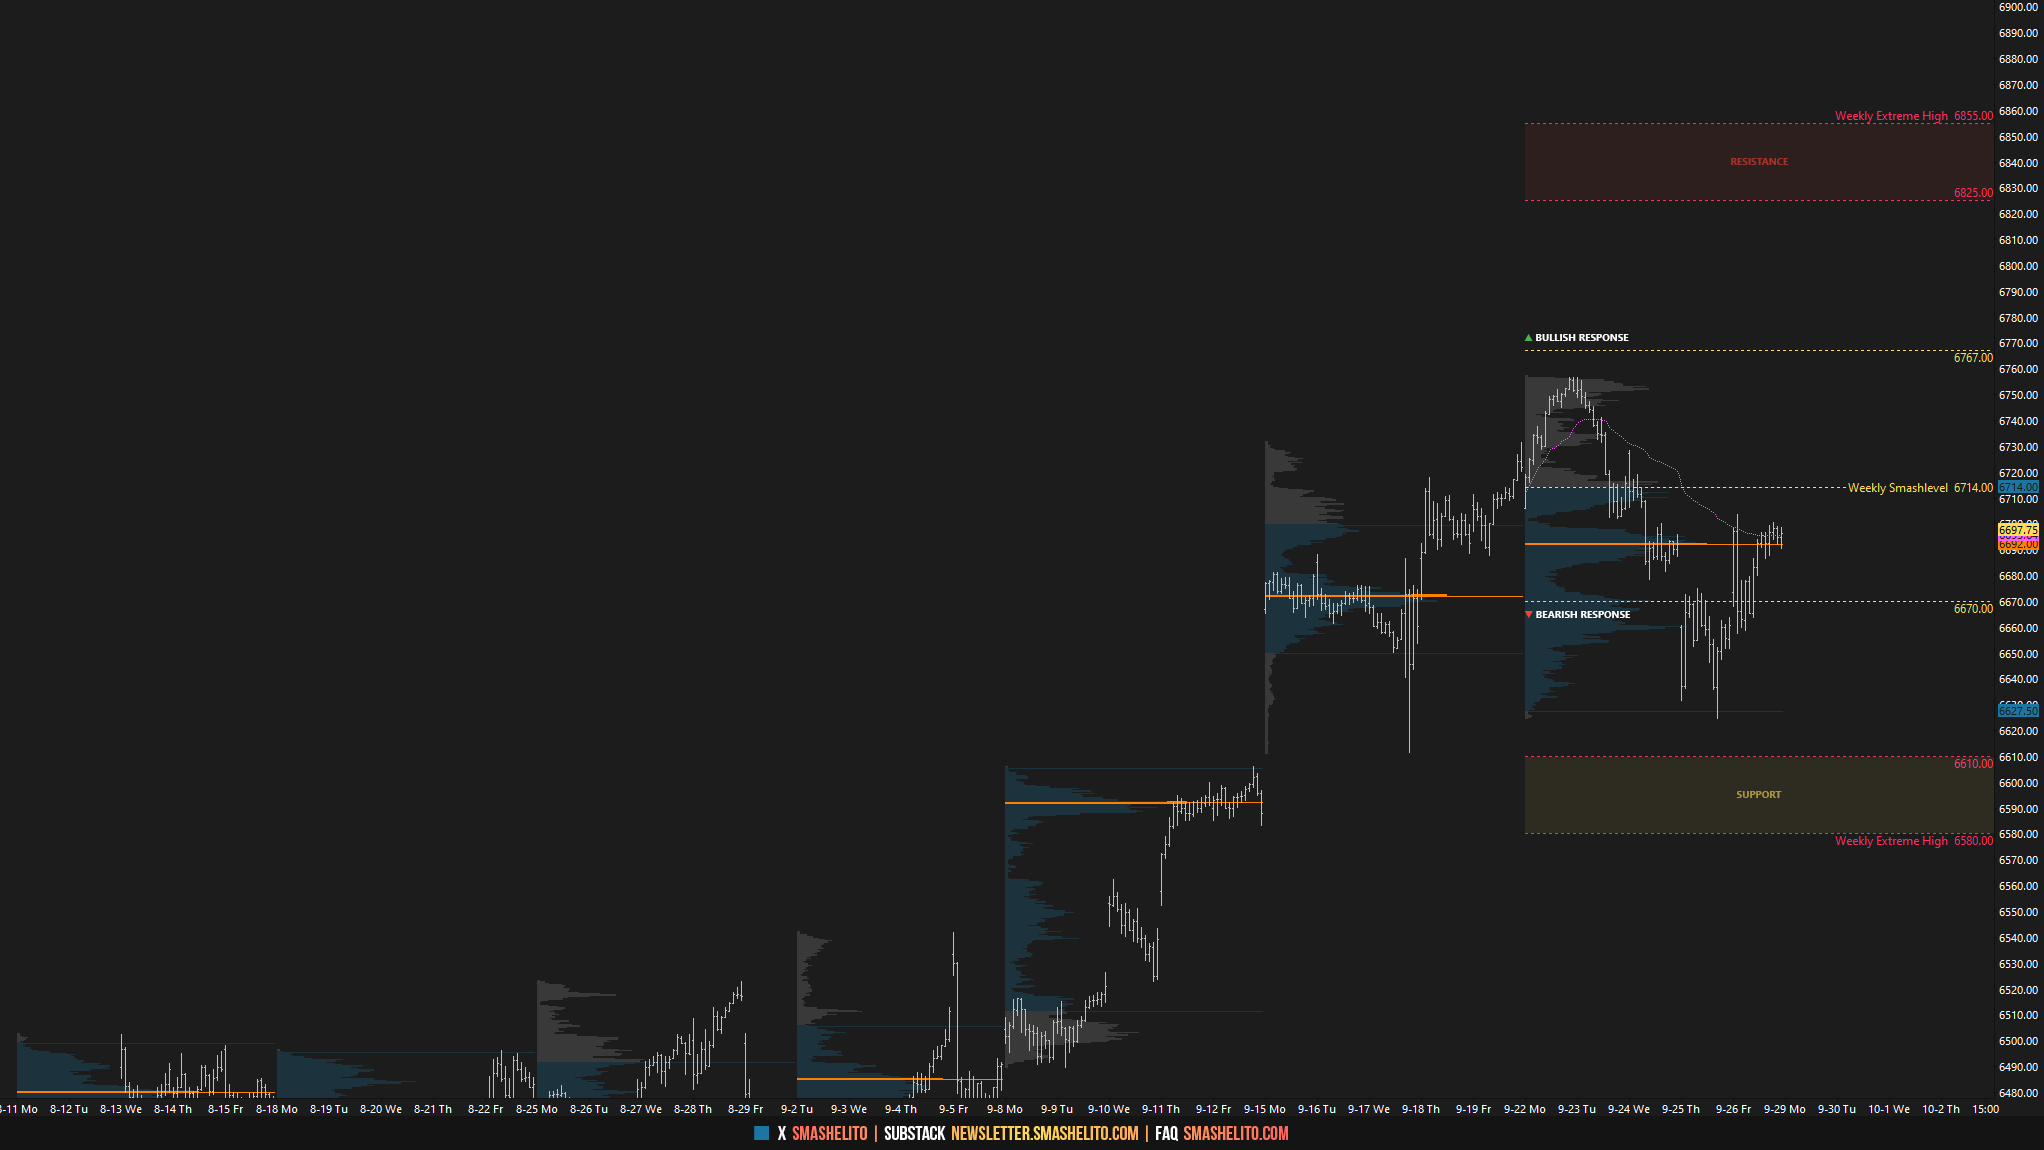
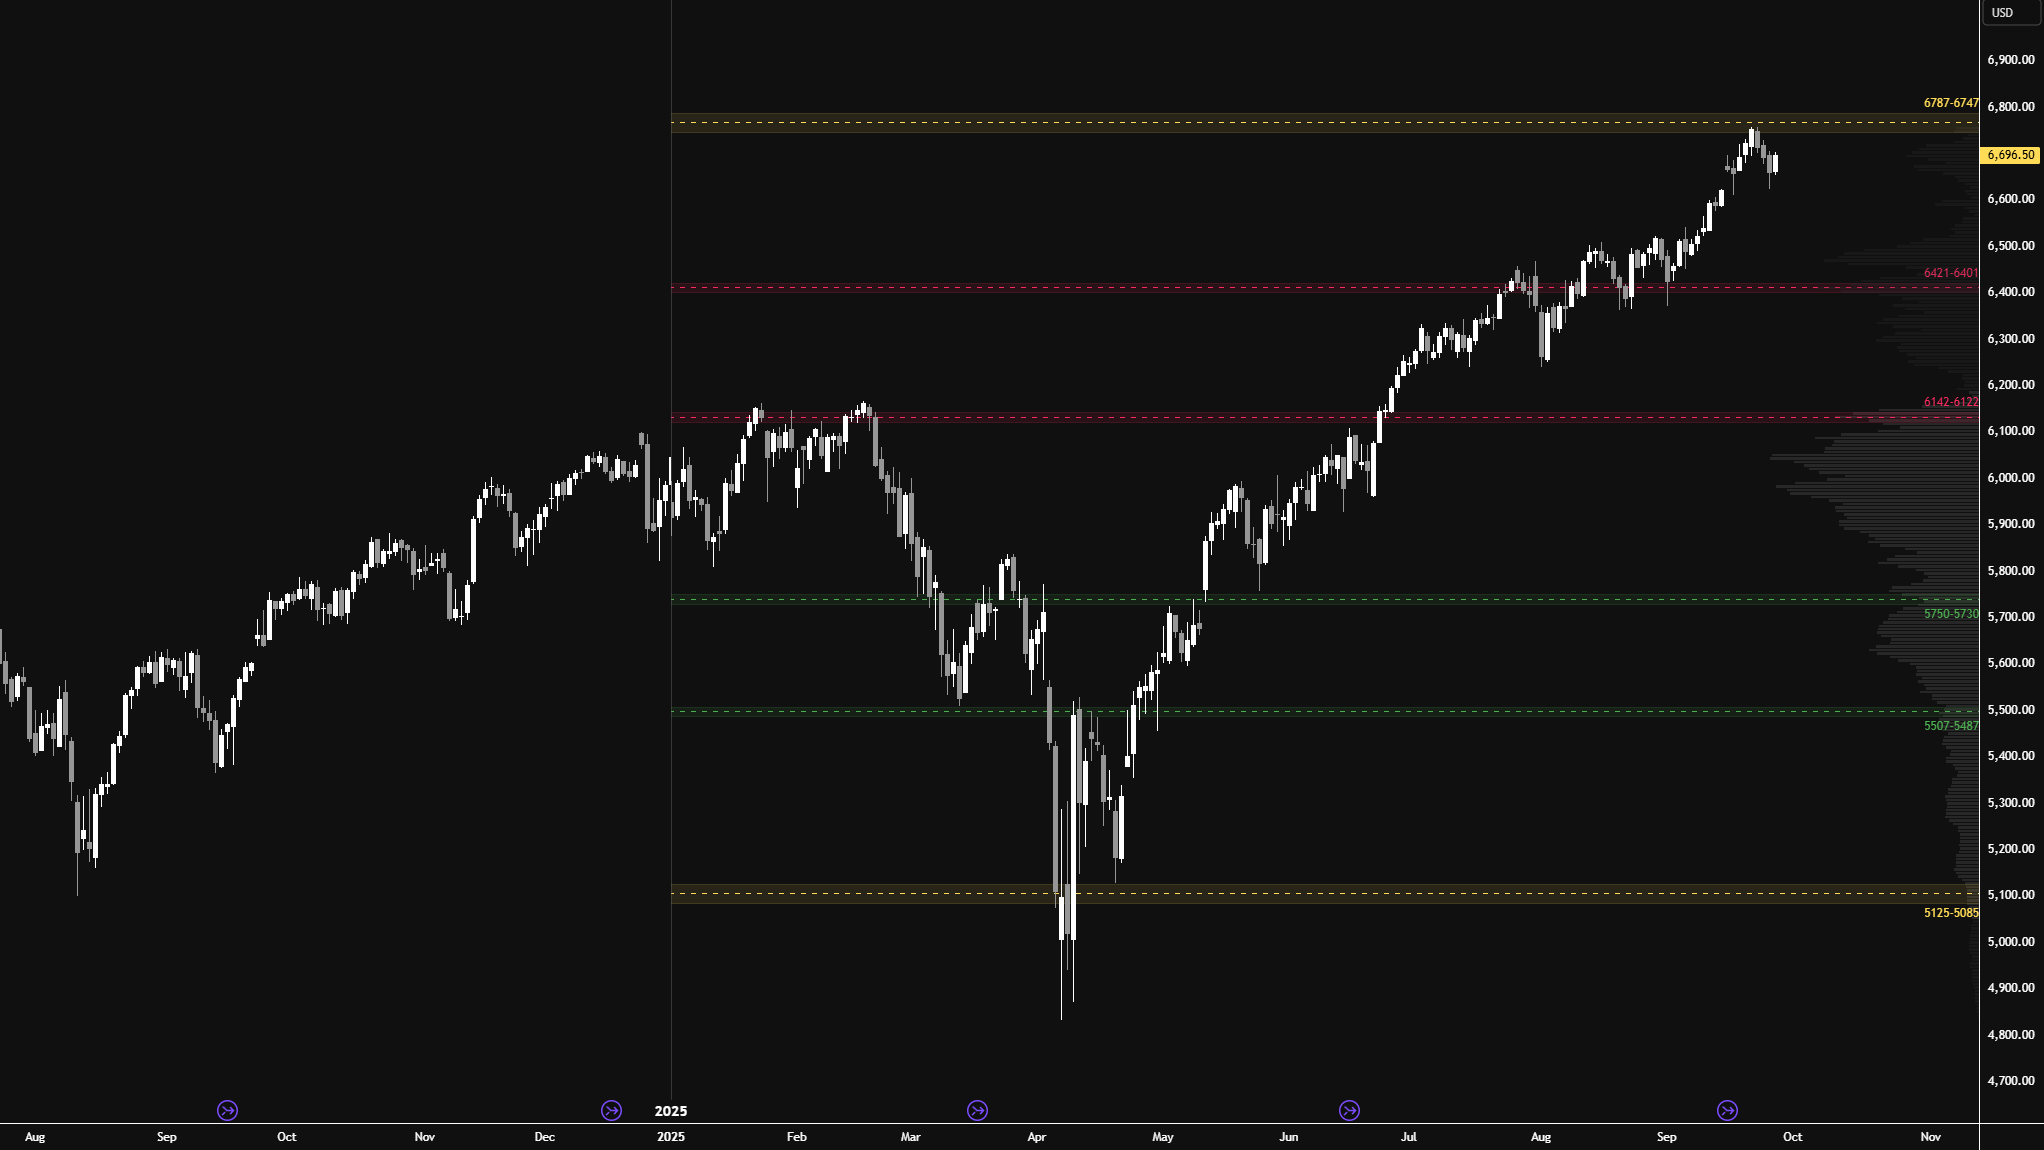
I will continue to include the HTF chart from a good friend of mine (see Figure 2), featuring levels generated by one of his models at the start of 2025. As you can see, this year’s price action has respected these levels remarkably well.
The market tested the 6747–6787 area of interest this week, where selling activity was observed. As discussed last week, the key takeaway from this chart is that the closer we get to the 6747–6787 area (now tested), the less interested I am in initiating any swing trades to the long side. A more reasonable approach would be to wait patiently for pullbacks to 6421–6401 or 6142–6122.
This doesn’t necessarily mean the 6747–6787 area is a place to be short—after all, we remain in a strong bull trend that can’t be ignored. As short-term traders, we are fortunate that we don’t need to maintain a bias for long periods and can adjust and adapt quickly intraday. Short-term traders will also be the first to spot any potential momentum shifts.
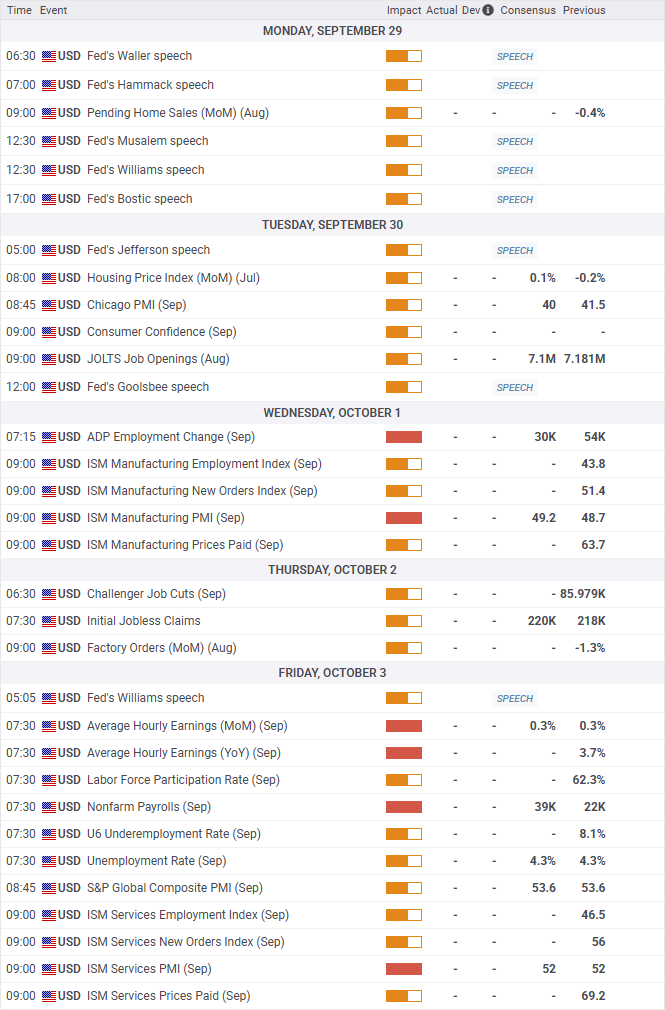
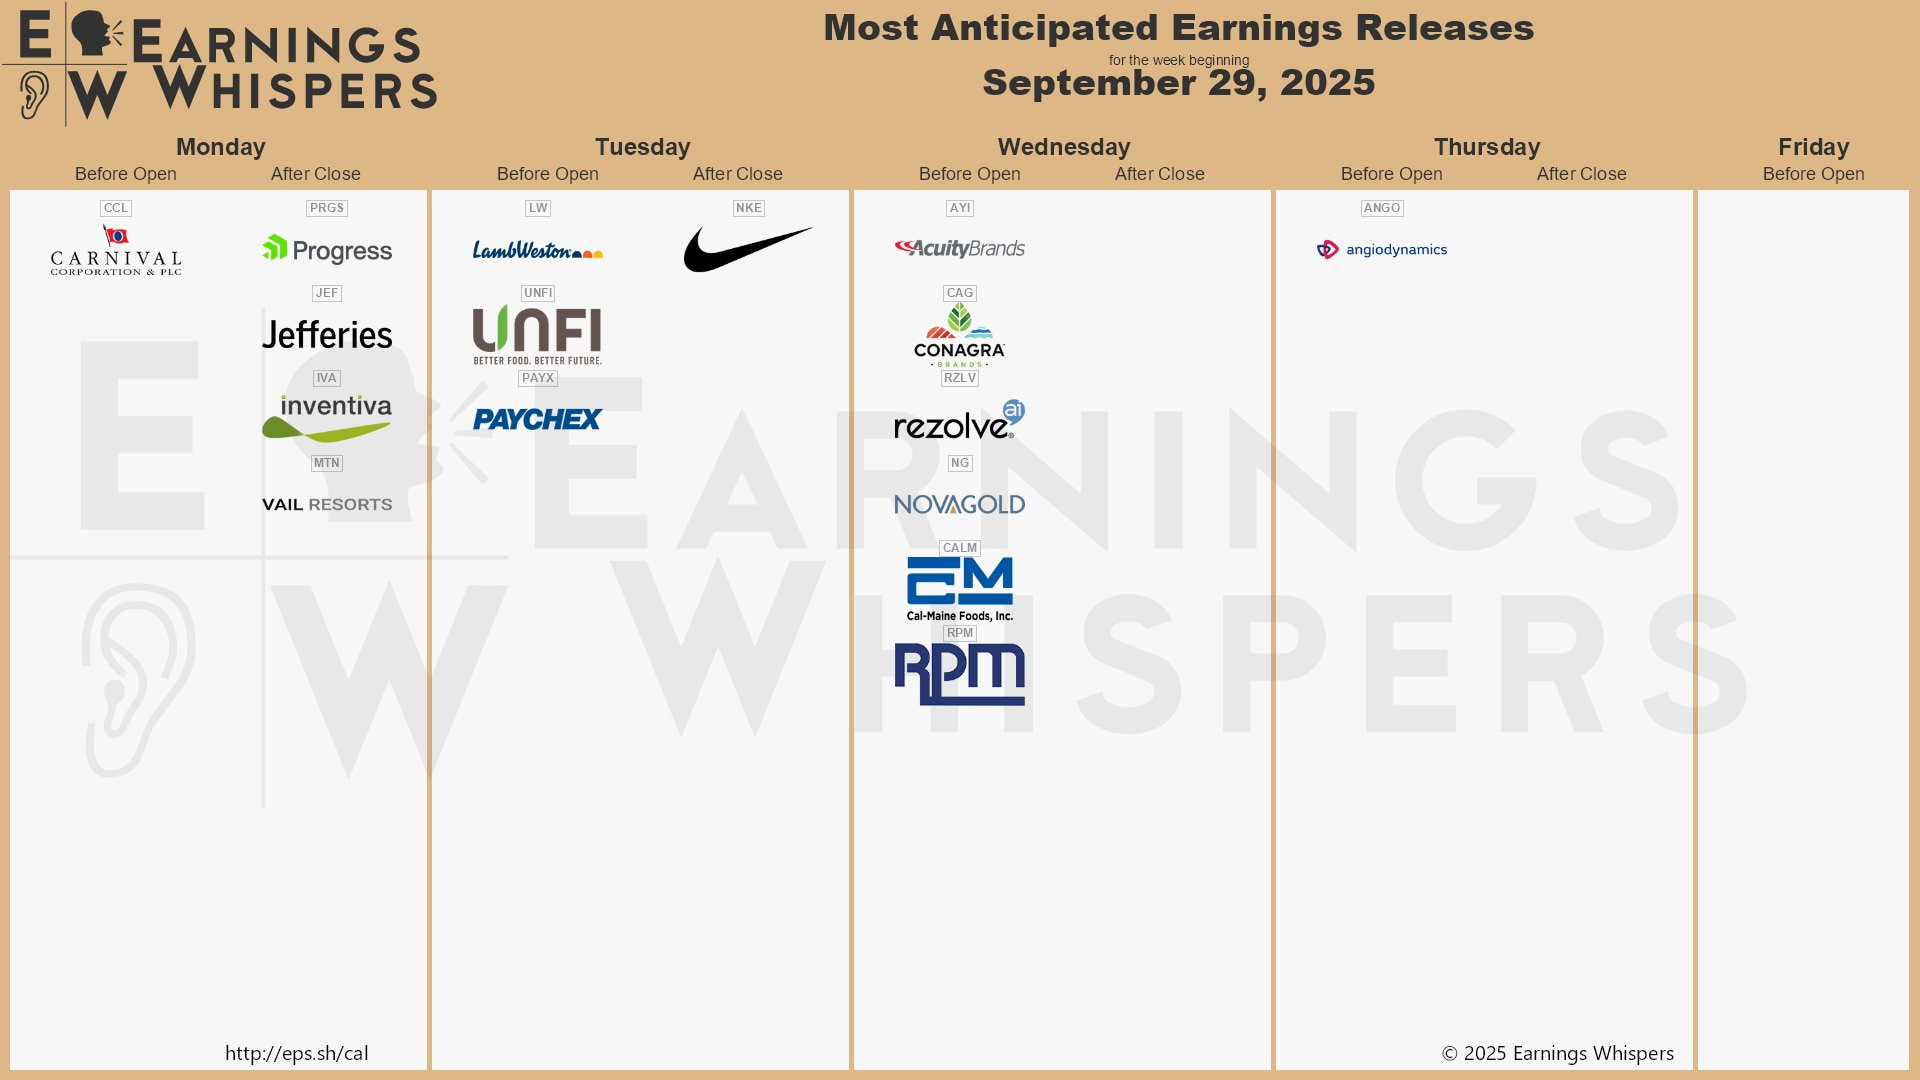
Economic & Earnings Calendar
Market Structure
🟨 Daily: BALANCE → 10-Day → High: 6756.75 / Low: 6611
🟩 Weekly: OTFU → Ends at: 6624.25
🟩 Monthly: OTFU → Ends at: 6239.50
Balance: A market condition where price consolidates within a defined range, reflecting indecision as the market awaits more market-generated information. We apply balance guidelines—favoring fade trades at range extremes (highs/lows) and preparing for breakout setups if balance resolves.
One-Time Framing Up (OTFU): A market condition where each subsequent bar forms a higher low, signaling a strong upward trend.
One-Time Framing Down (OTFD): A market condition where each subsequent bar forms a lower high, signaling a strong downward trend.
Contextual Analysis & Plan
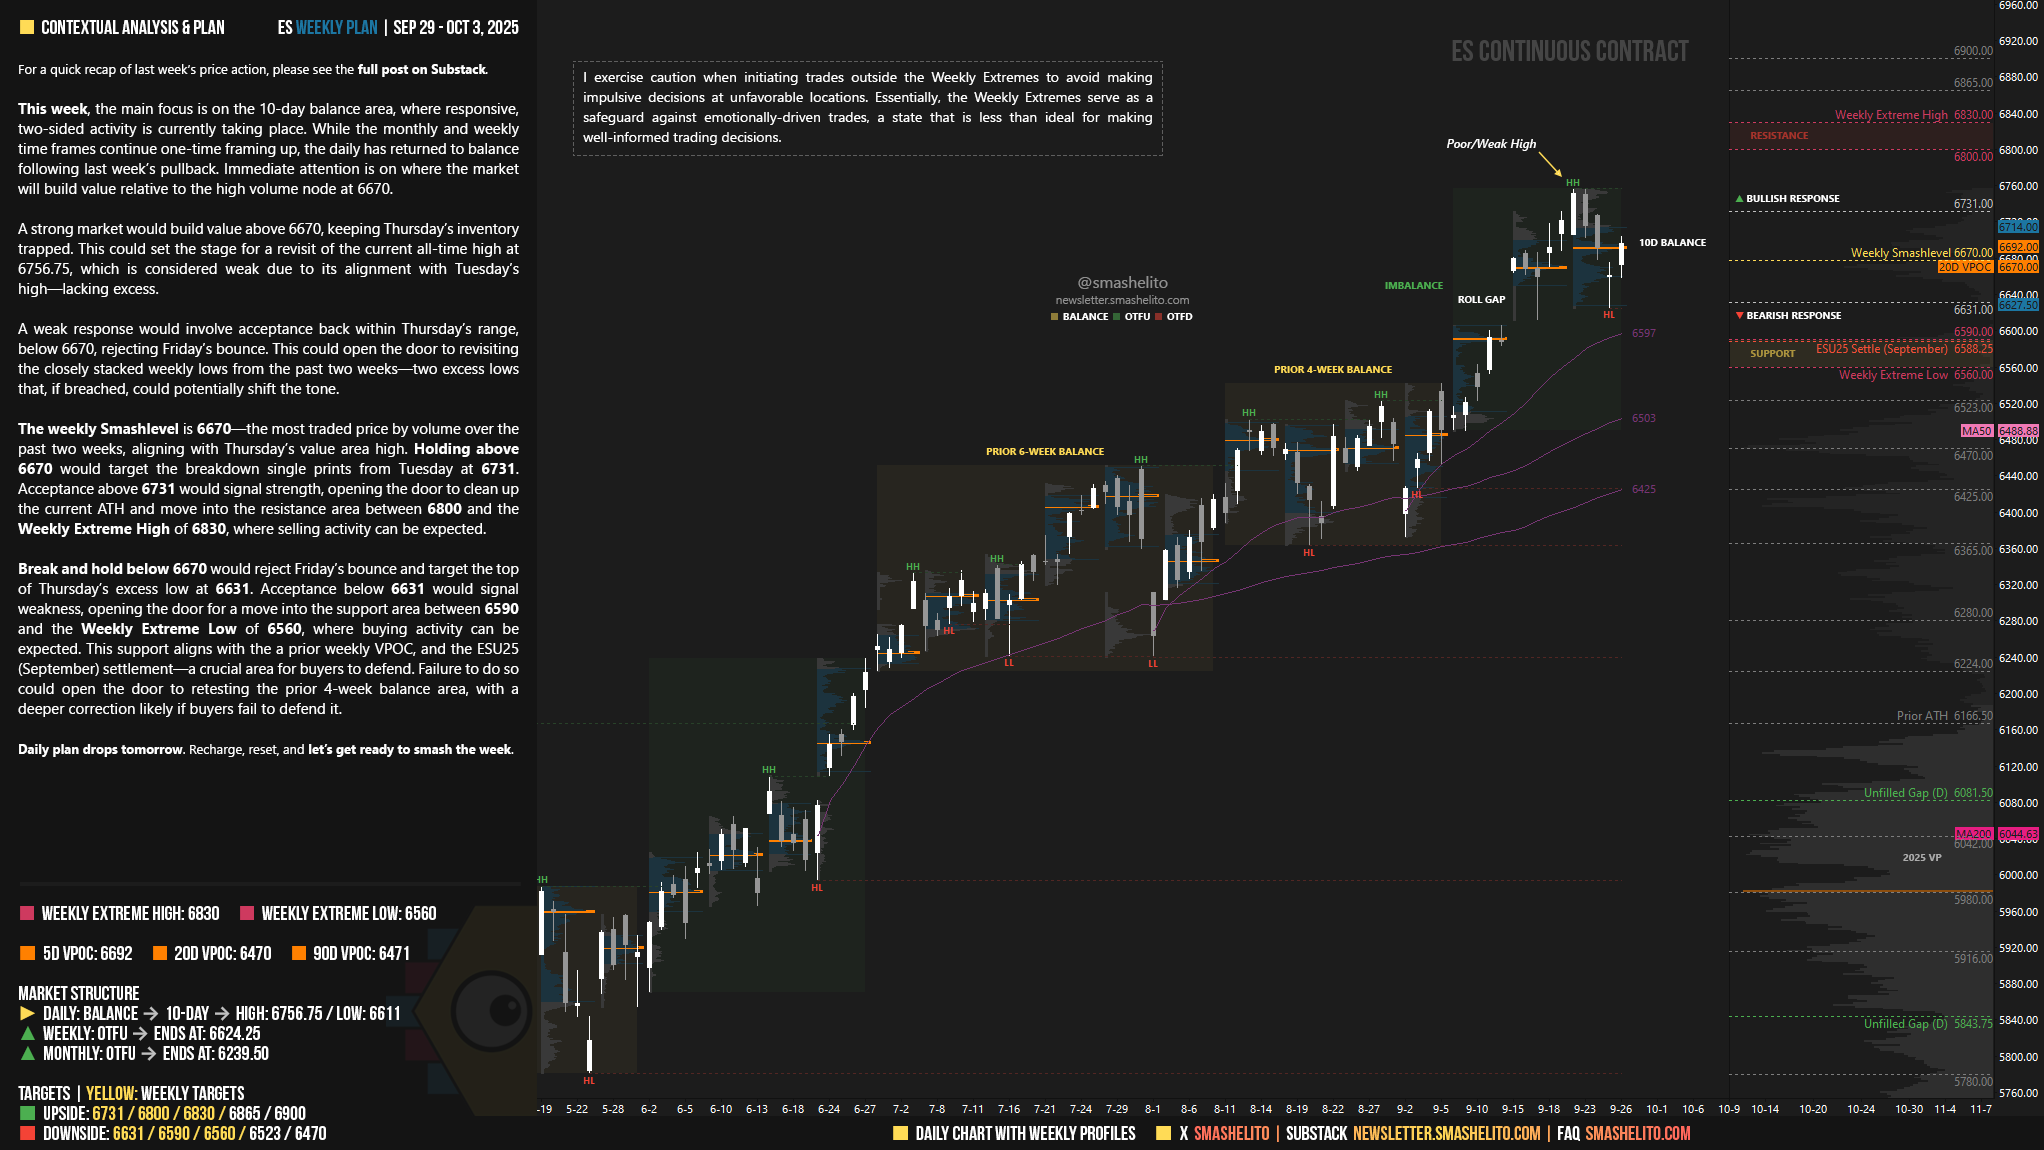
This week, the main focus is on the 10-day balance area, where responsive, two-sided activity is currently taking place. While the monthly and weekly time frames continue one-time framing up, the daily has returned to balance following last week’s pullback. Immediate attention is on where the market will build value relative to the high volume node at 6670.
A strong market would build value above 6670, keeping Thursday’s inventory trapped. This could set the stage for a revisit of the current all-time high at 6756.75, which is considered weak due to its alignment with Tuesday’s high—lacking excess.
A weak response would involve acceptance back within Thursday’s range, below 6670, rejecting Friday’s bounce. This could open the door to revisiting the closely stacked weekly lows from the past two weeks—two excess lows that, if breached, could potentially shift the tone.
The weekly Smashlevel is 6670—the most traded price by volume over the past two weeks, aligning with Thursday’s value area high. Holding above 6670 would target the breakdown single prints from Tuesday at 6731. Acceptance above 6731 would signal strength, opening the door to clean up the current ATH and move into the resistance area between 6800 and the Weekly Extreme High of 6830, where selling activity can be expected.
Break and hold below 6670 would reject Friday’s bounce and target the top of Thursday’s excess low at 6631. Acceptance below 6631 would signal weakness, opening the door for a move into the support area between 6590 and the Weekly Extreme Low of 6560, where buying activity can be expected. This support aligns with the a prior weekly VPOC, and the ESU25 (September) settlement—a crucial area for buyers to defend. Failure to do so could open the door to retesting the prior 4-week balance area, with a deeper correction likely if buyers fail to defend it.
Key Levels of Interest
In the upcoming week, I will closely observe the behavior around 6670.
Holding above 6670 would target 6731 / 6800 / 6830* / 6865 / 6900
Break and hold below 6670 would target 6631 / 6590 / 6560* / 6523 / 6470
*Weekly Extremes. I exercise caution when initiating trades outside the Weekly Extremes to avoid making impulsive decisions at unfavorable locations. Essentially, the Weekly Extremes serve as a safeguard against emotionally-driven trades, a state that is less than ideal for making well-informed trading decisions.
Daily plan drops tomorrow. Recharge, reset, and let’s get ready to smash the week.
Thank you Smash! Love that HTF chart, interesting times!
thank you for your great work:)