
ES Weekly Plan | October 6-10, 2025
Recap, Market Context & Key Levels for the Week Ahead

Welcome to this week’s plan. Inside, you’ll find a quick review of last week’s price action, key economic events, market structure, context for the week ahead, and the levels I’ll be focusing on. Let’s get prepared.
Contents
Last Week in Review & Bonus Chart
Economic & Earnings Calendar
Market Structure
Contextual Analysis & Plan
Key Levels of Interest
Last Week in Review & Bonus Chart
Last week’s plan: ES Weekly Plan | Sep 29 - Oct 3, 2025
Heading into last week, the main focus was on the 10-day balance area, where responsive, two-sided activity was taking place. While the monthly and weekly continued their one-time framing up, the daily had returned to balance, setting the stage for setups to develop in both directions. Immediate attention was on where the market would build value relative to the high volume node at 6670.
A strong market would build value above 6670, opening the door to revisiting the all-time high at 6757, which was considered weak and lacking meaningful excess. Conversely, a weak response would involve traction below 6670, setting the stage for further weakness.
Monday’s session saw a grind higher, cleaning up the structure from the prior week. The market opened on a true gap up, which was filled, but sellers failed to gain traction within the prior day’s range, leading to a closing push higher.
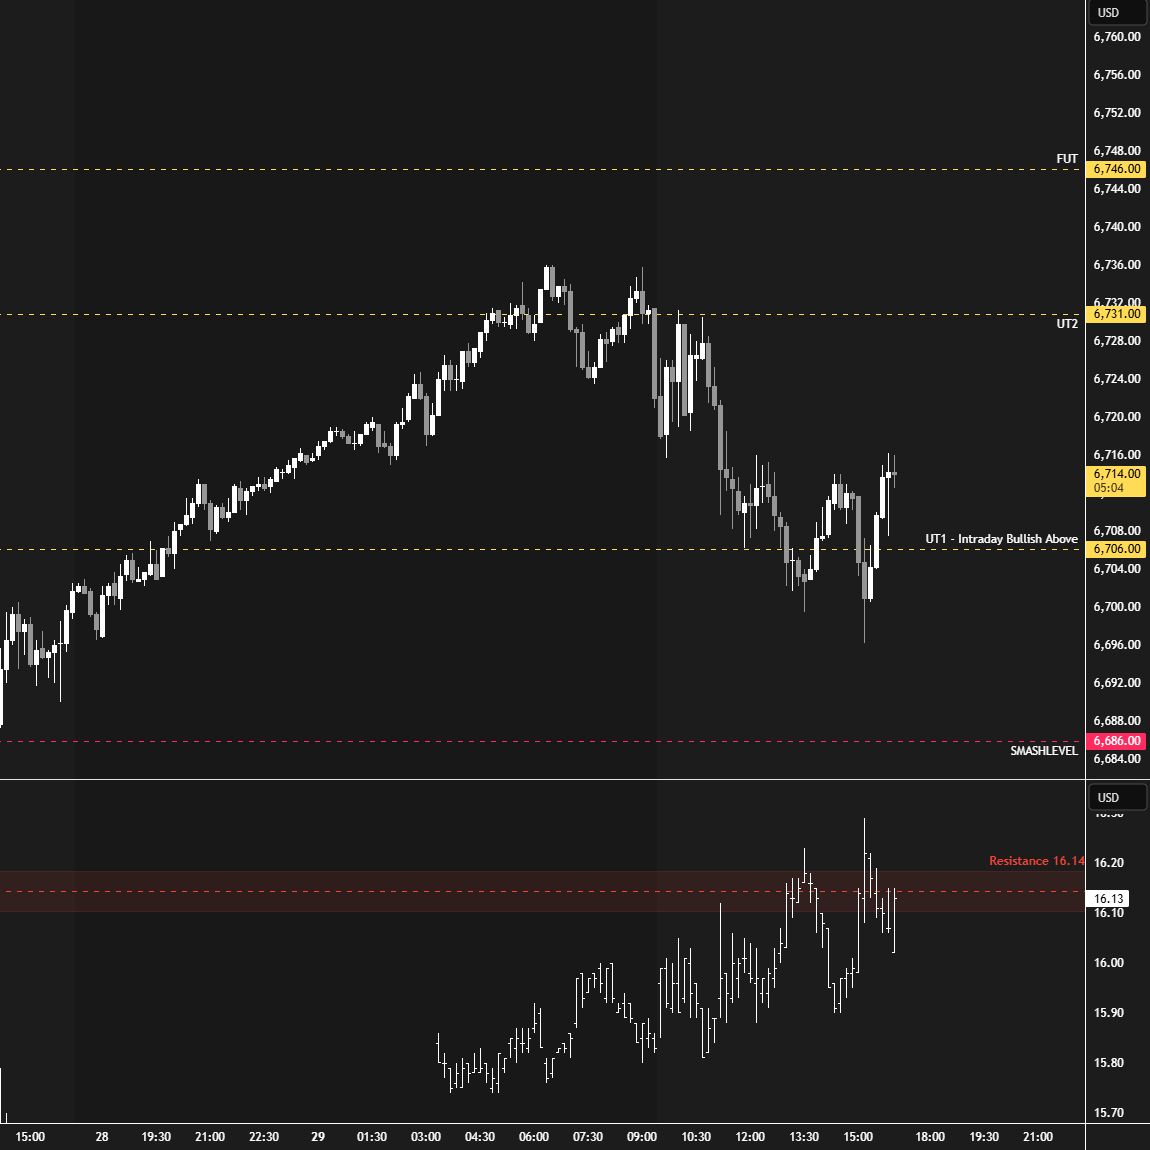
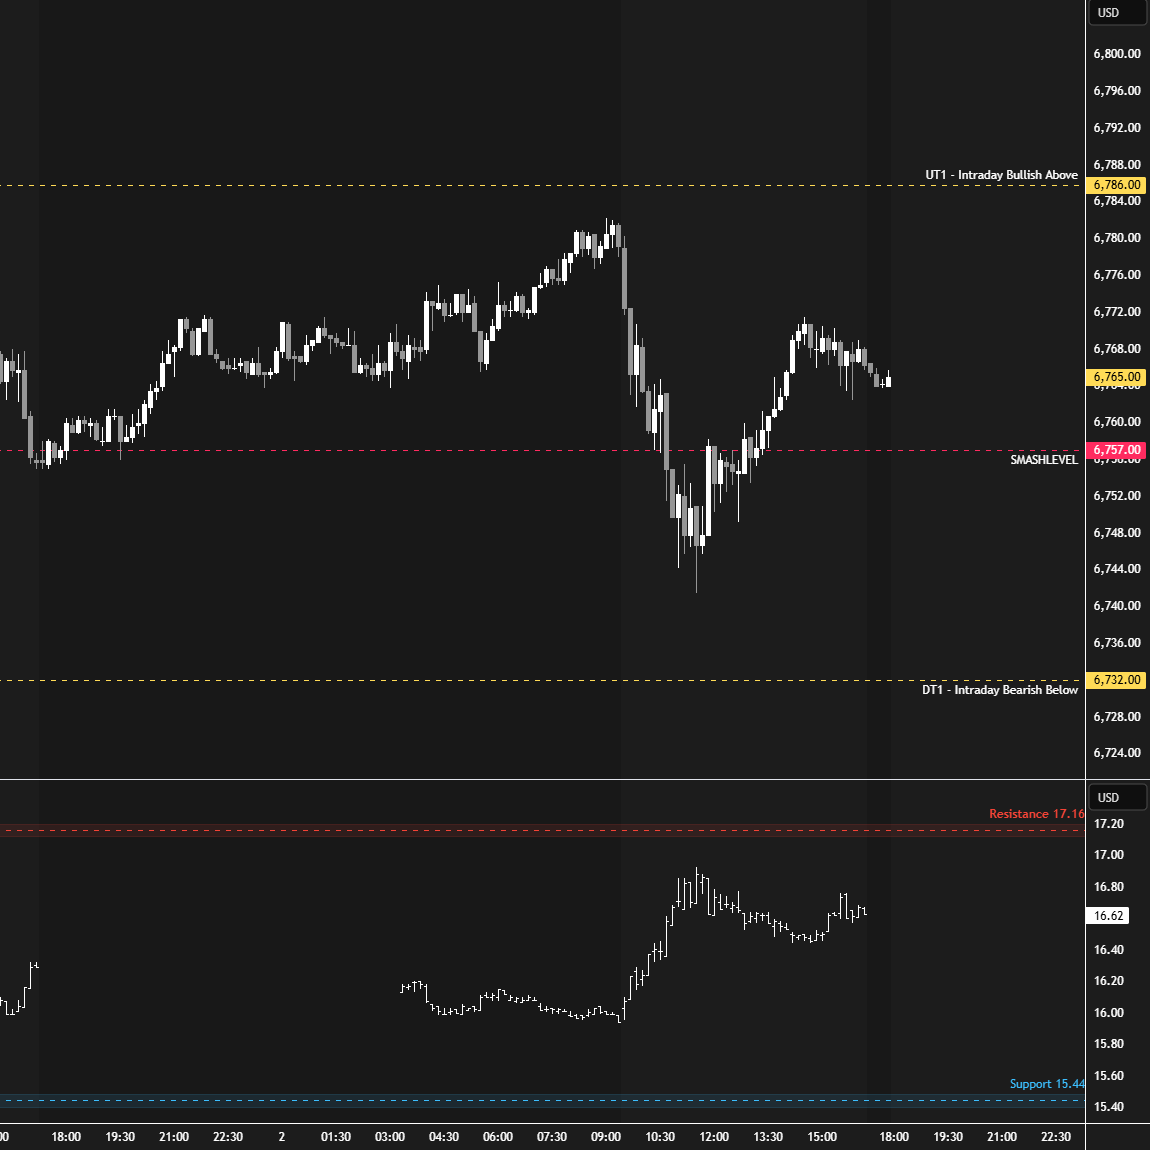
Tuesday was quiet overall, ending with a sharp closing EOM/EOQ squeeze that left poor structure and an upward spike (see Figure 1). The spike base at 6732 lined up with the lower end of the upper distribution from Tuesday the 23rd—a key level for buyers to reclaim to target unfinished business at the all-time highs.
Change took place on Wednesday as the market attempted to move out of balance, breaking out of the multi-day balance and cleaning up the weak all-time high at 6757 in the process. The key was now to monitor for continuation—or lack thereof—making the prior ATH at 6757 a critical level.
Thursday’s opened on a true gap up, which buyers failed to sustain. Sellers rejected the gap and broke the crucial 6757 level, which should have triggered weakness—but didn’t. This provided valuable market-generated information, showing that stronger sellers were not present. An overnight ATH printed at 6782.25, serving as a reference to carry forward.
Friday started by cleaning up the overnight ATH at 6782.25. The weekly resistance zone between 6800–6830 was tagged, triggering weakness. Morning gains were erased in the afternoon as sellers tested 6757, where responsive buyers stepped in. The focus now: can 6757 continue to hold, or will a break invite further weakness?
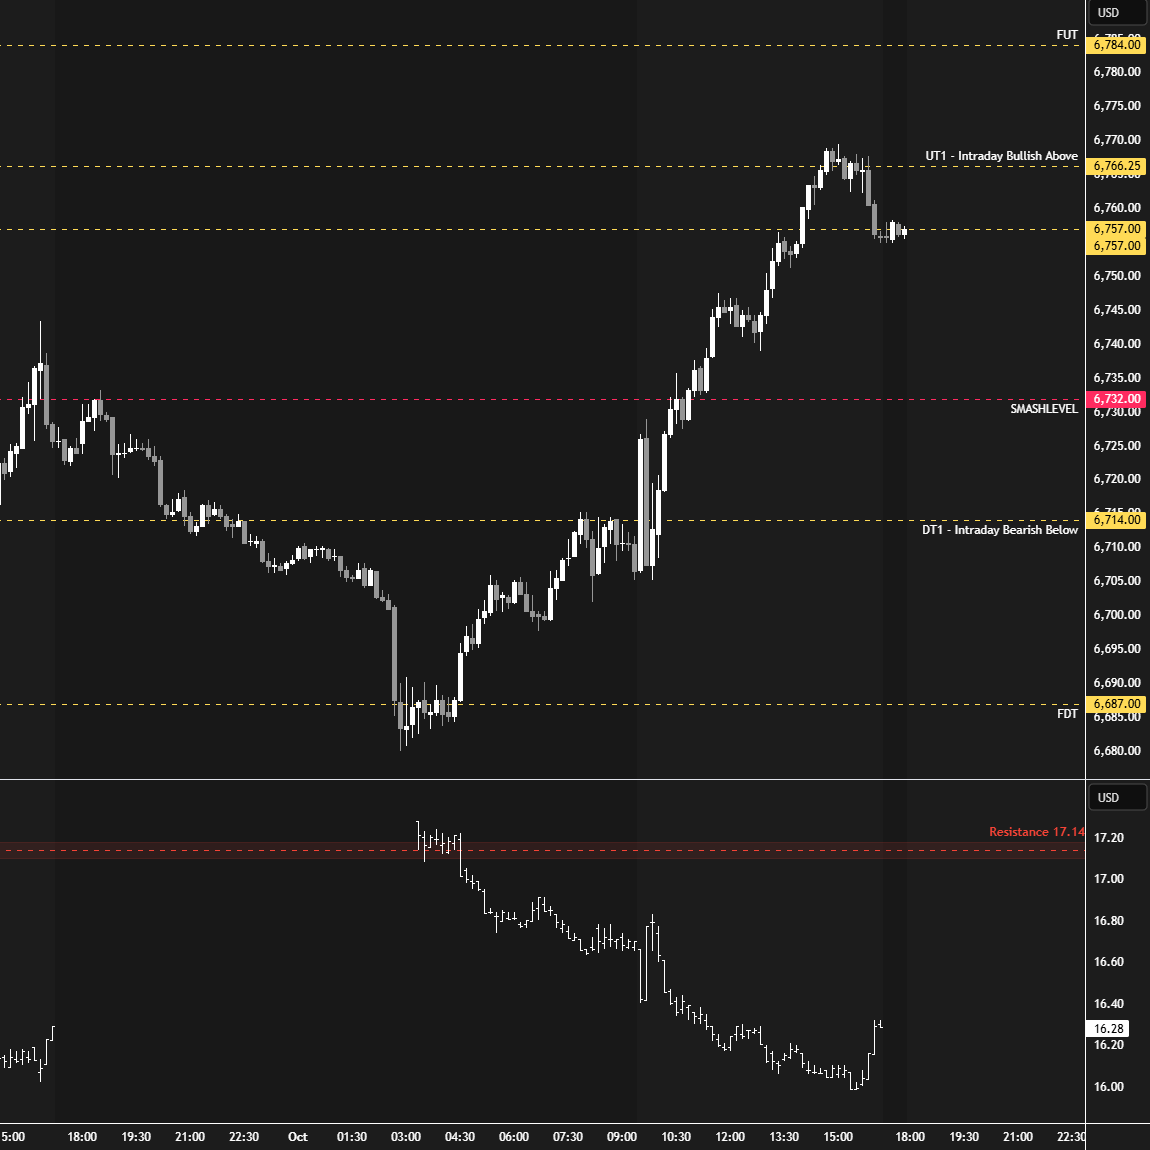
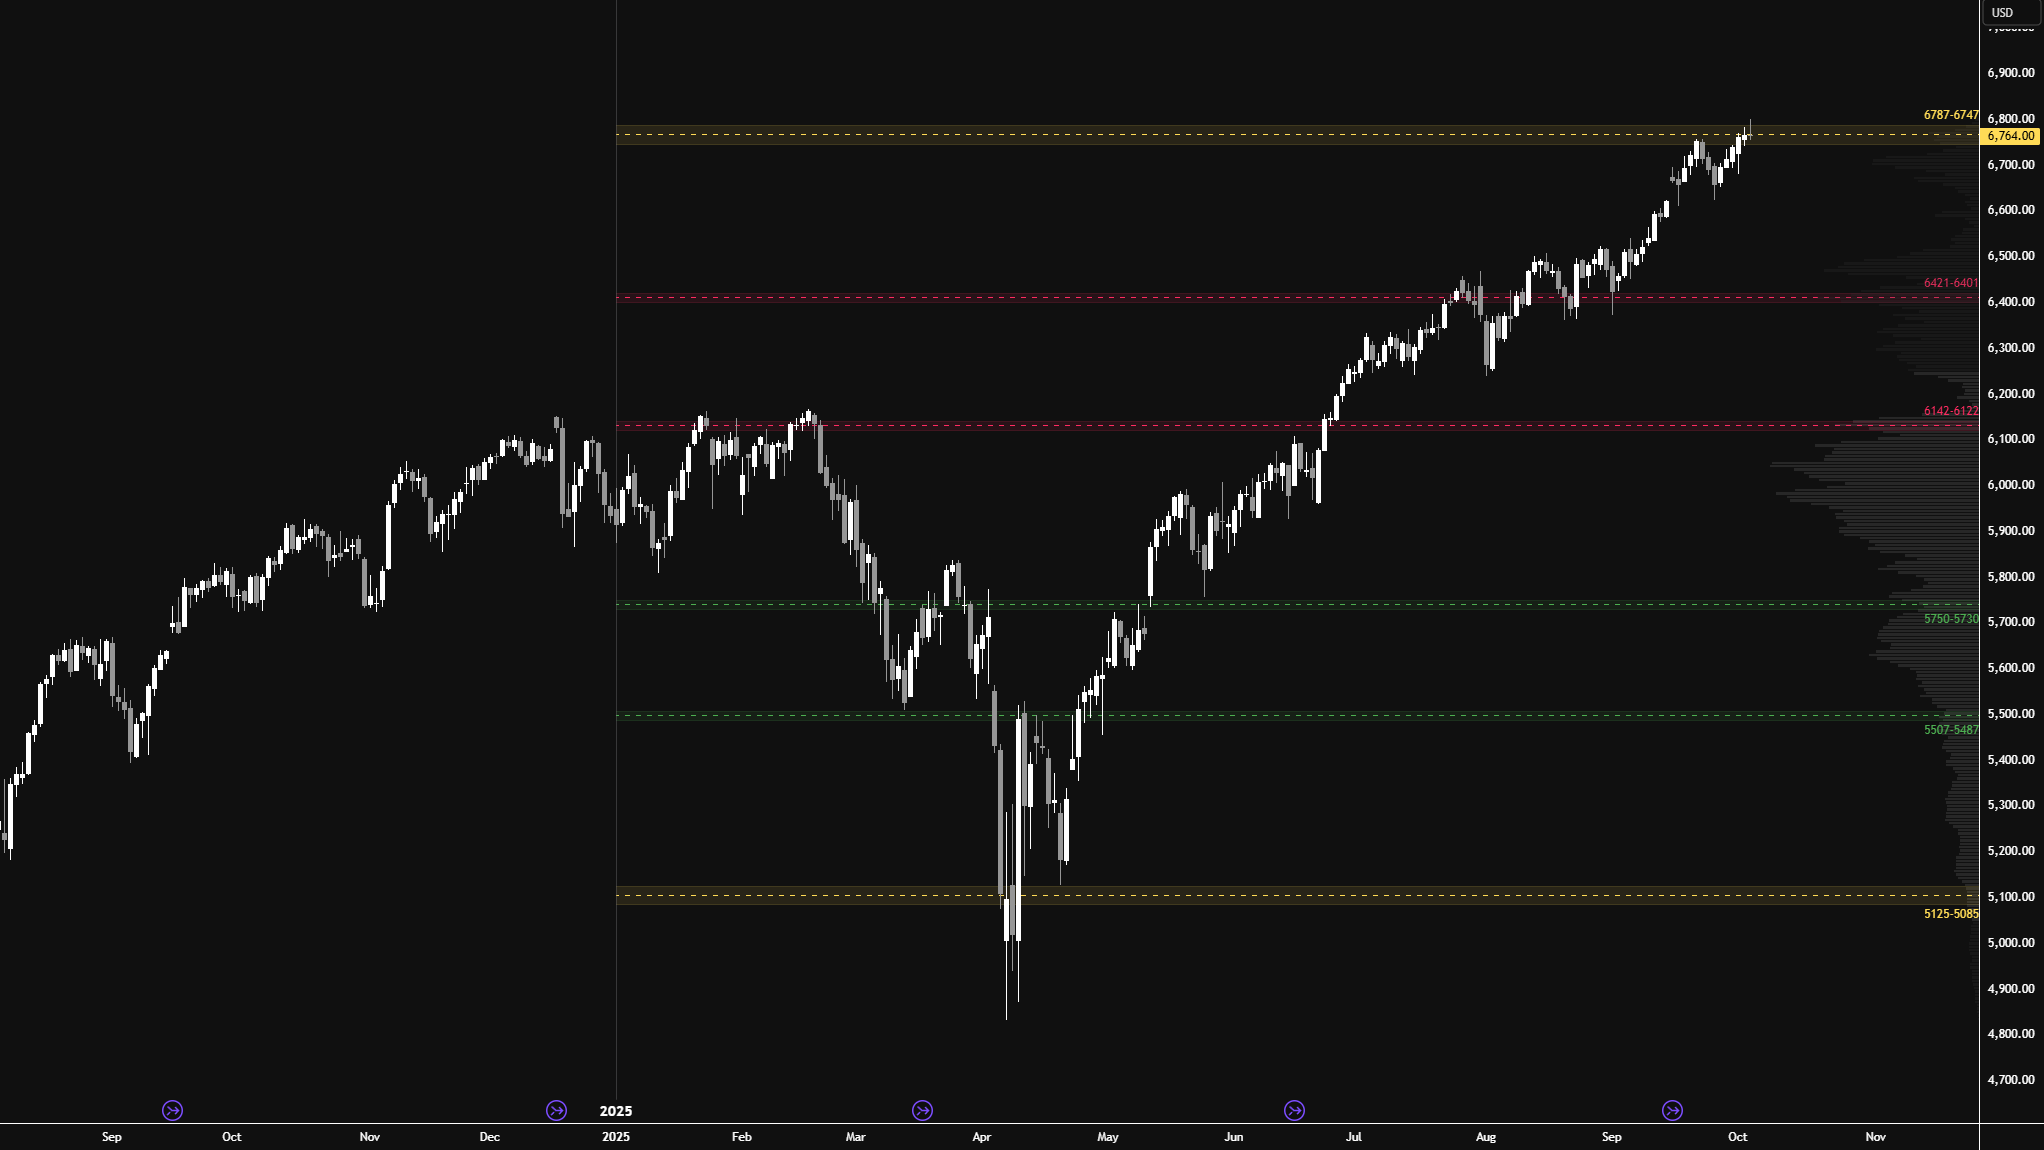
I will continue to include the HTF chart from a good friend of mine (see Figure 2), featuring levels generated by one of his models at the start of 2025. As you can see, this year’s price action has respected these levels remarkably well.
The market finished the week within the 6747–6787 area of interest. As discussed last week, the key takeaway is that the closer we get to this area, the less interested I am in initiating swing trades to the long side. A more reasonable approach is to wait patiently for pullbacks to 6421–6401 (~5% pullback) or 6142–6122 (~10% pullback).
This doesn’t mean the 6747–6787 area is a place to be short—after all, the strong bull trend remains intact. As short-term traders, we don’t need to hold a bias for long periods and can adjust quickly intraday. We’re also the first to spot potential momentum shifts.
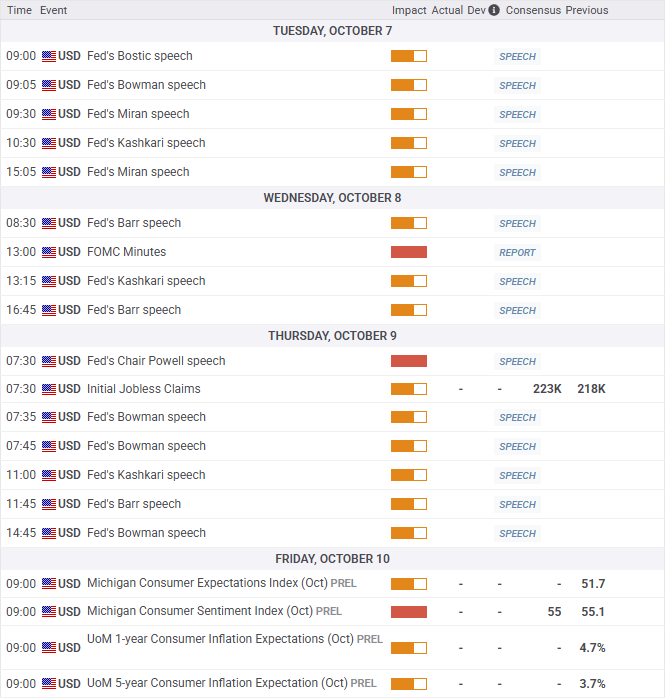
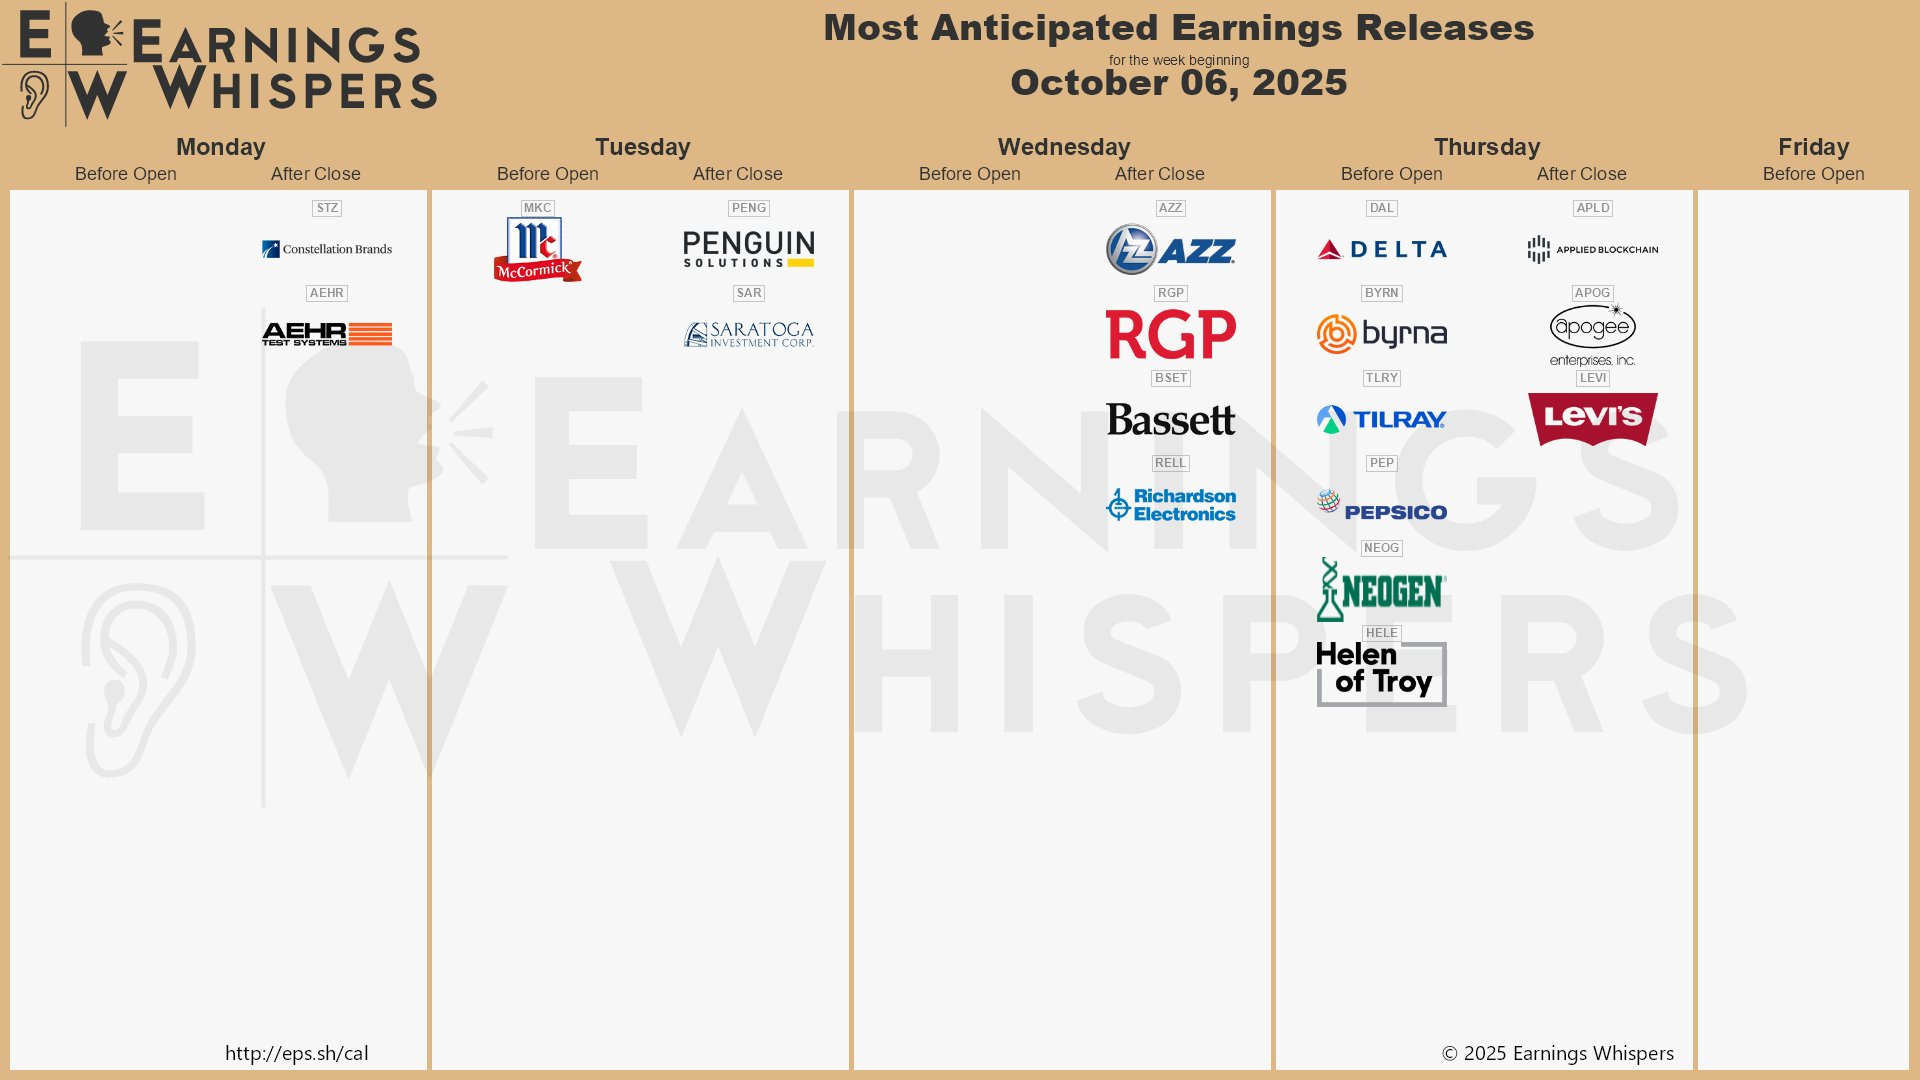
Economic & Earnings Calendar
Market Structure
🟩 Daily: OTFU → Ends at: 6754
🟩 Weekly: OTFU → Ends at: 6693
🟩 Monthly: OTFU → Ends at: 6371.75
Balance: A market condition where price consolidates within a defined range, reflecting indecision as the market awaits more market-generated information. We apply balance guidelines—favoring fade trades at range extremes (highs/lows) and preparing for breakout setups if balance resolves.
One-Time Framing Up (OTFU): A market condition where each subsequent bar forms a higher low, signaling a strong upward trend.
One-Time Framing Down (OTFD): A market condition where each subsequent bar forms a lower high, signaling a strong downward trend.
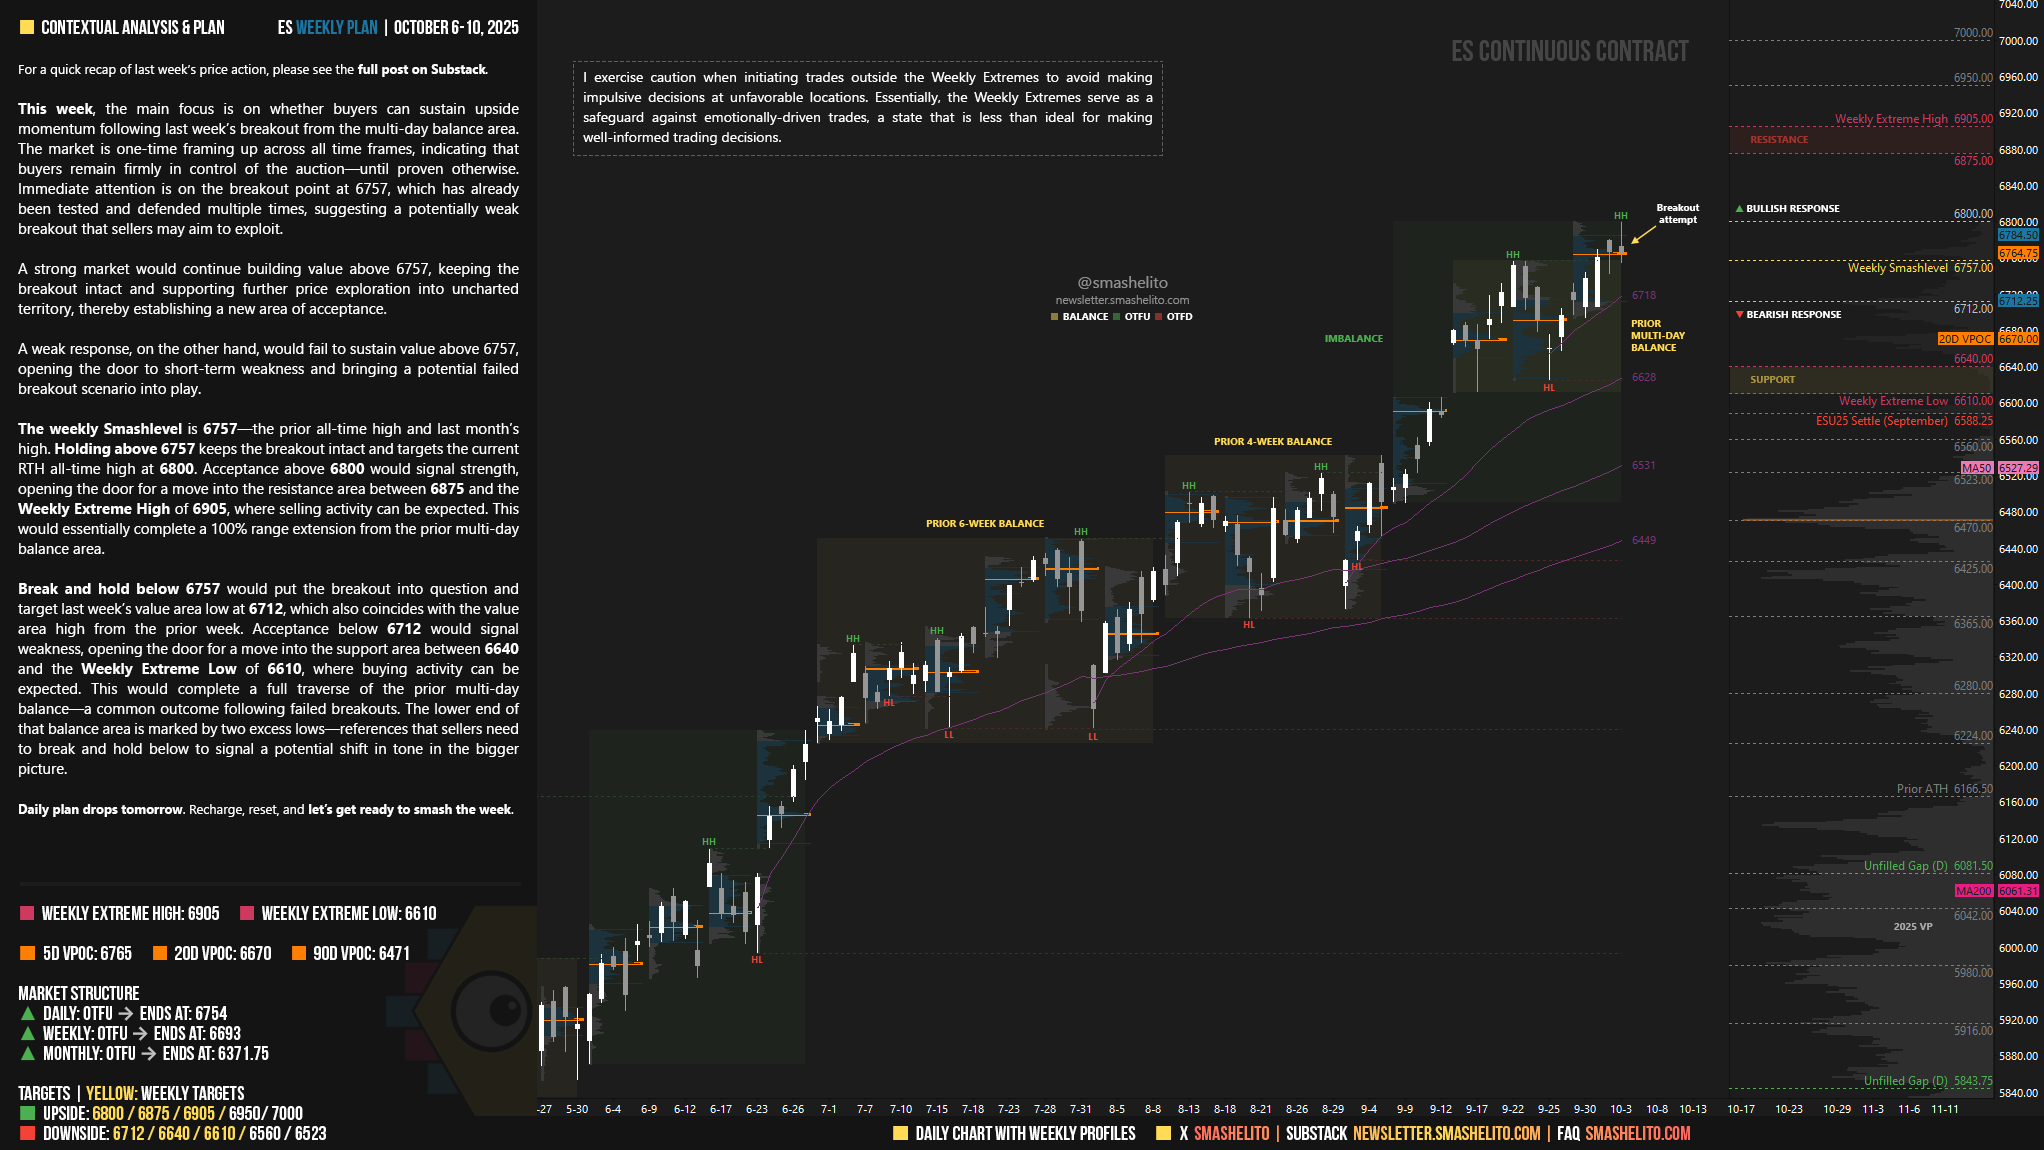
Contextual Analysis & Plan
This week, the main focus is on whether buyers can sustain upside momentum following last week’s breakout from the multi-day balance area. The market is one-time framing up across all time frames, indicating that buyers remain firmly in control of the auction—until proven otherwise. Immediate attention is on the breakout point at 6757, which has already been tested and defended multiple times, suggesting a potentially weak breakout that sellers may aim to exploit.
A strong market would continue building value above 6757, keeping the breakout intact and supporting further price exploration into uncharted territory, thereby establishing a new area of acceptance.
A weak response, on the other hand, would fail to sustain value above 6757, opening the door to short-term weakness and bringing a potential failed breakout scenario into play.
The weekly Smashlevel is 6757—the prior all-time high and last month’s high. Holding above 6757 keeps the breakout intact and targets the current RTH all-time high at 6800. Acceptance above 6800 would signal strength, opening the door for a move into the resistance area between 6875 and the Weekly Extreme High of 6905, where selling activity can be expected. This would essentially complete a 100% range extension from the prior multi-day balance area.
Break and hold below 6757 would put the breakout into question and target last week’s value area low at 6712, which also coincides with the value area high from the prior week. Acceptance below 6712 would signal weakness, opening the door for a move into the support area between 6640 and the Weekly Extreme Low of 6610, where buying activity can be expected. This would complete a full traverse of the prior multi-day balance—a common outcome following failed breakouts. The lower end of that balance area is marked by two excess lows—references that sellers need to break and hold below to signal a potential shift in tone in the bigger picture.
Key Levels of Interest
In the upcoming week, I will closely observe the behavior around 6757.
Holding above 6757 would target 6800 / 6875 / 6905* / 6950/ 7000
Break and hold below 6757 would target 6712 / 6640 / 6610* / 6560 / 6523
*Weekly Extremes. I exercise caution when initiating trades outside the Weekly Extremes to avoid making impulsive decisions at unfavorable locations. Essentially, the Weekly Extremes serve as a safeguard against emotionally-driven trades, a state that is less than ideal for making well-informed trading decisions.
Daily plan drops tomorrow. Recharge, reset, and let’s get ready to smash the week.
Thank you for referring to numbers, Smash. After 18 months of continuous reading of your newsletter only today I was confident about what you wrote.
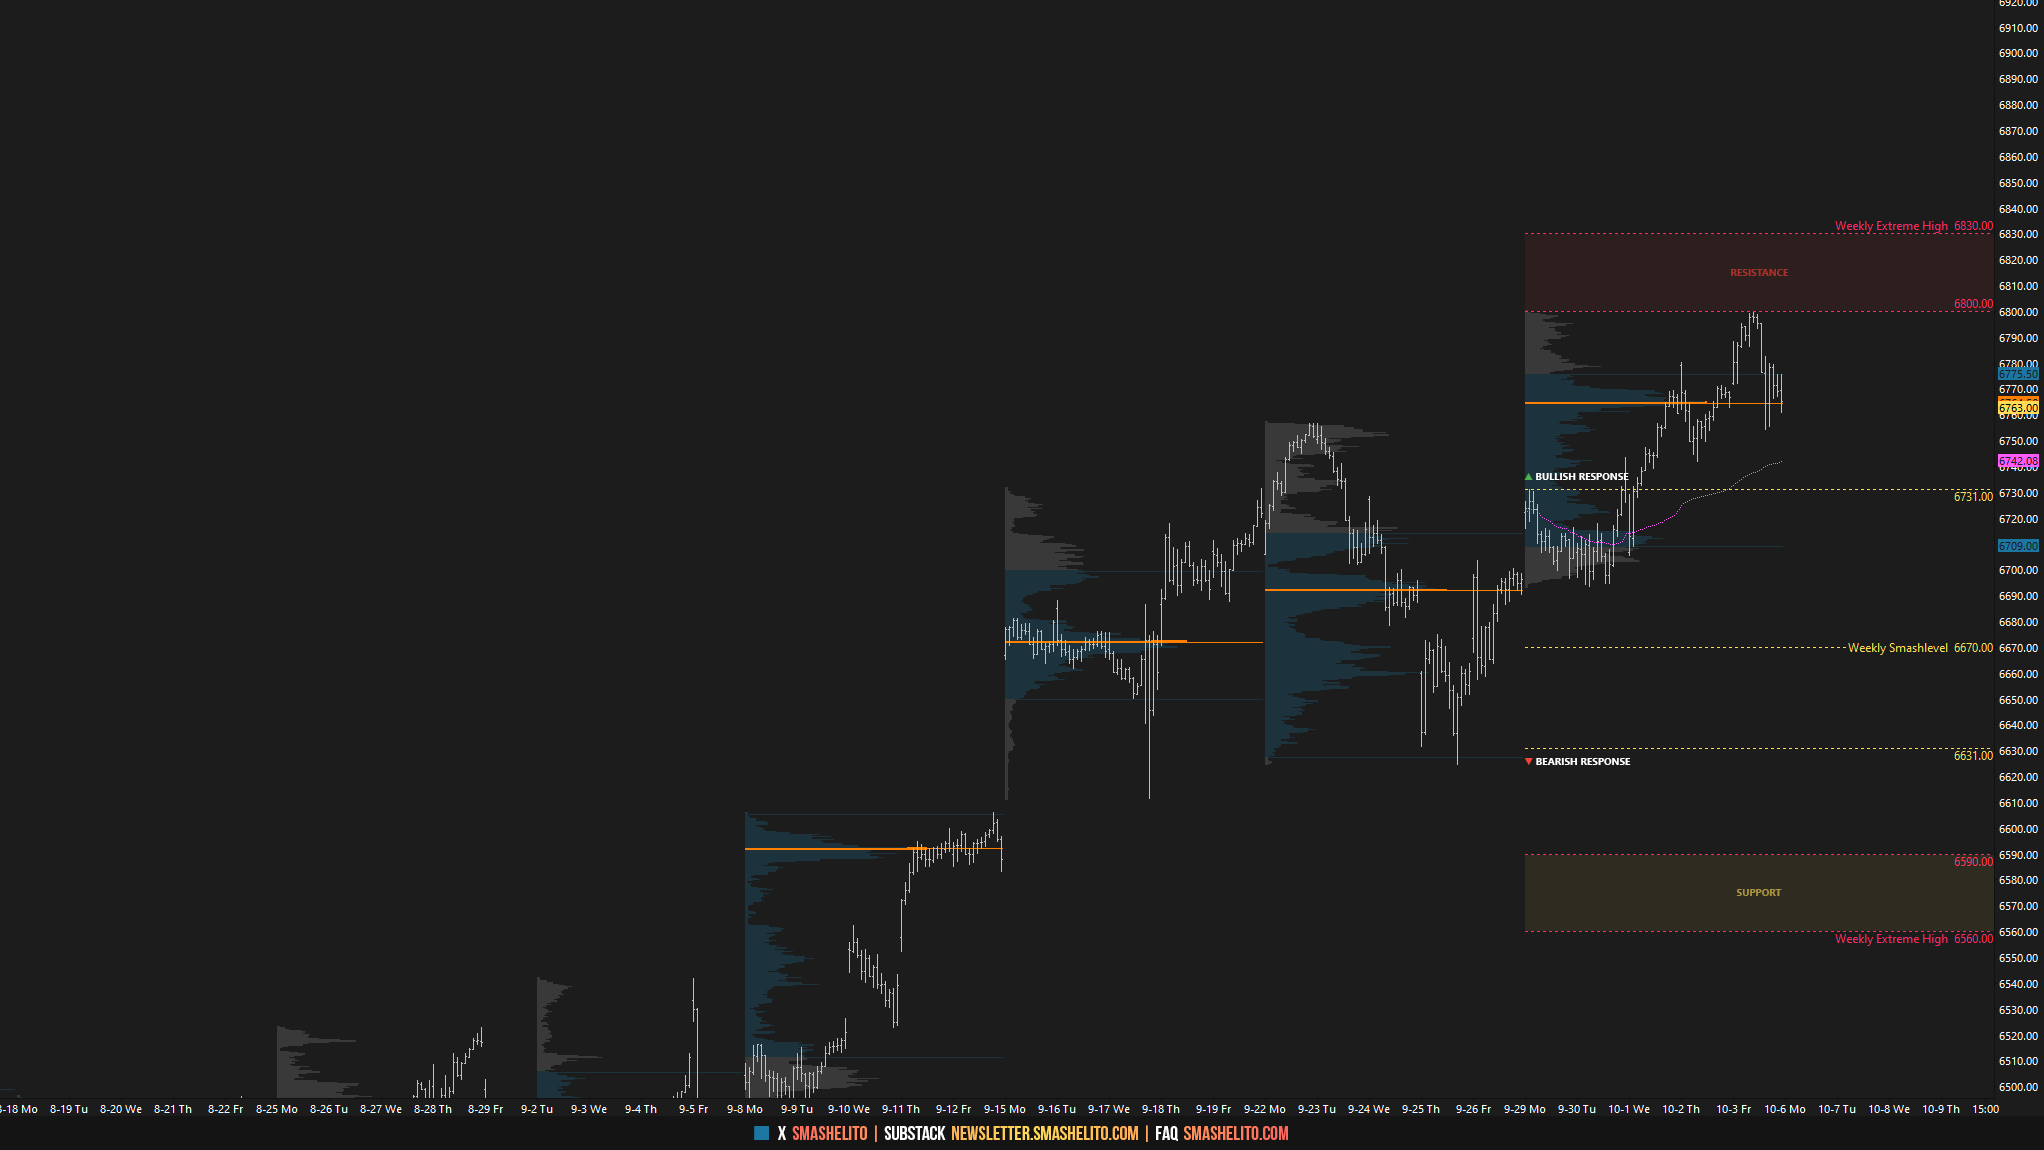
1. I read every single sentence and same time I was using TradingView's Fixed Volume profile tool to see what happened since 15.9.2025.
2. First time I saw that the 10 days period, 15.9.25-22.9.2025, show the POC at 6670.00 , on 1 hours chart.
3. First time I understood the importance of the past sessions' data and contextual analysis.
4. You're not only an ambassador of Peter Steidlmaye's and James Dalton's work. You're their successor and maybe the only one.
Absolutely impressive work! I truly appreciate the concise and focused details in your analysis. You've inspired me to dive into Sierra Charts, and I’m excited to share that I've invested in your templates as well. I have one quick question for you: how do you organize the levels neatly on the right side of the chart? I love that it reduces clutter and makes everything so much easier to visualize. Thank you so much for your time; it’s greatly appreciated!