
ES Weekly Plan | October 20-24, 2025
Recap, Market Context & Key Levels for the Week Ahead

Welcome to this week’s plan. Inside, you’ll find a quick review of last week’s price action, key economic events, market structure, context for the week ahead, and the levels I’ll be focusing on. Let’s get prepared.
Contents
Last Week in Review & Bonus Chart
Economic & Earnings Calendar
Market Structure
Contextual Analysis & Plan
Key Levels of Interest
Last Week in Review & Bonus Chart
Last week’s plan: ES Weekly Plan | October 13-17, 2025
Heading into last week, the main focus was on whether sellers could sustain downside momentum following the breakdown from the multi-day balance area on Friday the 10th, which ultimately resulted in an outside week down. Immediate attention was on Friday’s after-hours flush, which would be key to monitor for continuation—or lack thereof—early in the week.
Accepting Friday’s after-hours flush by holding below 6592 would serve as a weak response, while failing to do so—meaning acceptance back within Friday’s range—would open the door to technical fills of structure, potentially all the way back toward last week’s value area.
Monday kicked off the week by rejecting Friday’s after-hours weakness, opening back within Friday’s range, triggering short-covering, and forming an inside day.
Tuesday’s session was marked by overnight weakness, leading the RTH session to open on a true gap down. This opened the door for sellers to trigger a downside continuation following Monday’s short-covering bounce. Initially, it looked promising; however, the crucial 6592 level found responsive buyers, and another vicious short-covering rally unfolded.
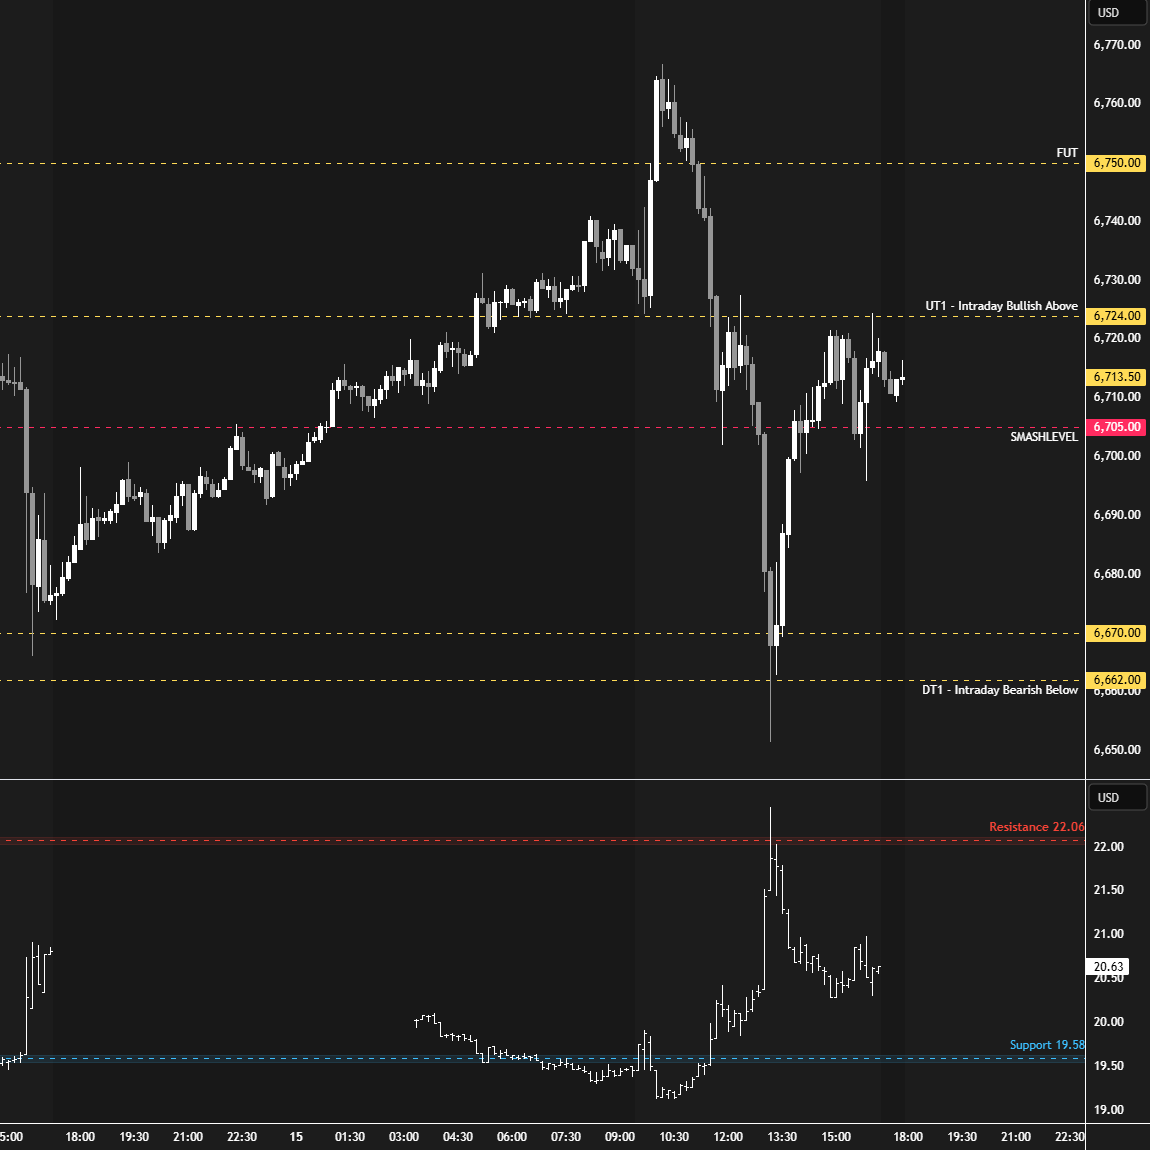
Wednesday mirrored Tuesday but in reverse. The market gapped higher, with early momentum favoring the gap’s direction. The Weekly Extreme High at 6750 was tagged and exceeded, completing the cleanup of last week’s poor structure. Buyers ultimately failed to gain traction in the prior multi-day balance, triggering a notable liquidation break.
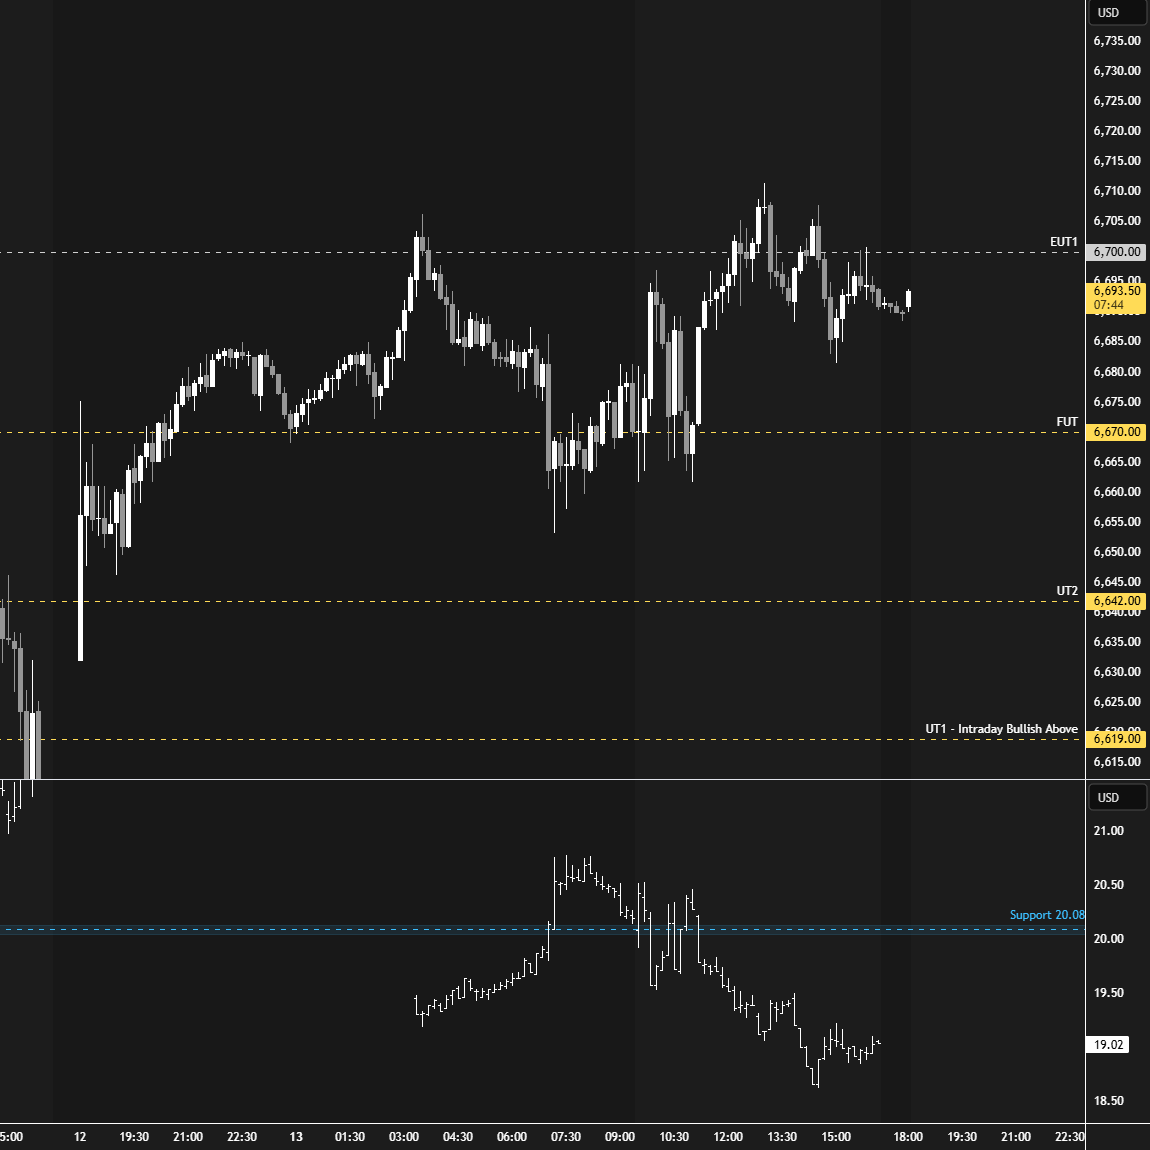
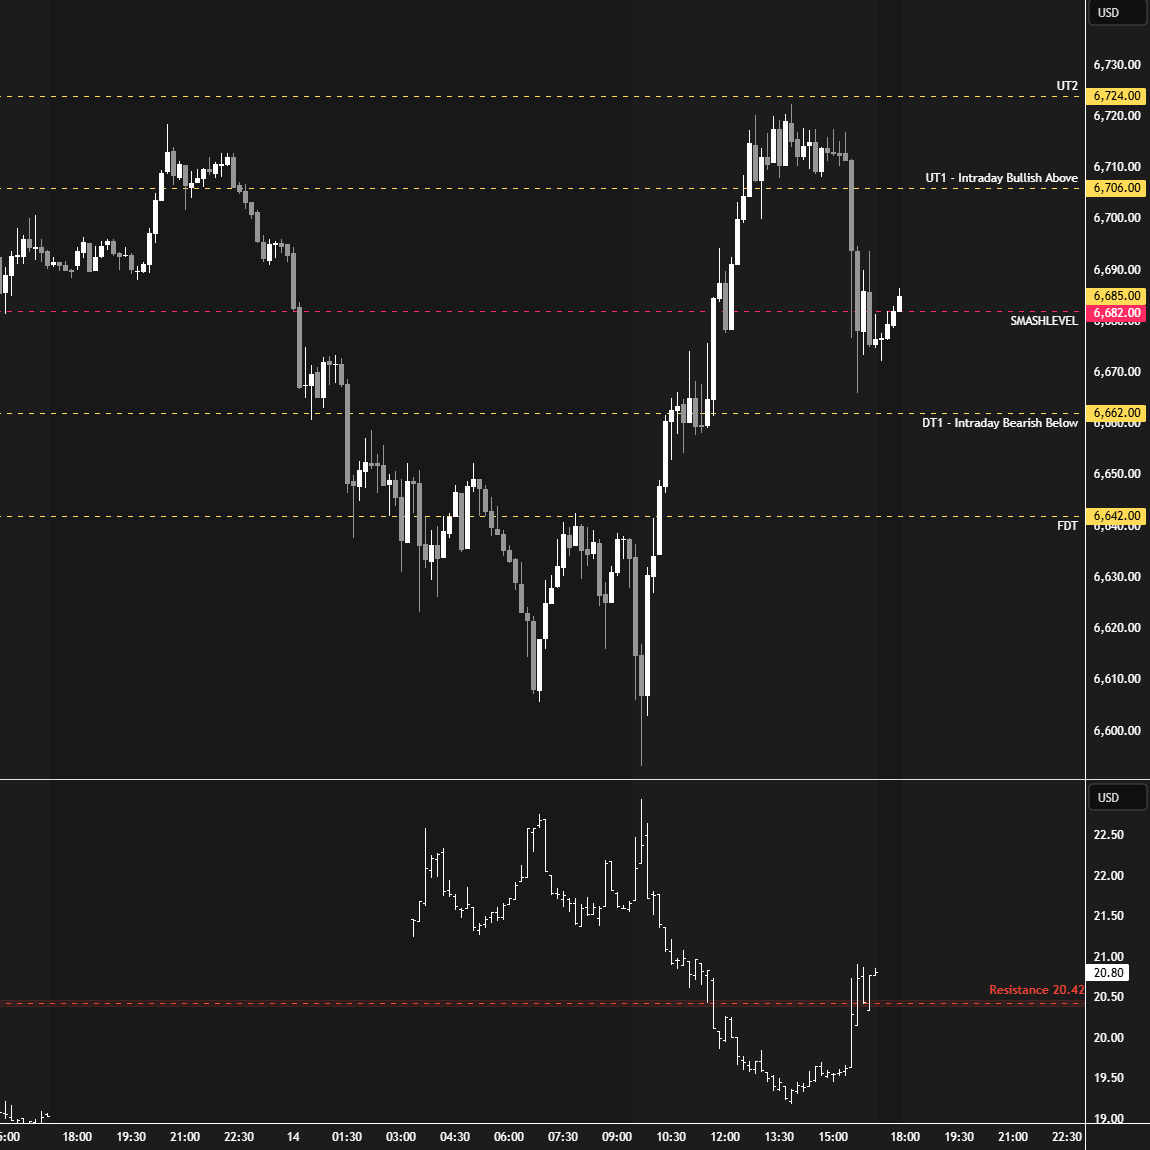
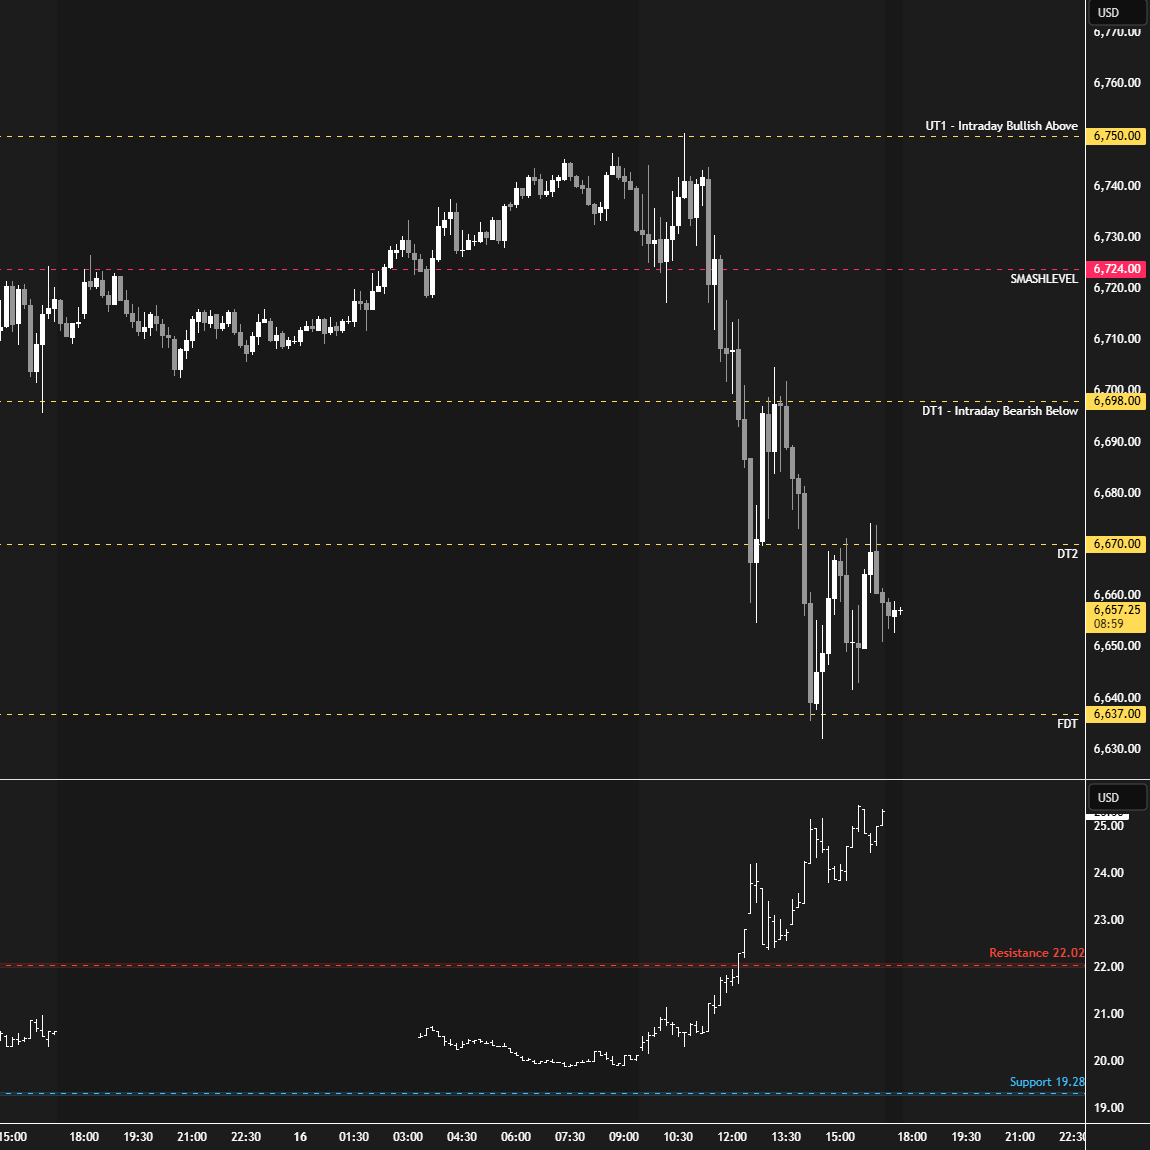
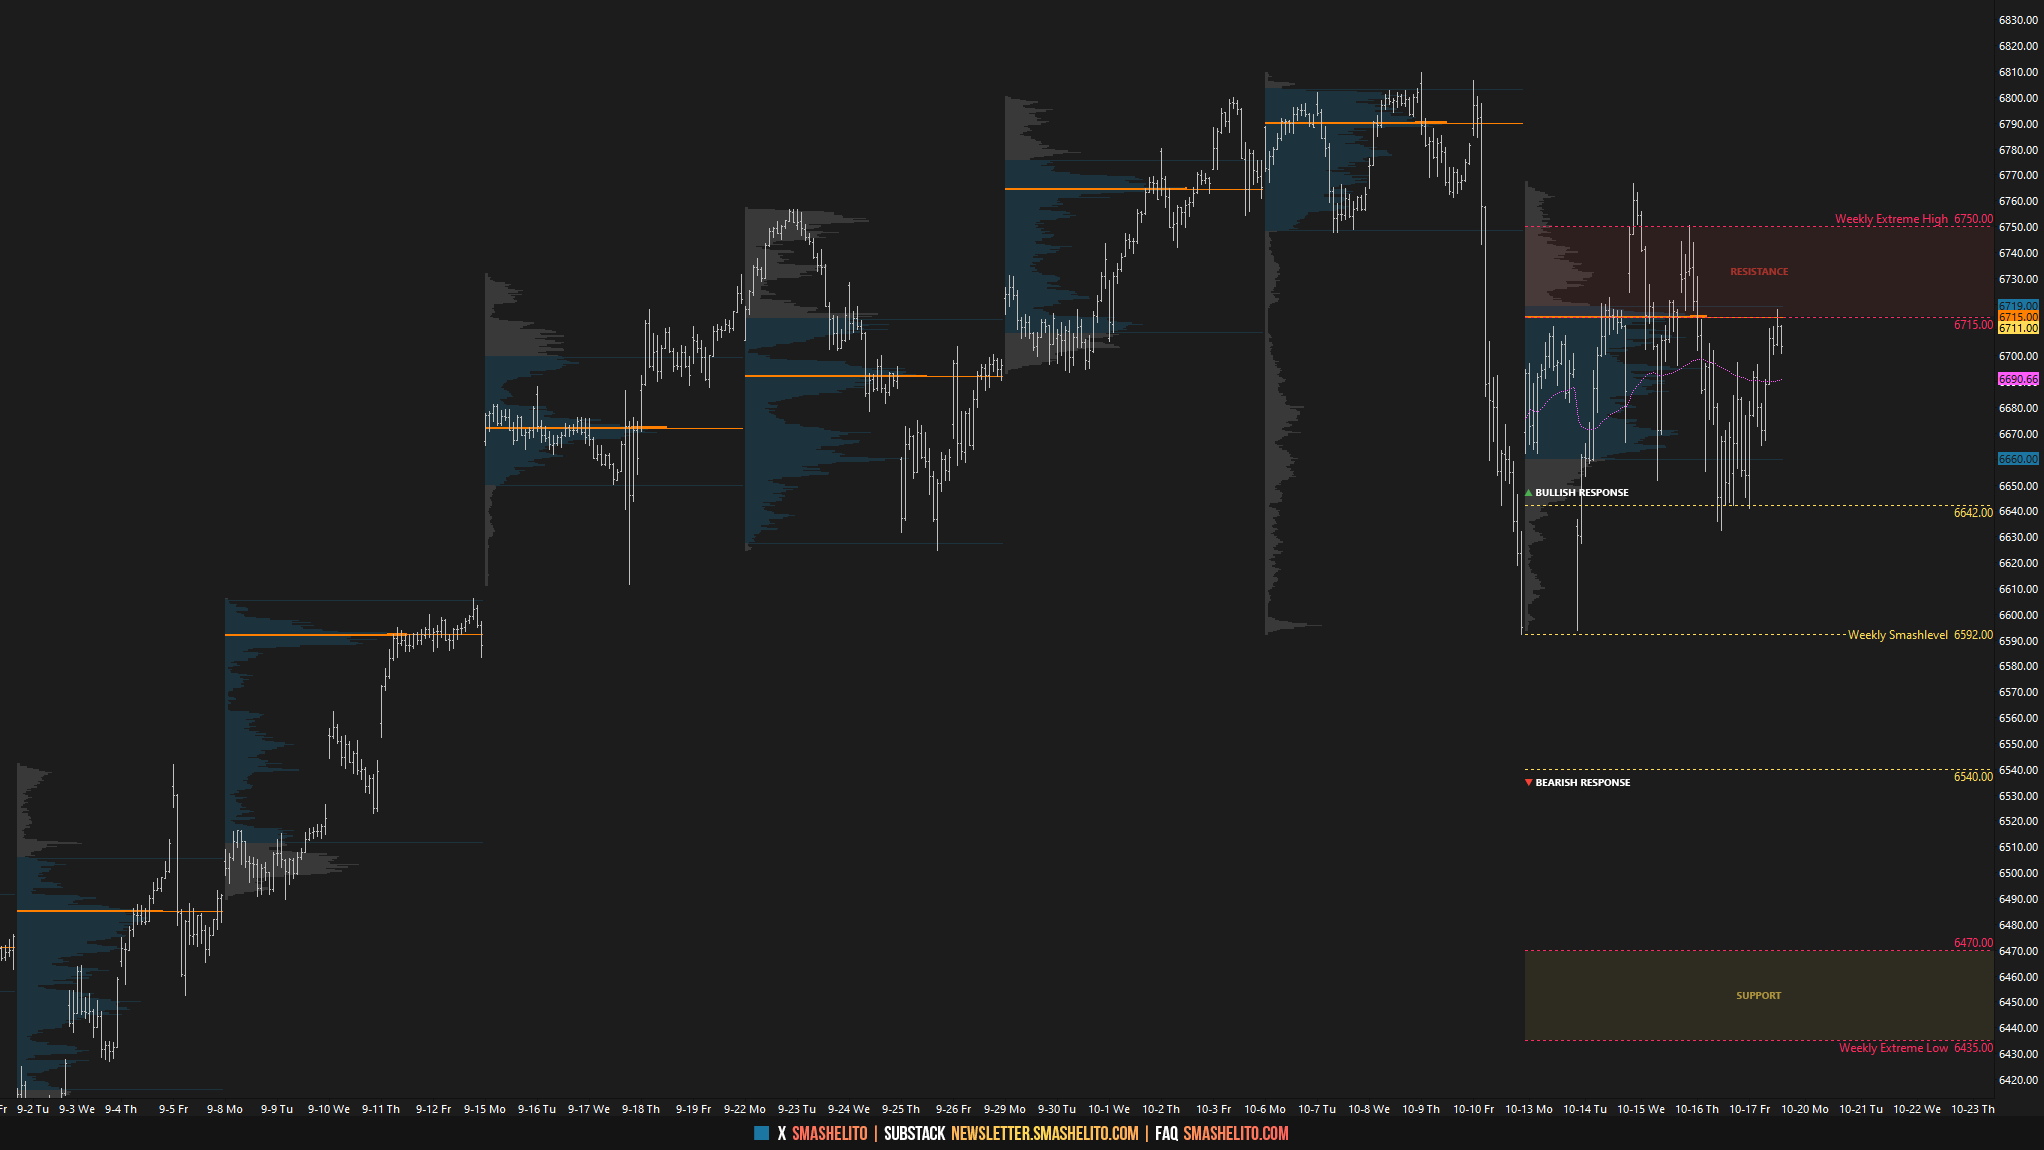
This was a great example of how the market tried to move from value, failed to find acceptance, and then returned within value, triggering a textbook value traverse where responsive buyers stepped in (see Figure 1 and Figure 2).
On Thursday, price revisited the Weekly Extreme High at 6750—almost to the tick—finding selling activity once again and triggering weakness. Downside targets were breached and re-offered on retests all the way down to the final downside target (FDT) at 6637, where buyers stepped in.
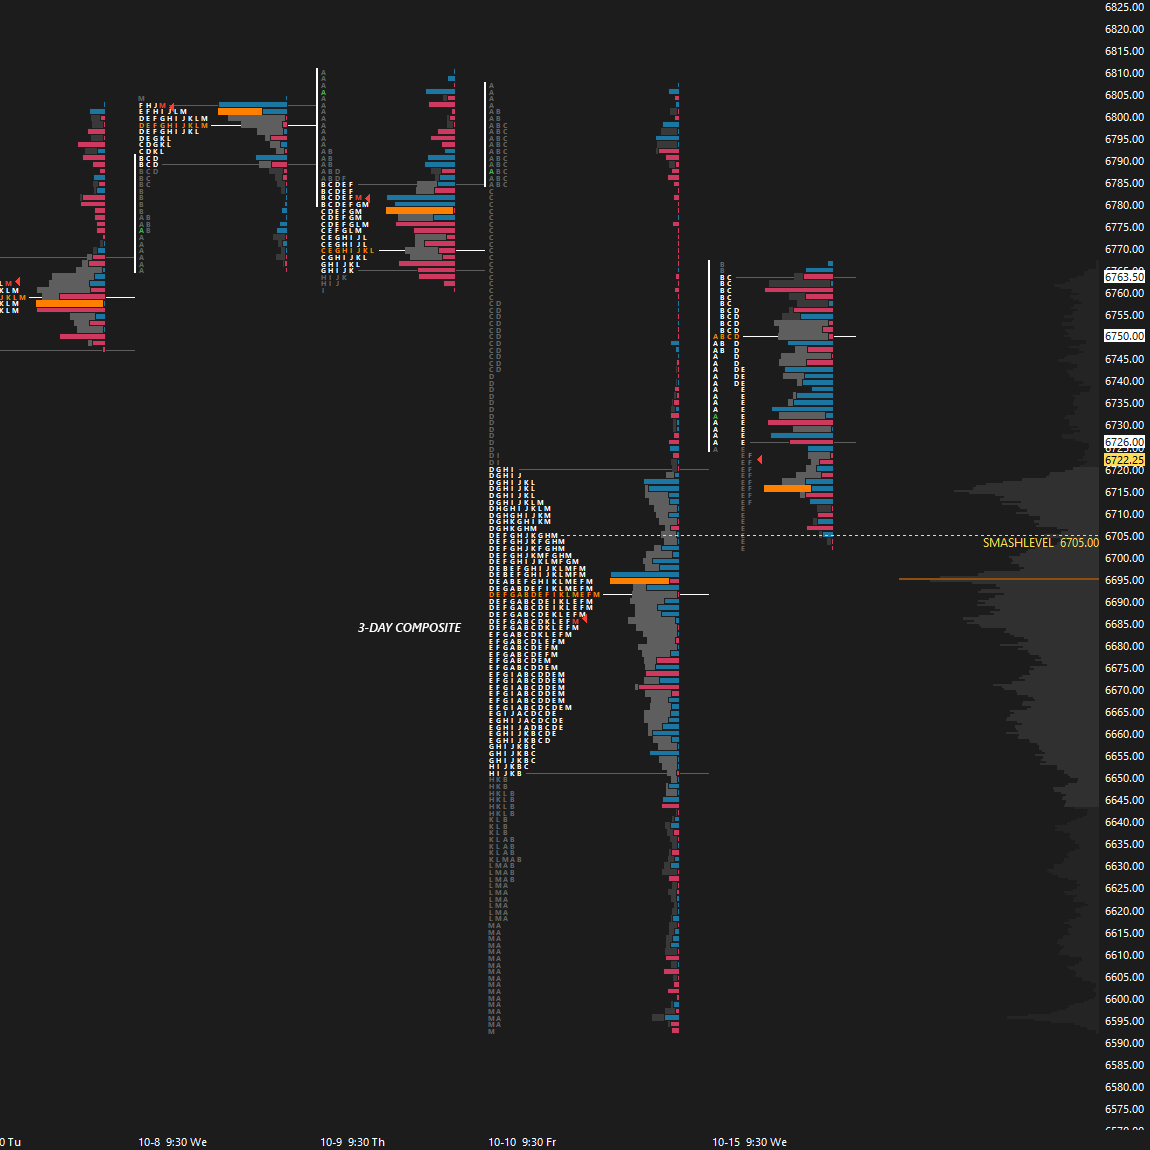
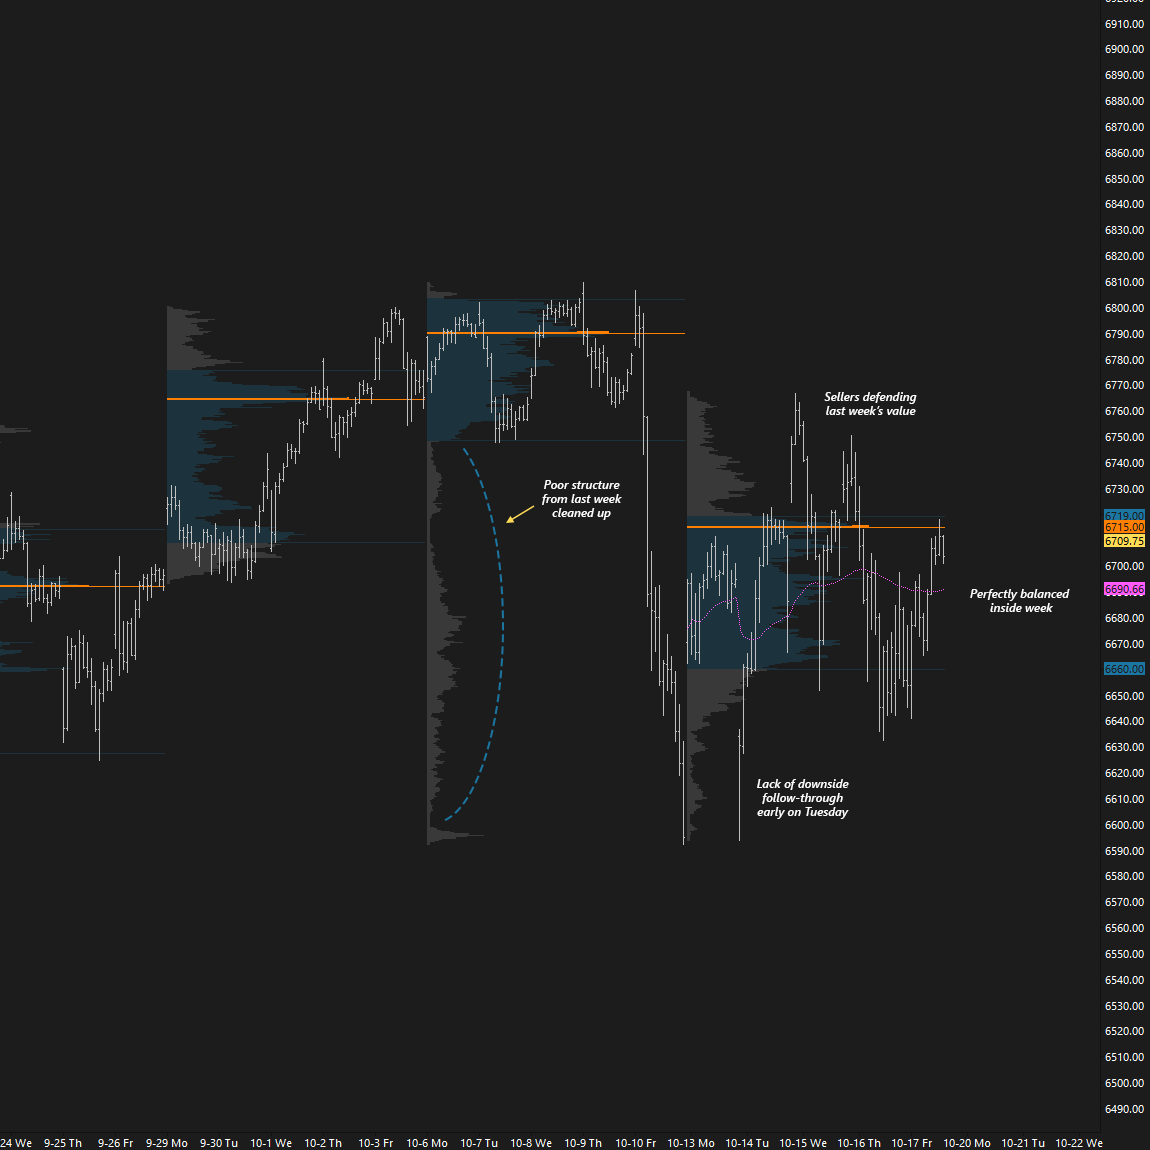
Friday’s session was marked by another weak overnight session, leading to another test of the crucial 6592 level. A look-below-and-fail of 6592 triggered another wave of short-covering. The lack of follow-through in either direction was essentially the theme of the week. We closed out Friday’s session within the range of prices considered “fair value” for the week, forming a perfectly balanced inside week (see Figure 3).
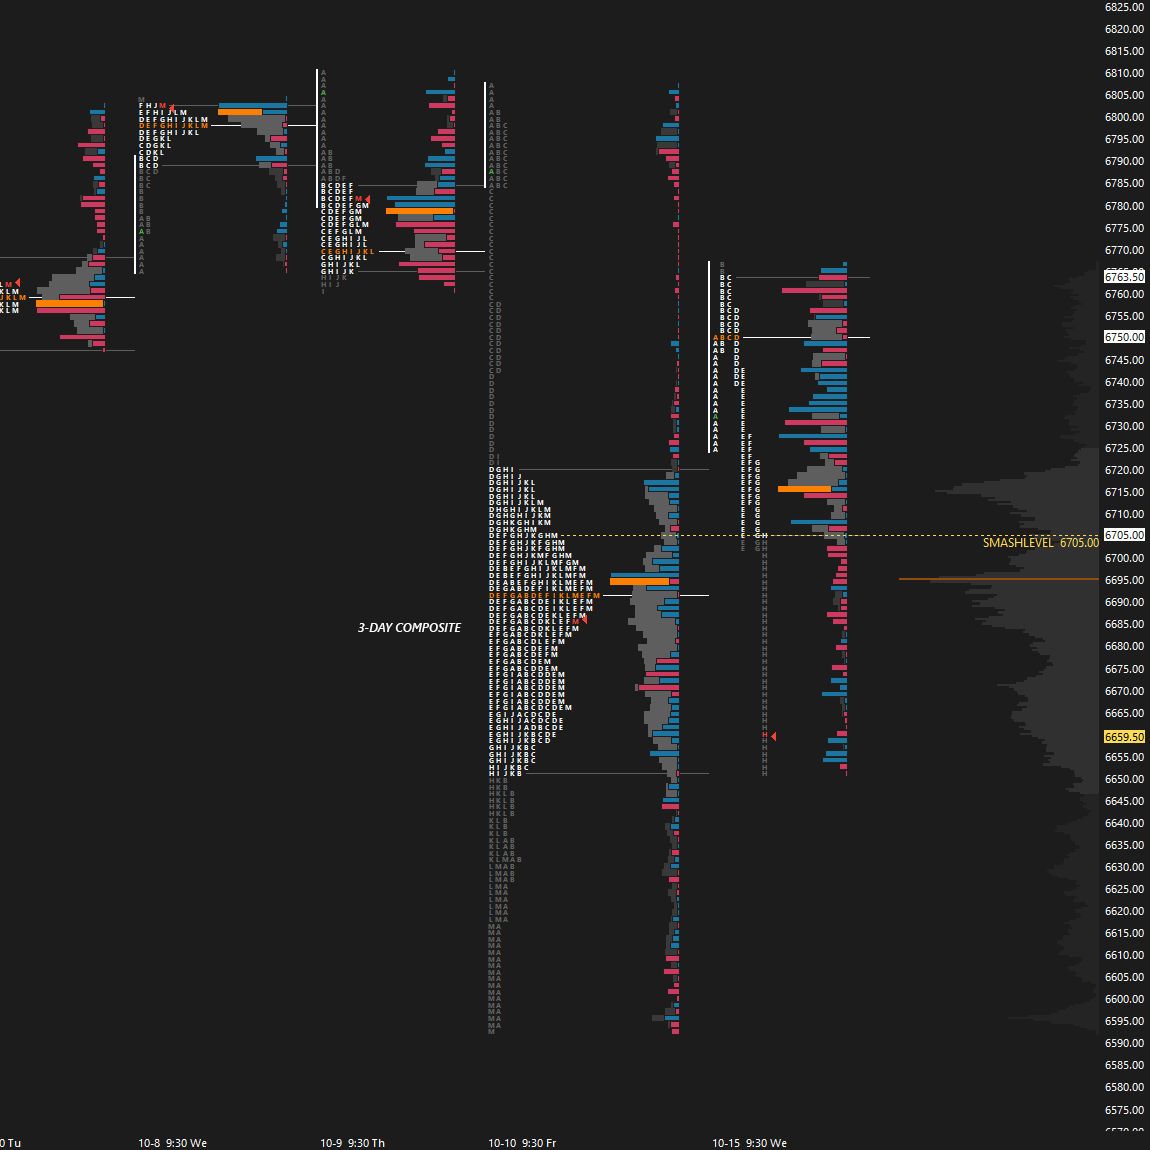
The market is coiling for a directional move, with the 5D, 20D, and 90D VPOCs—referring to short-, medium-, and long-term value—all within the inside week range.
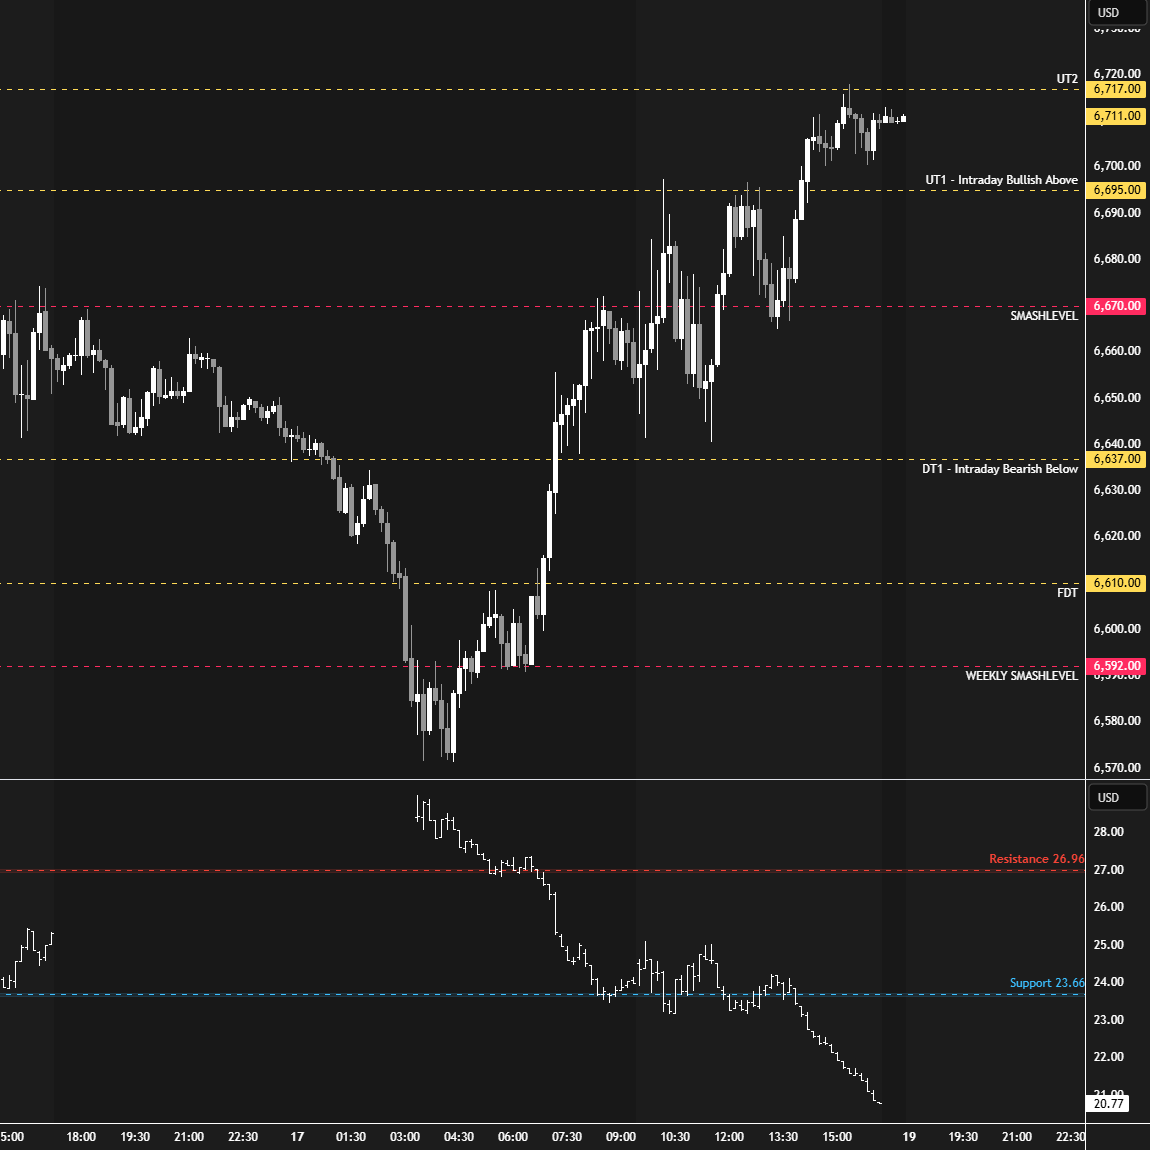
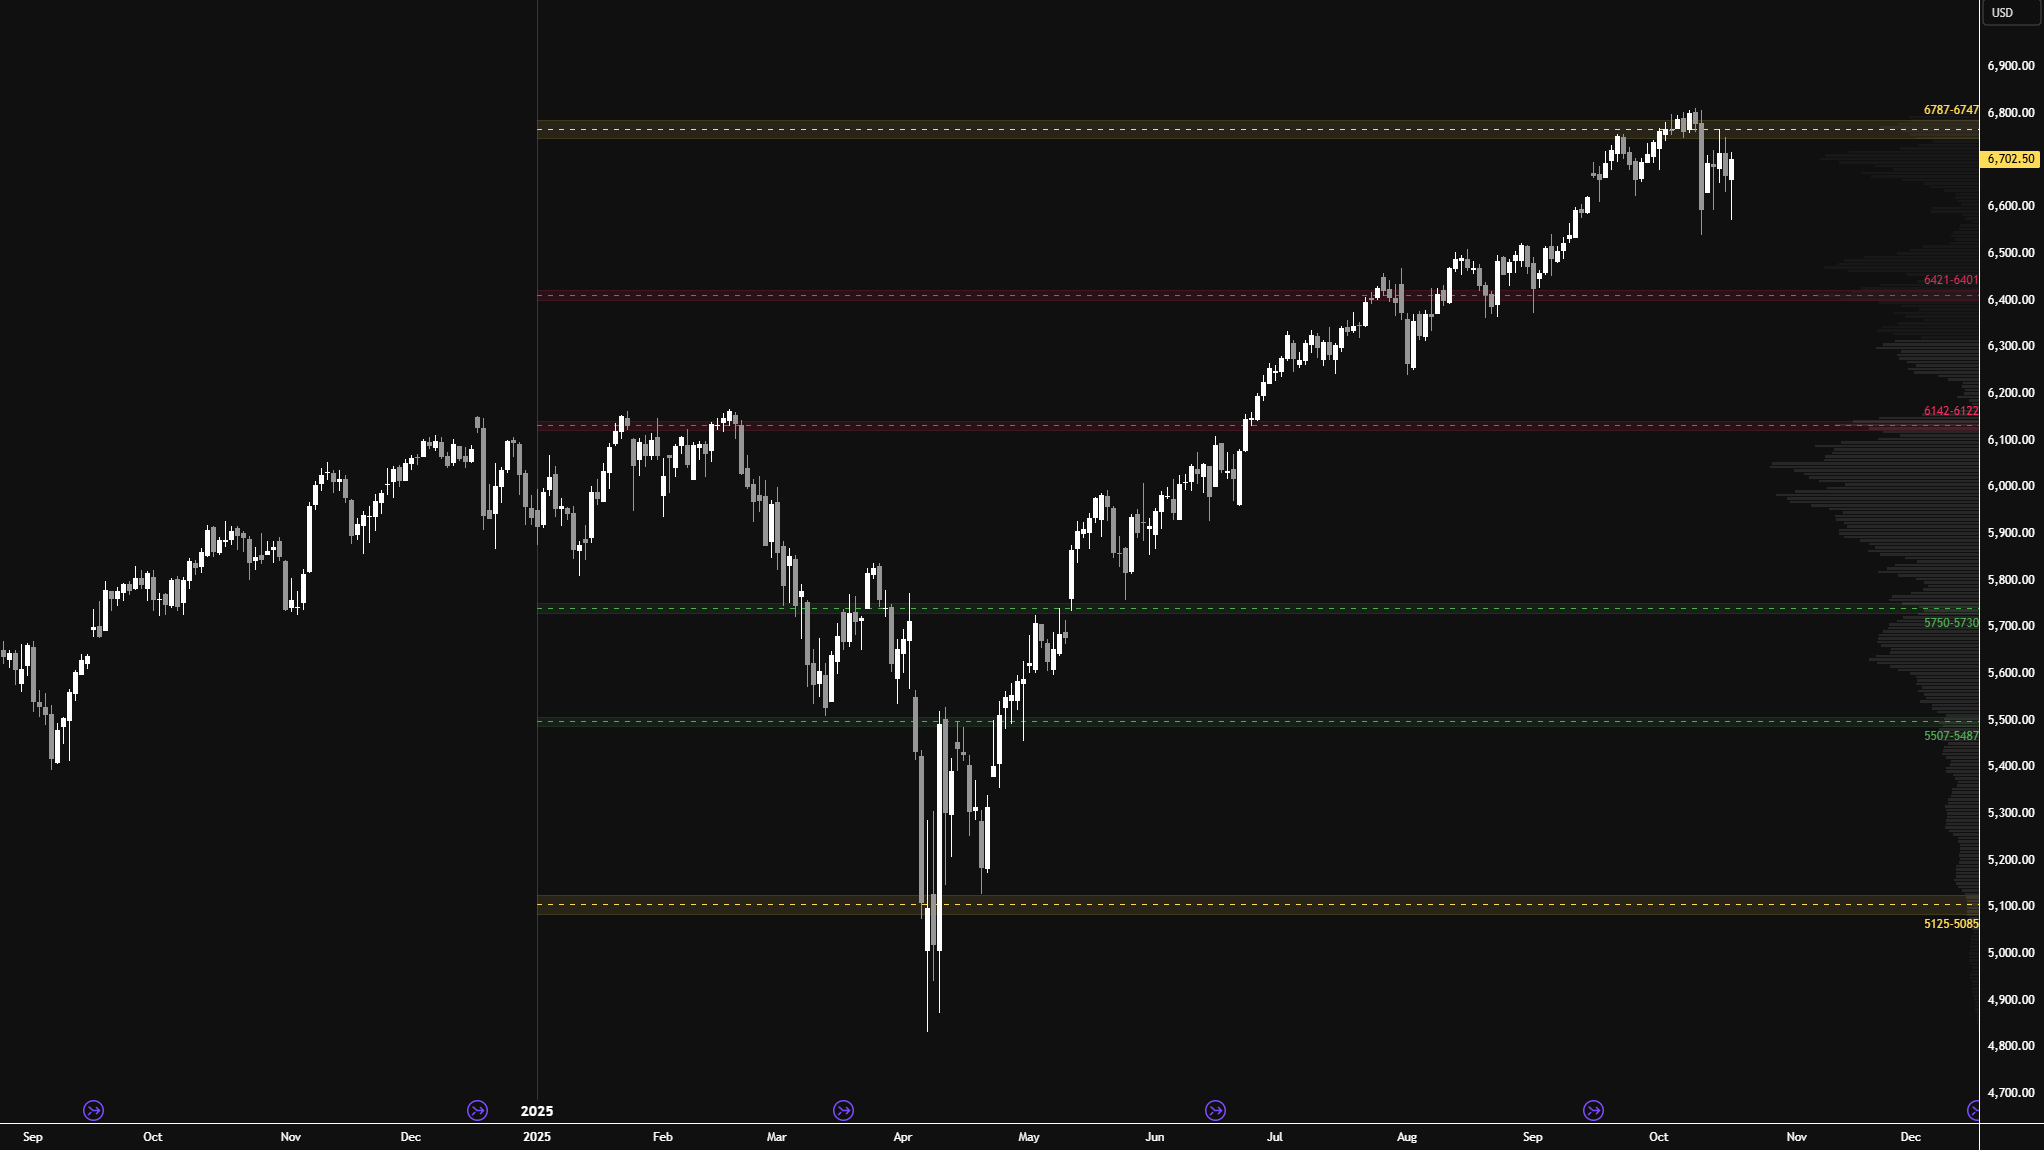
I will continue to include the HTF chart from a good friend of mine (see Figure 4), featuring levels generated by one of his models at the start of 2025. As you can see, this year’s price action has respected these levels remarkably well.
Price continues to attract selling activity in the 6747–6787 area of interest. As discussed last week, the key takeaway was that the closer we got to this area, the less interested I was in initiating long-side swing trades. Waiting patiently for pullbacks to 6421–6401, or even 6142–6122, remains the more reasonable approach. It remains to be seen where the market will go next.
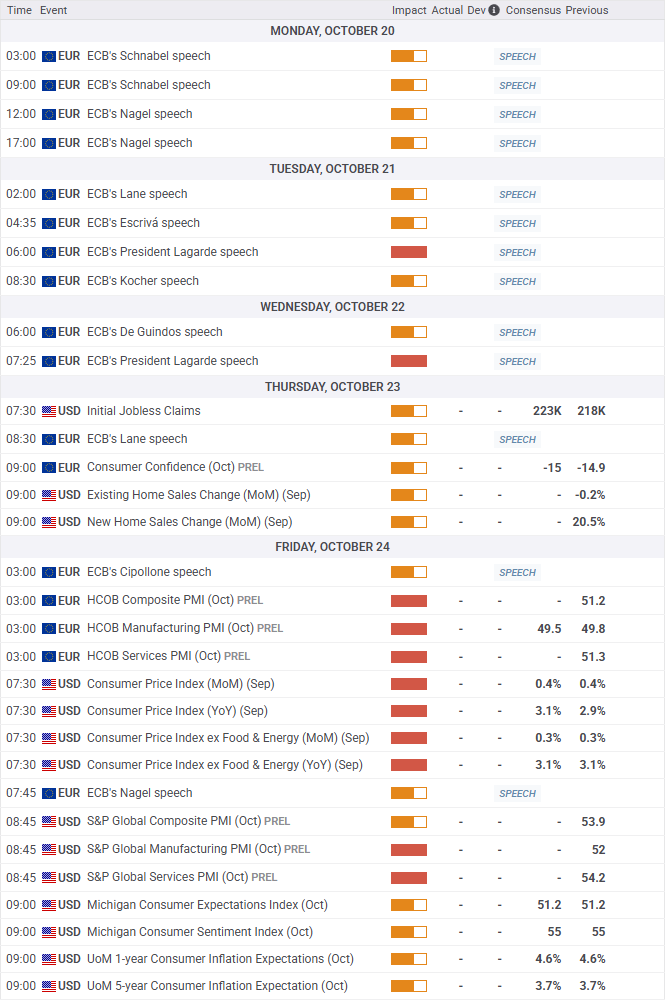
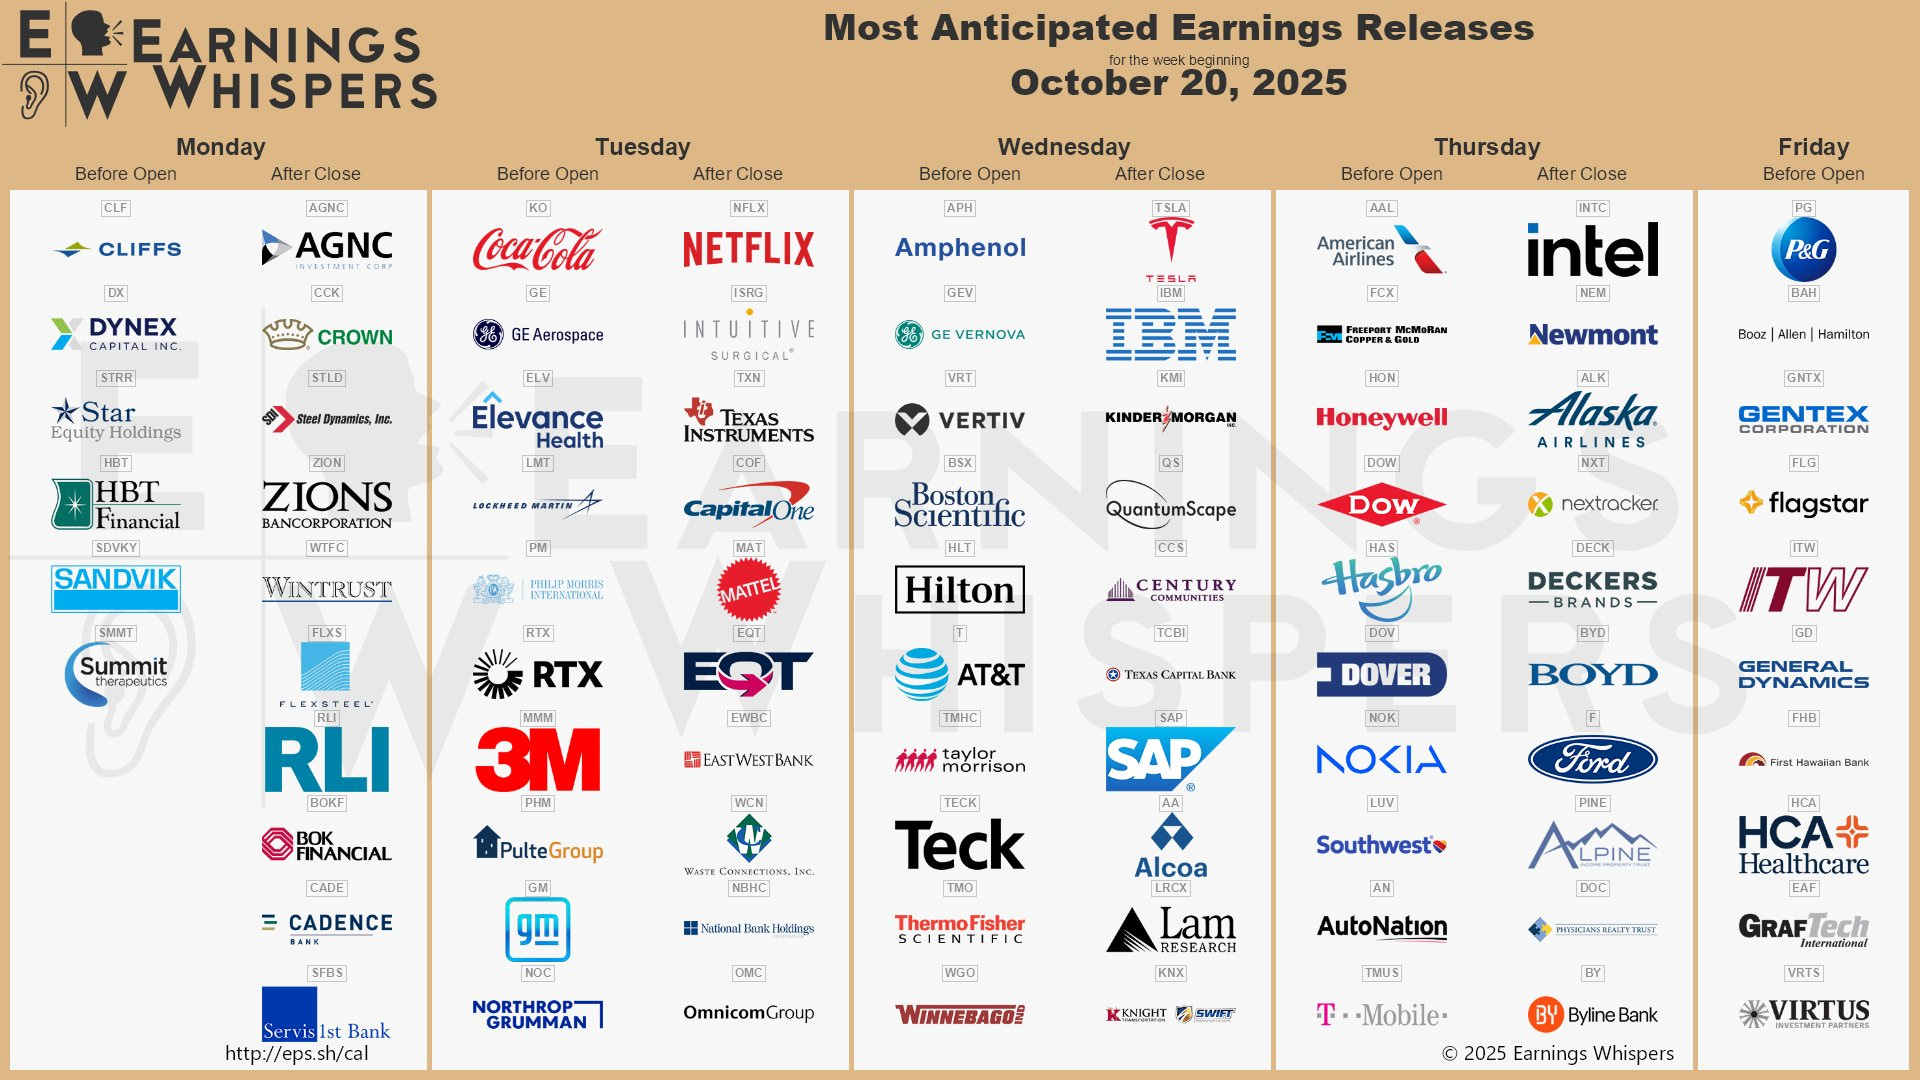
Economic & Earnings Calendar
Market Structure
🟨 Daily: BALANCE → 5-Day → High: 6766.75 / Low: 6593.25
🟨 Weekly: BALANCE → 5-Week → High: 6809.50 / Low: 6591.75
🟩 Monthly: OTFU → Ends at: 6371.75
Balance: A market condition where price consolidates within a defined range, reflecting indecision as the market awaits more market-generated information. We apply balance guidelines—favoring fade trades at range extremes (highs/lows) and preparing for breakout setups if balance resolves.
One-Time Framing Up (OTFU): A market condition where each subsequent bar forms a higher low, signaling a strong upward trend.
One-Time Framing Down (OTFD): A market condition where each subsequent bar forms a lower high, signaling a strong downward trend.
Contextual Analysis & Plan
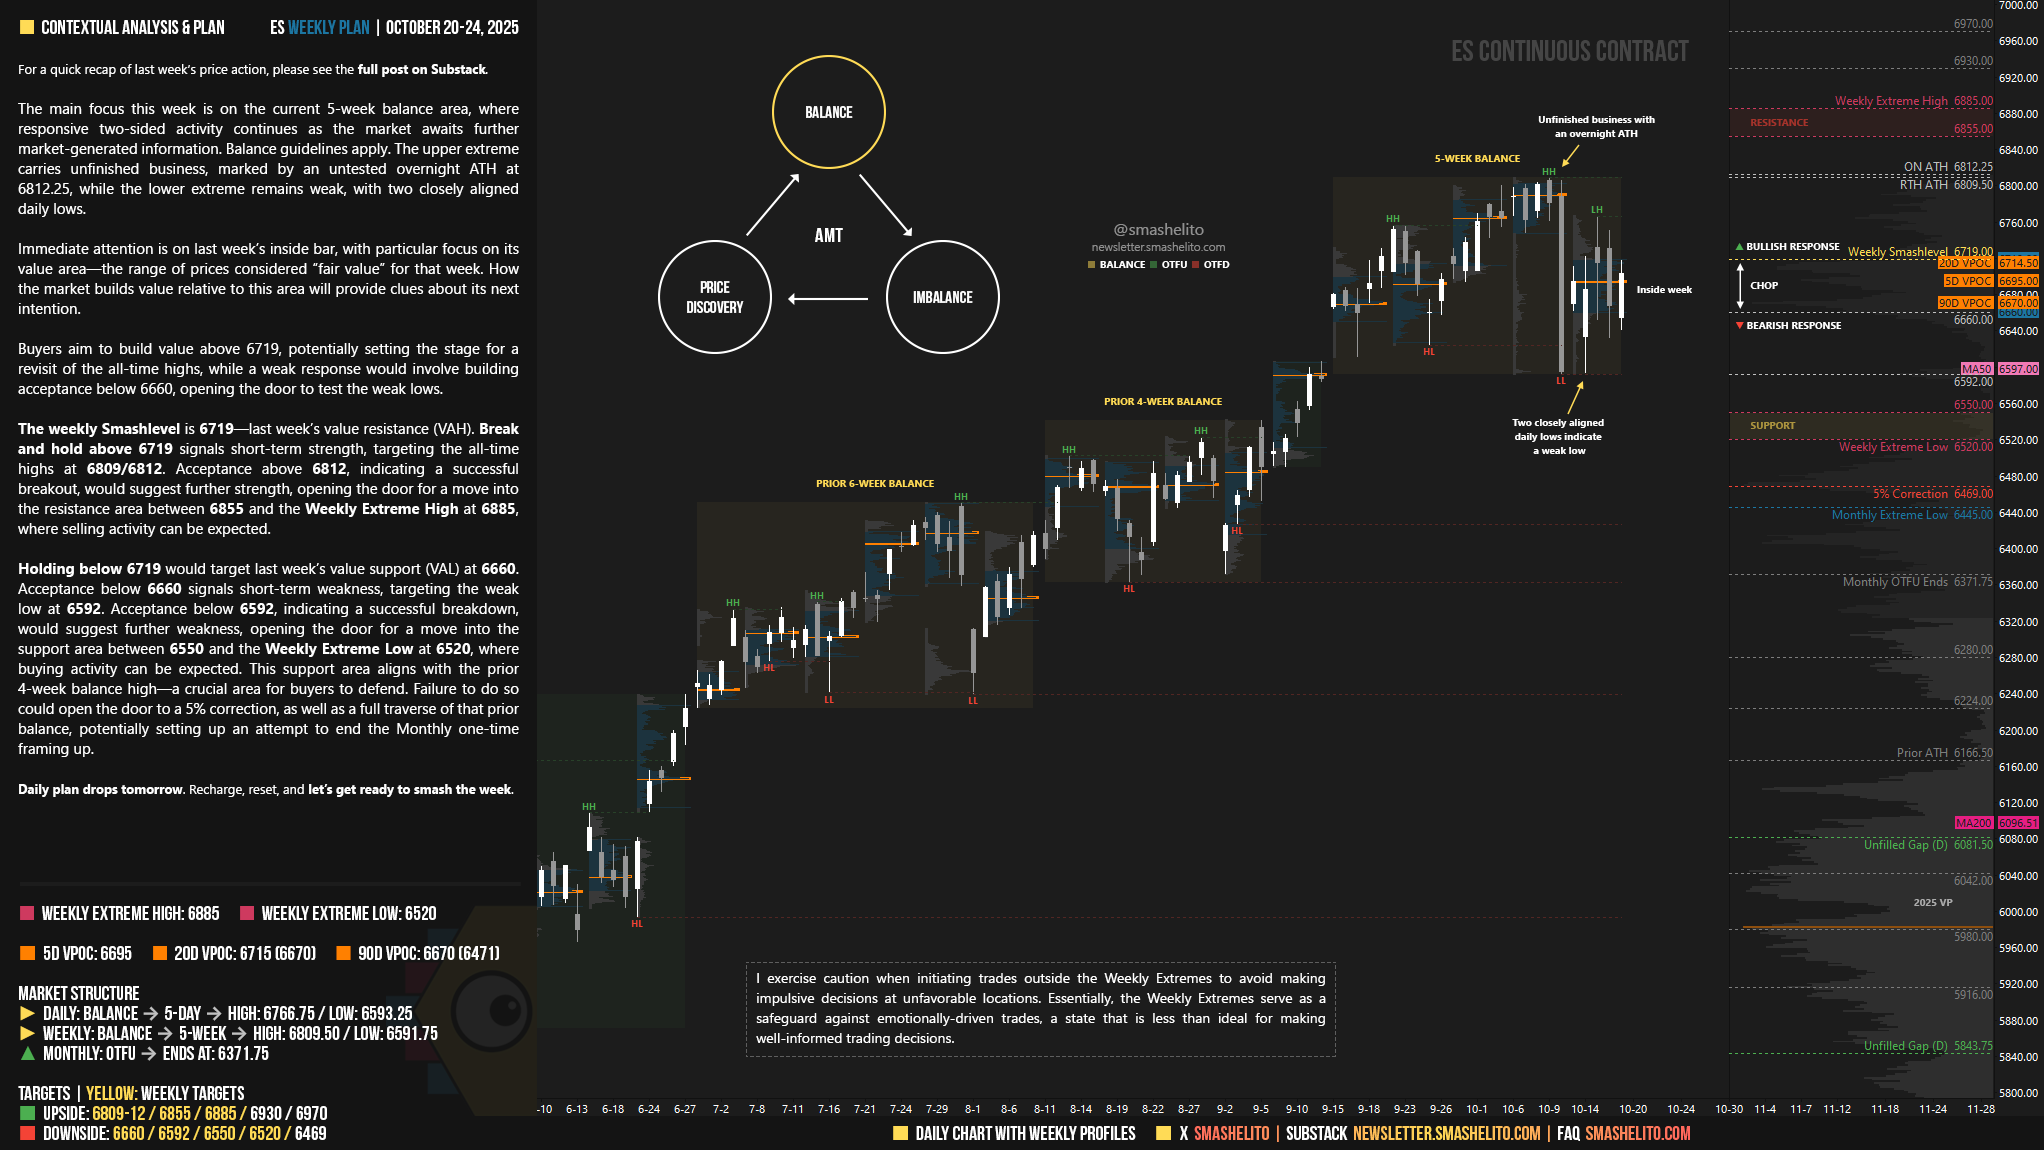
The main focus this week is on the current 5-week balance area, where responsive two-sided activity continues as the market awaits further market-generated information. Balance guidelines apply. The upper extreme carries unfinished business, marked by an untested overnight ATH at 6812.25, while the lower extreme remains weak, with two closely aligned daily lows.
Immediate attention is on last week’s inside bar, with particular focus on its value area—the range of prices considered “fair value” for that week. How the market builds value relative to this area will provide clues about its next intention.
Buyers aim to build value above 6719, potentially setting the stage for a revisit of the all-time highs, while a weak response would involve building acceptance below 6660, opening the door to test the weak lows.
The weekly Smashlevel is 6719—last week’s value resistance (VAH). Break and hold above 6719 signals short-term strength, targeting the all-time highs at 6809/6812. Acceptance above 6812, indicating a successful breakout, would suggest further strength, opening the door for a move into the resistance area between 6855 and the Weekly Extreme High at 6885, where selling activity can be expected.
Holding below 6719 would target last week’s value support (VAL) at 6660. Acceptance below 6660 signals short-term weakness, targeting the weak low at 6592. Acceptance below 6592, indicating a successful breakdown, would suggest further weakness, opening the door for a move into the support area between 6550 and the Weekly Extreme Low at 6520, where buying activity can be expected. This support area aligns with the prior 4-week balance high—a crucial area for buyers to defend. Failure to do so could open the door to a 5% correction, as well as a full traverse of that prior balance, potentially setting up an attempt to end the Monthly one-time framing up.
Key Levels of Interest
In the upcoming week, I will closely observe the behavior around 6719.
Break and hold above 6719 would target 6809-12 / 6855 / 6885* / 6930 / 6970
Holding below 6719 would target 6660 / 6592 / 6550 / 6520* / 6469
*Weekly Extremes. I exercise caution when initiating trades outside the Weekly Extremes to avoid making impulsive decisions at unfavorable locations. Essentially, the Weekly Extremes serve as a safeguard against emotionally-driven trades, a state that is less than ideal for making well-informed trading decisions.
Daily plan drops tomorrow. Recharge, reset, and let’s get ready to smash the week.
Thank you Smash!
"The market is coiling for a directional move, with the 5D, 20D, and 90D VPOCs—referring to short-, medium-, and long-term value—all within the inside week range." I remember reading this a few months ago in another weekly plan you posted. The continuation was crazy. This is definitely something that tells me to be attentive and know how to interpret which way the continuation will go.