
ES Weekly Plan | October 13-17, 2025
Recap, Market Context & Key Levels for the Week Ahead

Welcome to this week’s plan. Inside, you’ll find a quick review of last week’s price action, key economic events, market structure, context for the week ahead, and the levels I’ll be focusing on. Let’s get prepared.
Contents
Last Week in Review & Bonus Chart
Economic & Earnings Calendar
Market Structure
Contextual Analysis & Plan
Key Levels of Interest
Last Week in Review & Bonus Chart
Last week’s plan: ES Weekly Plan | October 6-10, 2025
Heading into last week, the main focus was on whether buyers could sustain upside momentum following the prior week’s breakout from the multi-day balance area. With the market one-time framing up across all time frames, buyers remained in firm control of the auction—until proven otherwise. Immediate attention was, of course, on the breakout point at 6757, which had already been tested and defended multiple times, suggesting a potentially weak breakout.
A strong market would continue building value above 6757, maintaining the breakout and supporting further price exploration into uncharted territory, while a weak response would fail to do so, opening the door to short-term weakness and a potential failed breakout scenario.
The market kicked off the week with a quiet inside day on Monday, with both the overnight and RTH sessions trading completely within the prior session’s range. While inside days technically don’t end the one-time framing up concept, they represent short-term balance where we can apply the balance guidelines. As discussed, building value above the breakout point at 6757 was bullish, and only acceptance back below that level could potentially shift the tone.
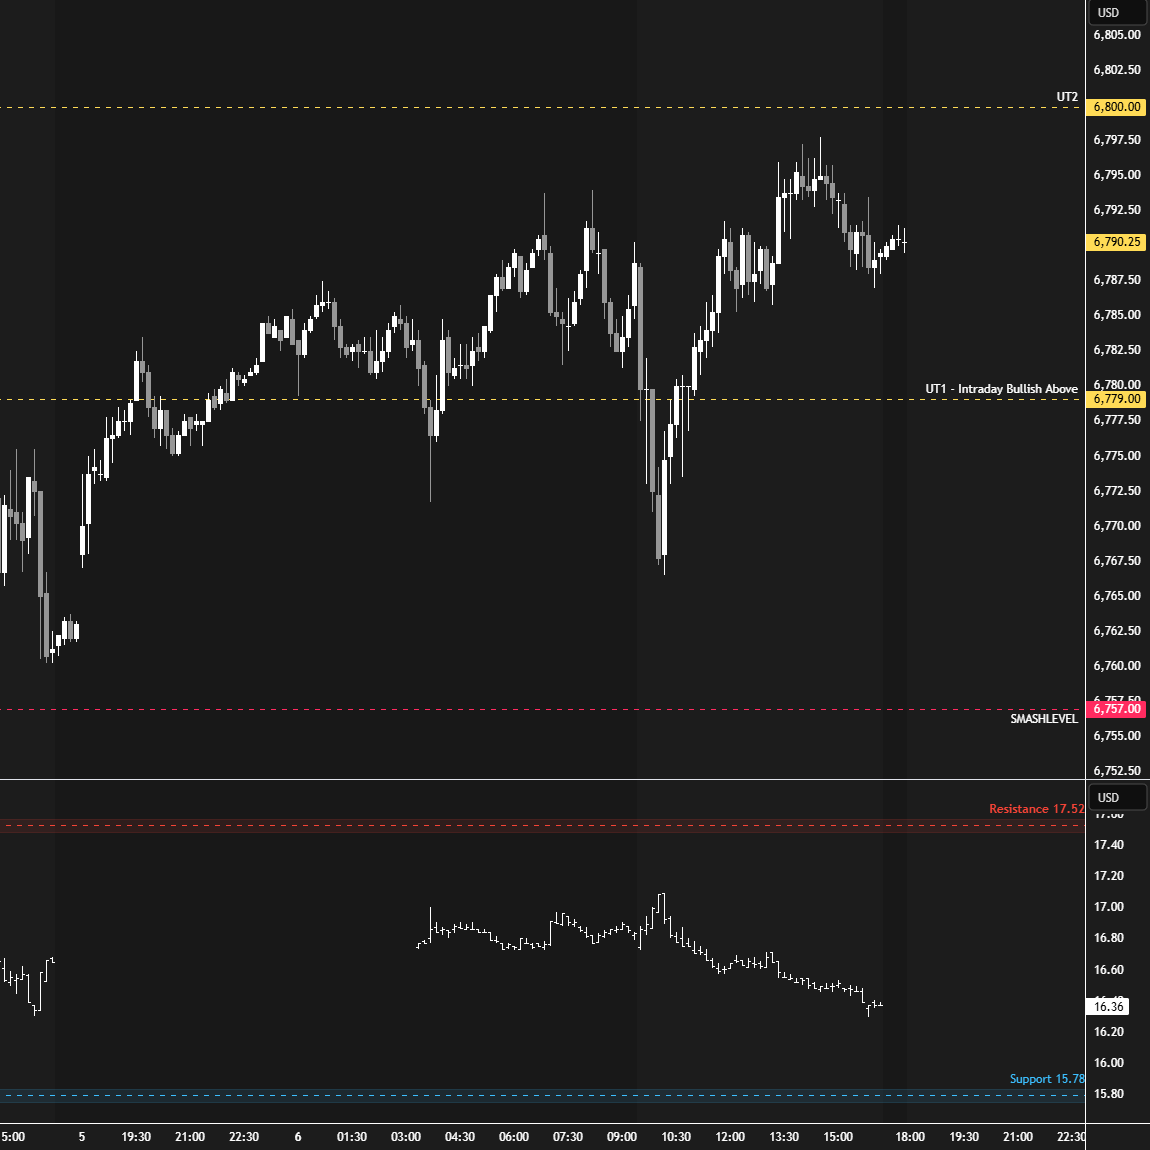
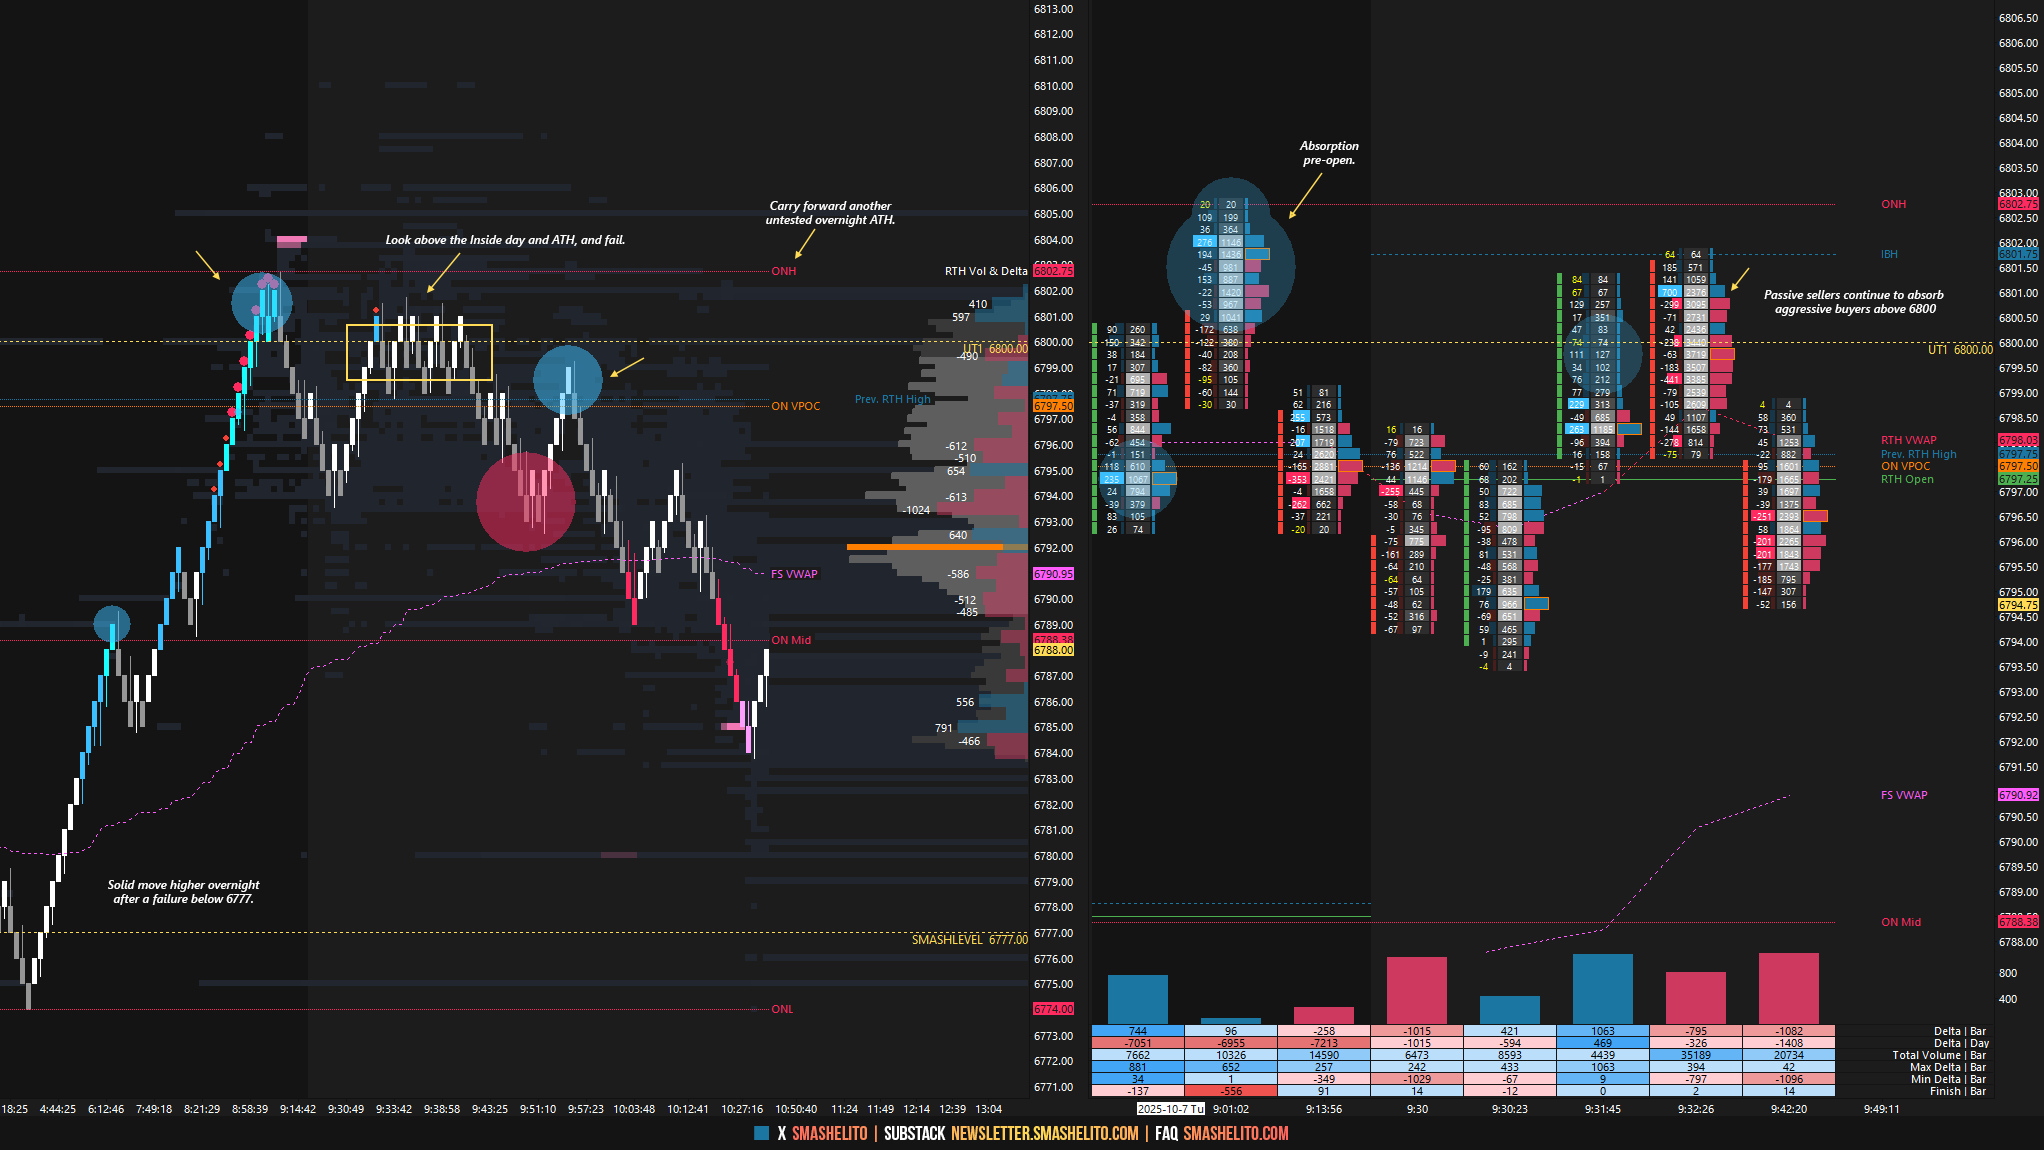
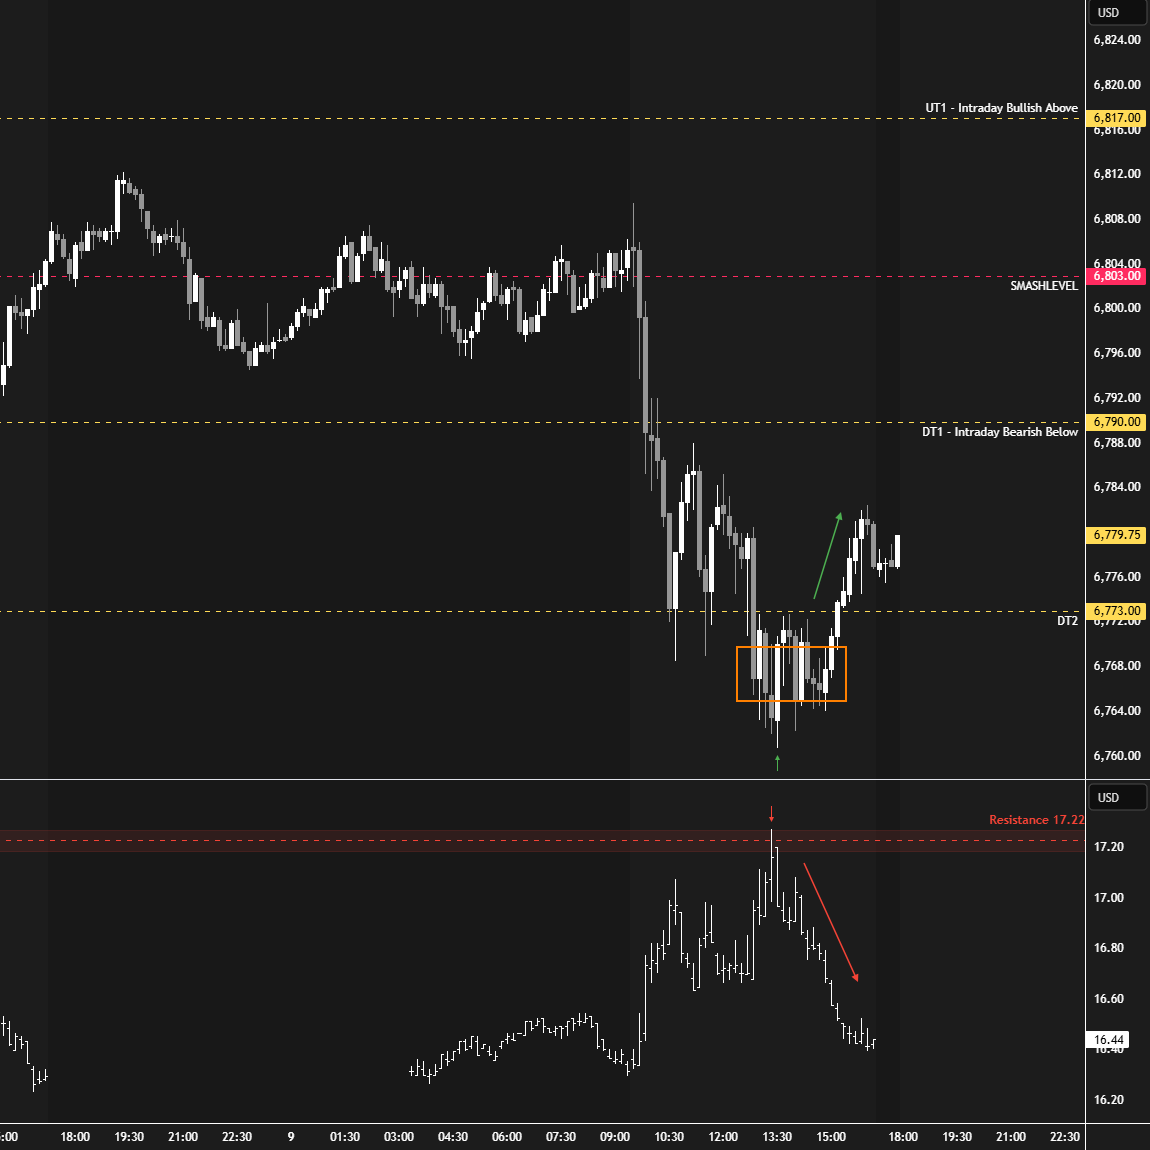
Tuesday’s session saw an inside day breakout attempt that failed, triggering long liquidation (see Figure 1). This was in line with the balance guidelines, which suggest that when a directional move fails to sustain, the market often targets the opposite side of the balance—provided there is acceptance back within the range.
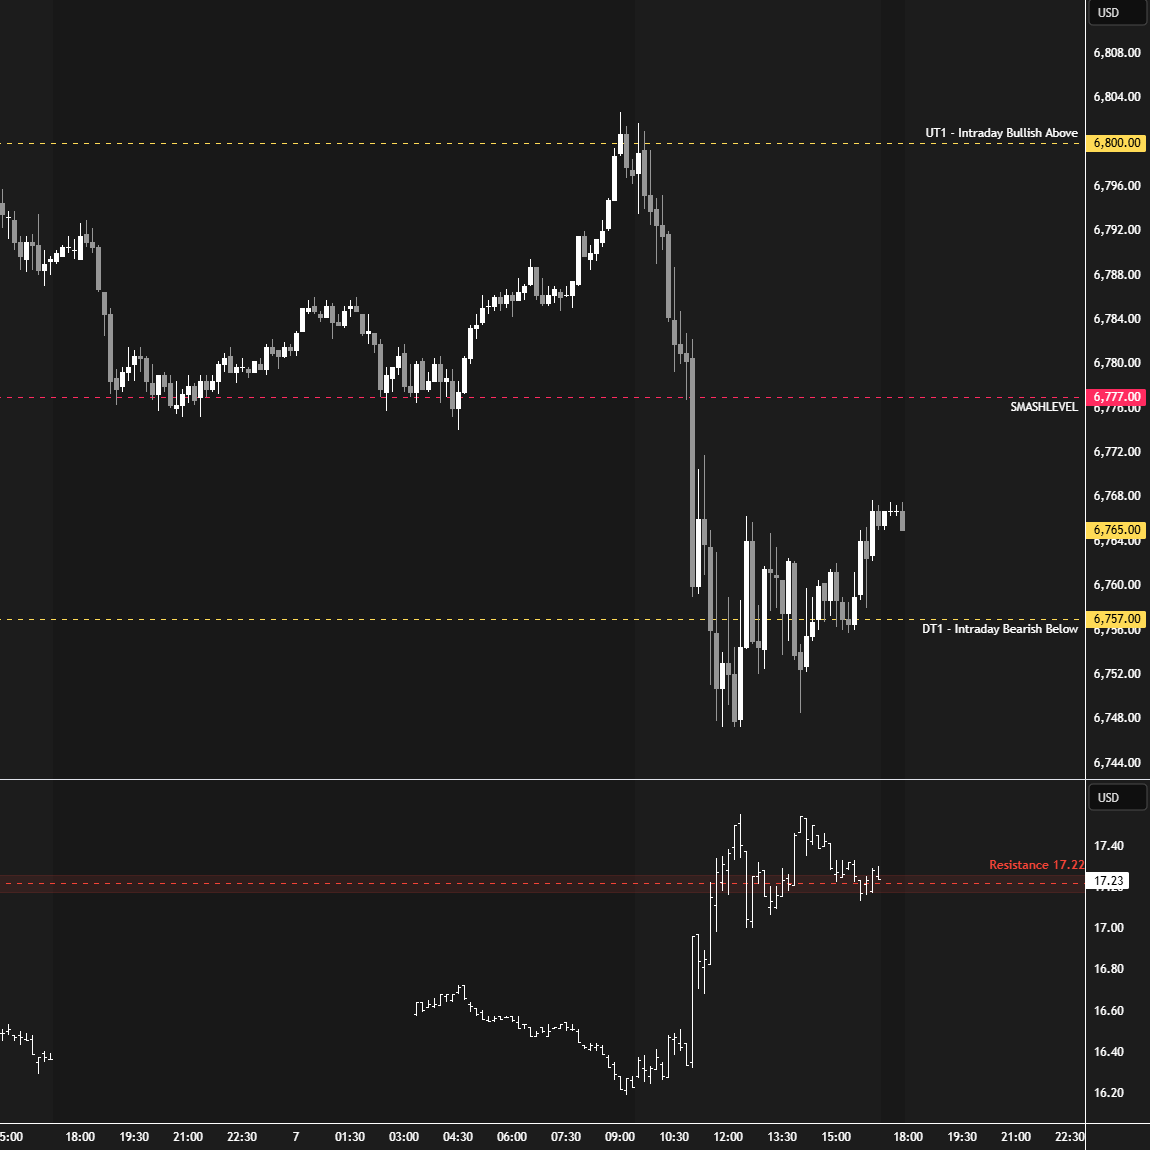
Wednesday fully retraced Tuesday’s liquidation break. A failed attempt to shift momentum often creates a trade opportunity in the direction of the prevailing trend. The session closed at the upper end of the daily balance. Buyers looked for an immediate breakout, while sellers hoped for a failed attempt to trigger short-term weakness.
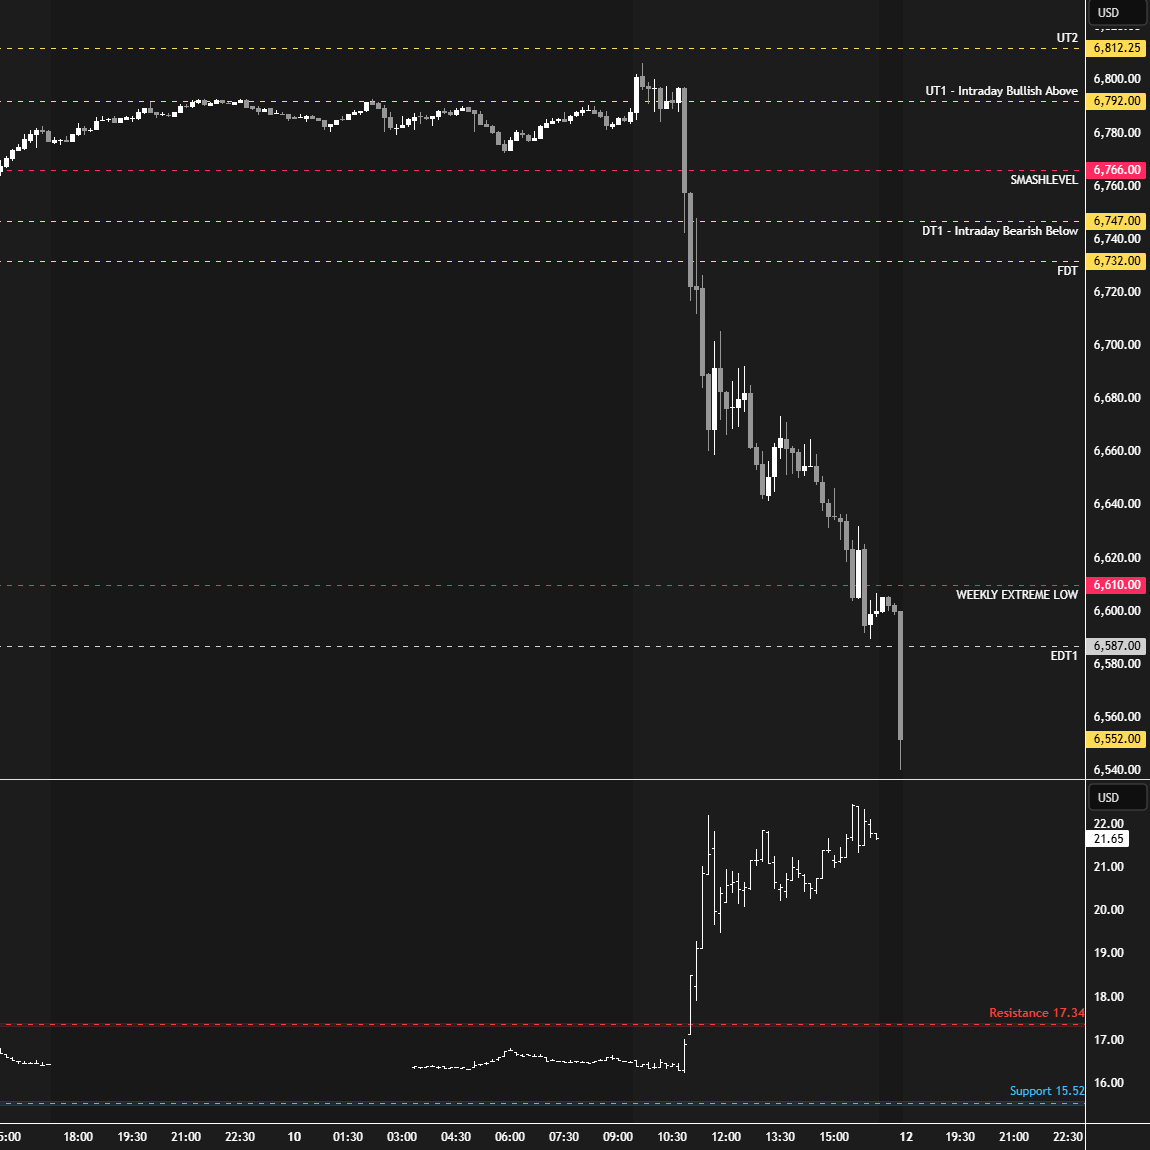
Thursday delivered what sellers wanted: a failed breakout triggering another wave of long liquidation. Overnight ATH printed at 6812.25, serving as a reference to carry forward. The key question for Friday: would this liquidation be retraced, or could sellers follow through to the downside?
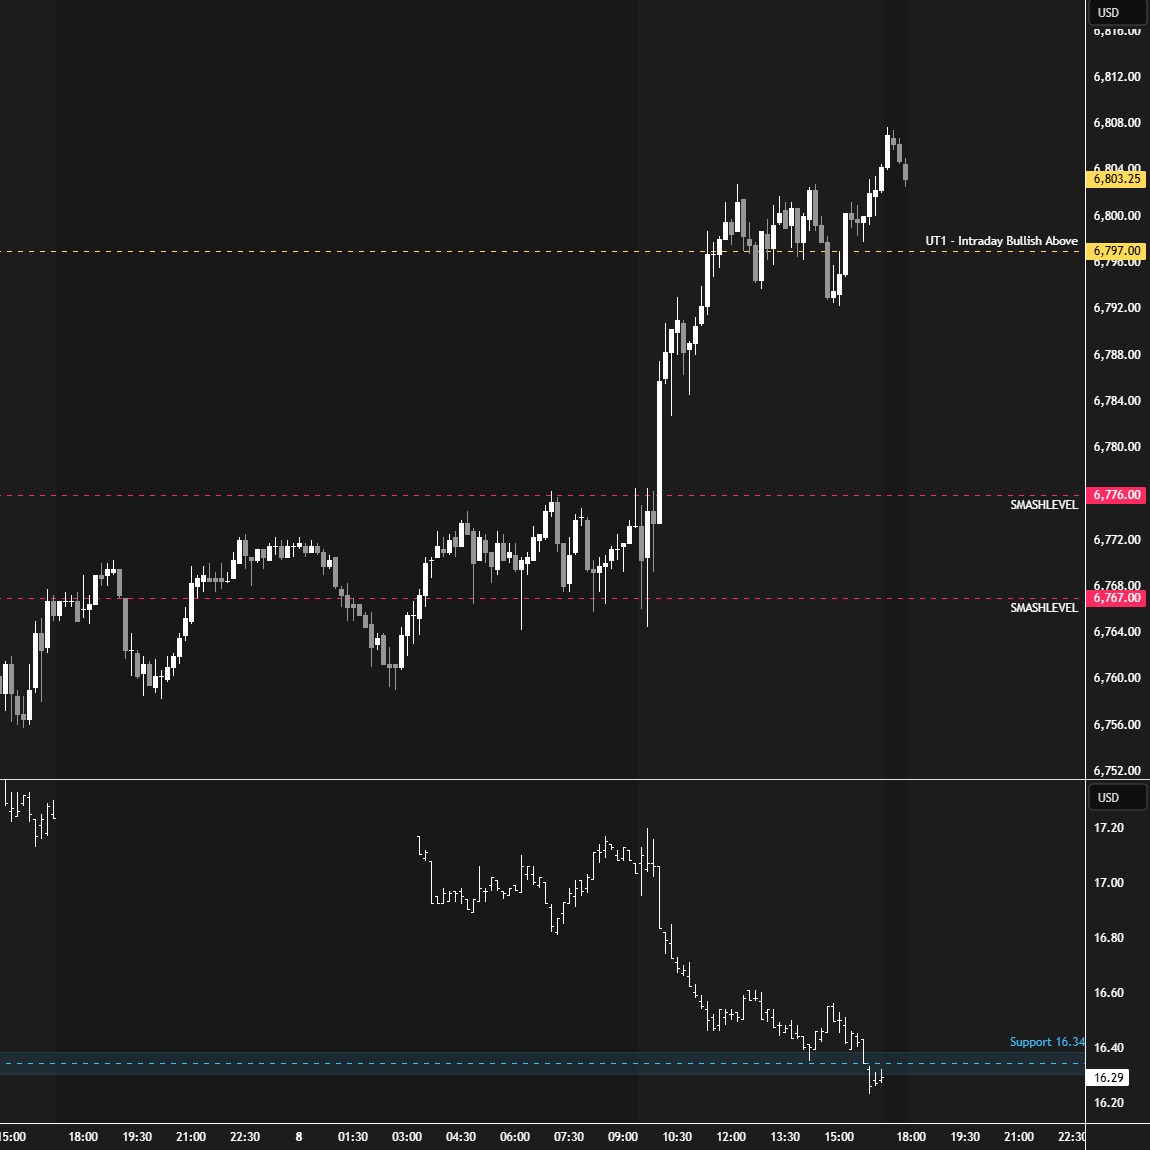
Friday’s session was significant: a multi-distribution trend day down, fueled by news headlines, essentially erased 20 days’ worth of gains and ended the weekly one-time framing up in the process. On top of that, a flush unfolded after hours, which will be key to monitor moving forward. The Weekly Extreme Low at 6610 was tagged during the closing session, then exceeded after hours.
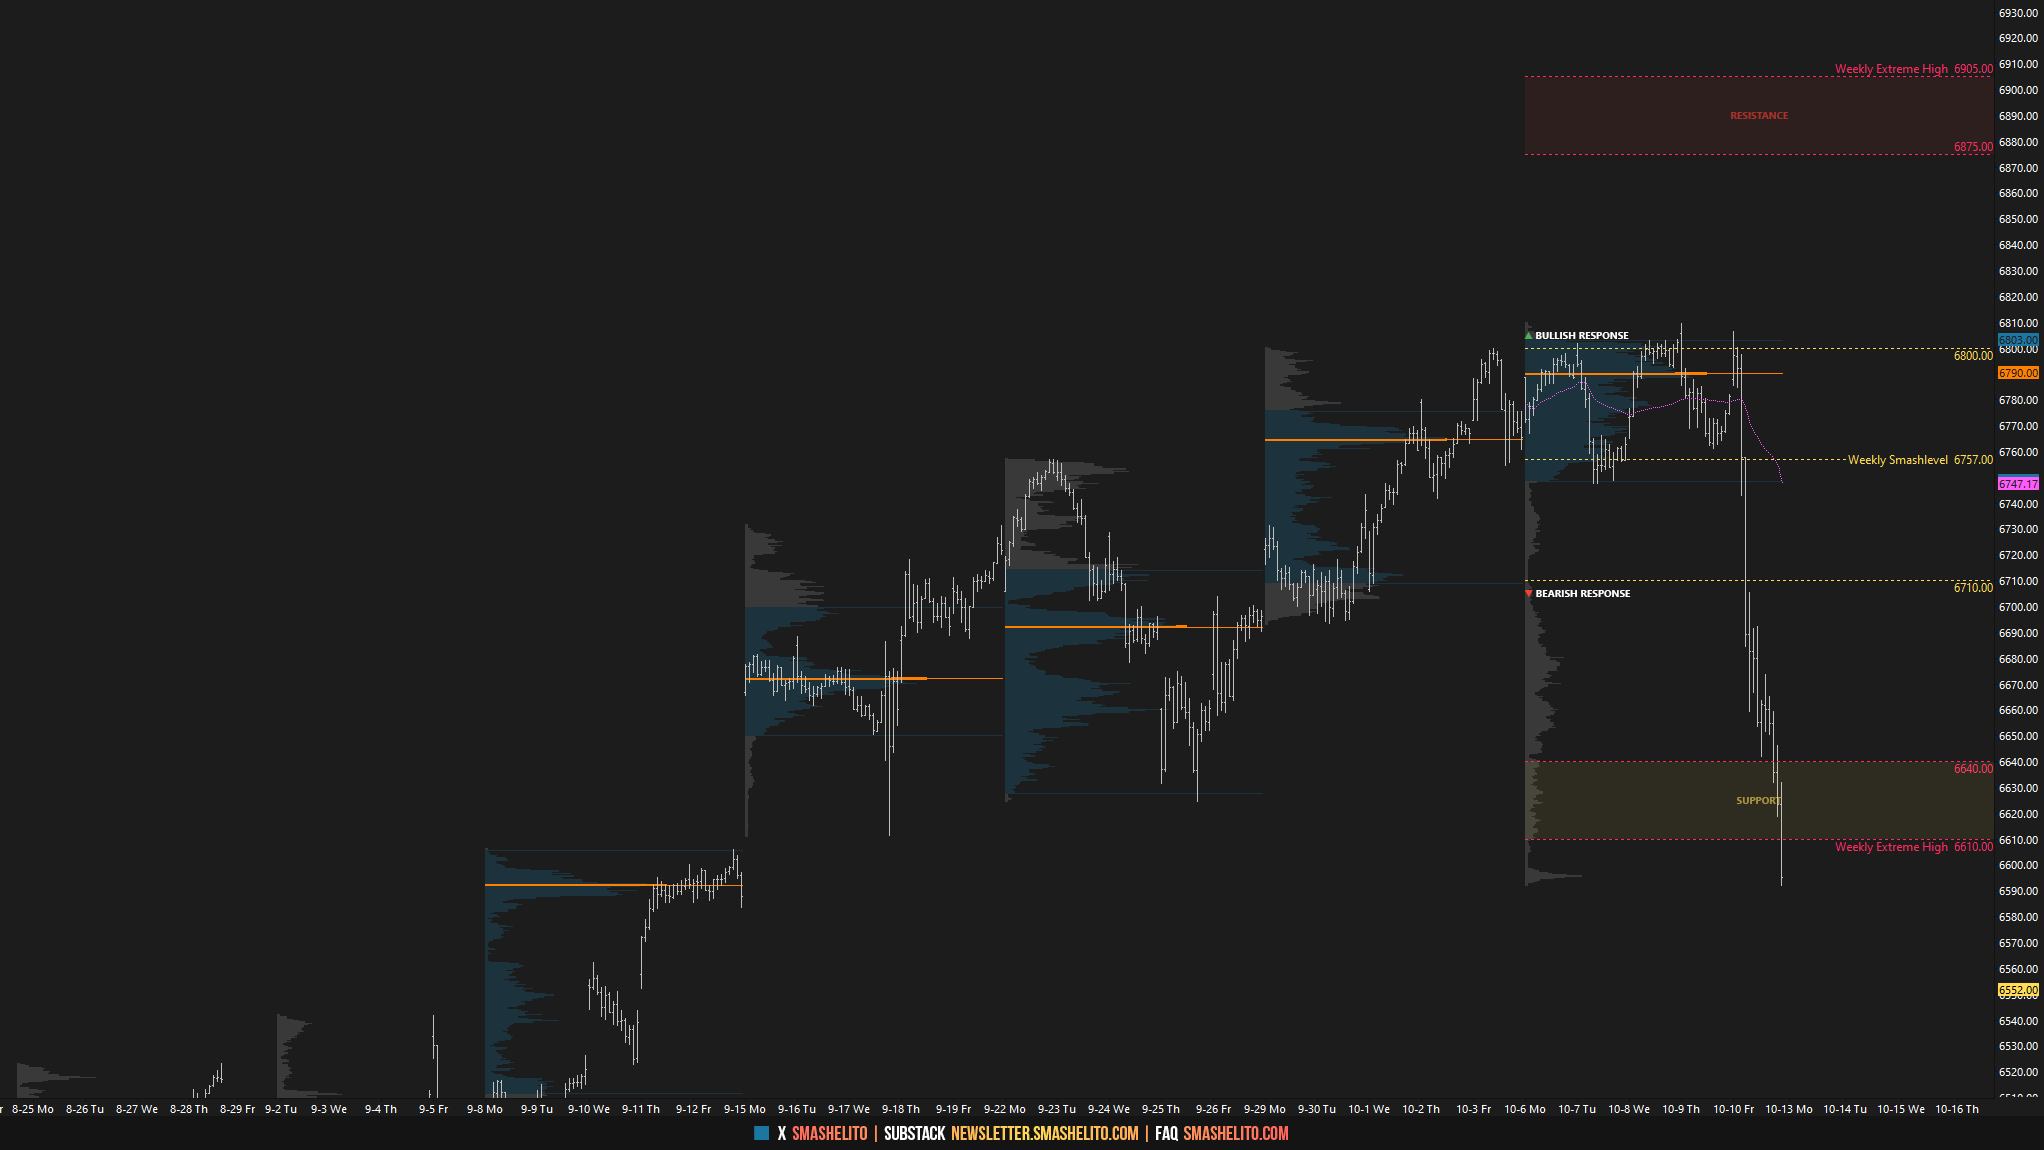
I will continue to include the HTF chart from a good friend of mine (see Figure 2), featuring levels generated by one of his models at the start of 2025. As you can see, this year’s price action has respected these levels remarkably well.
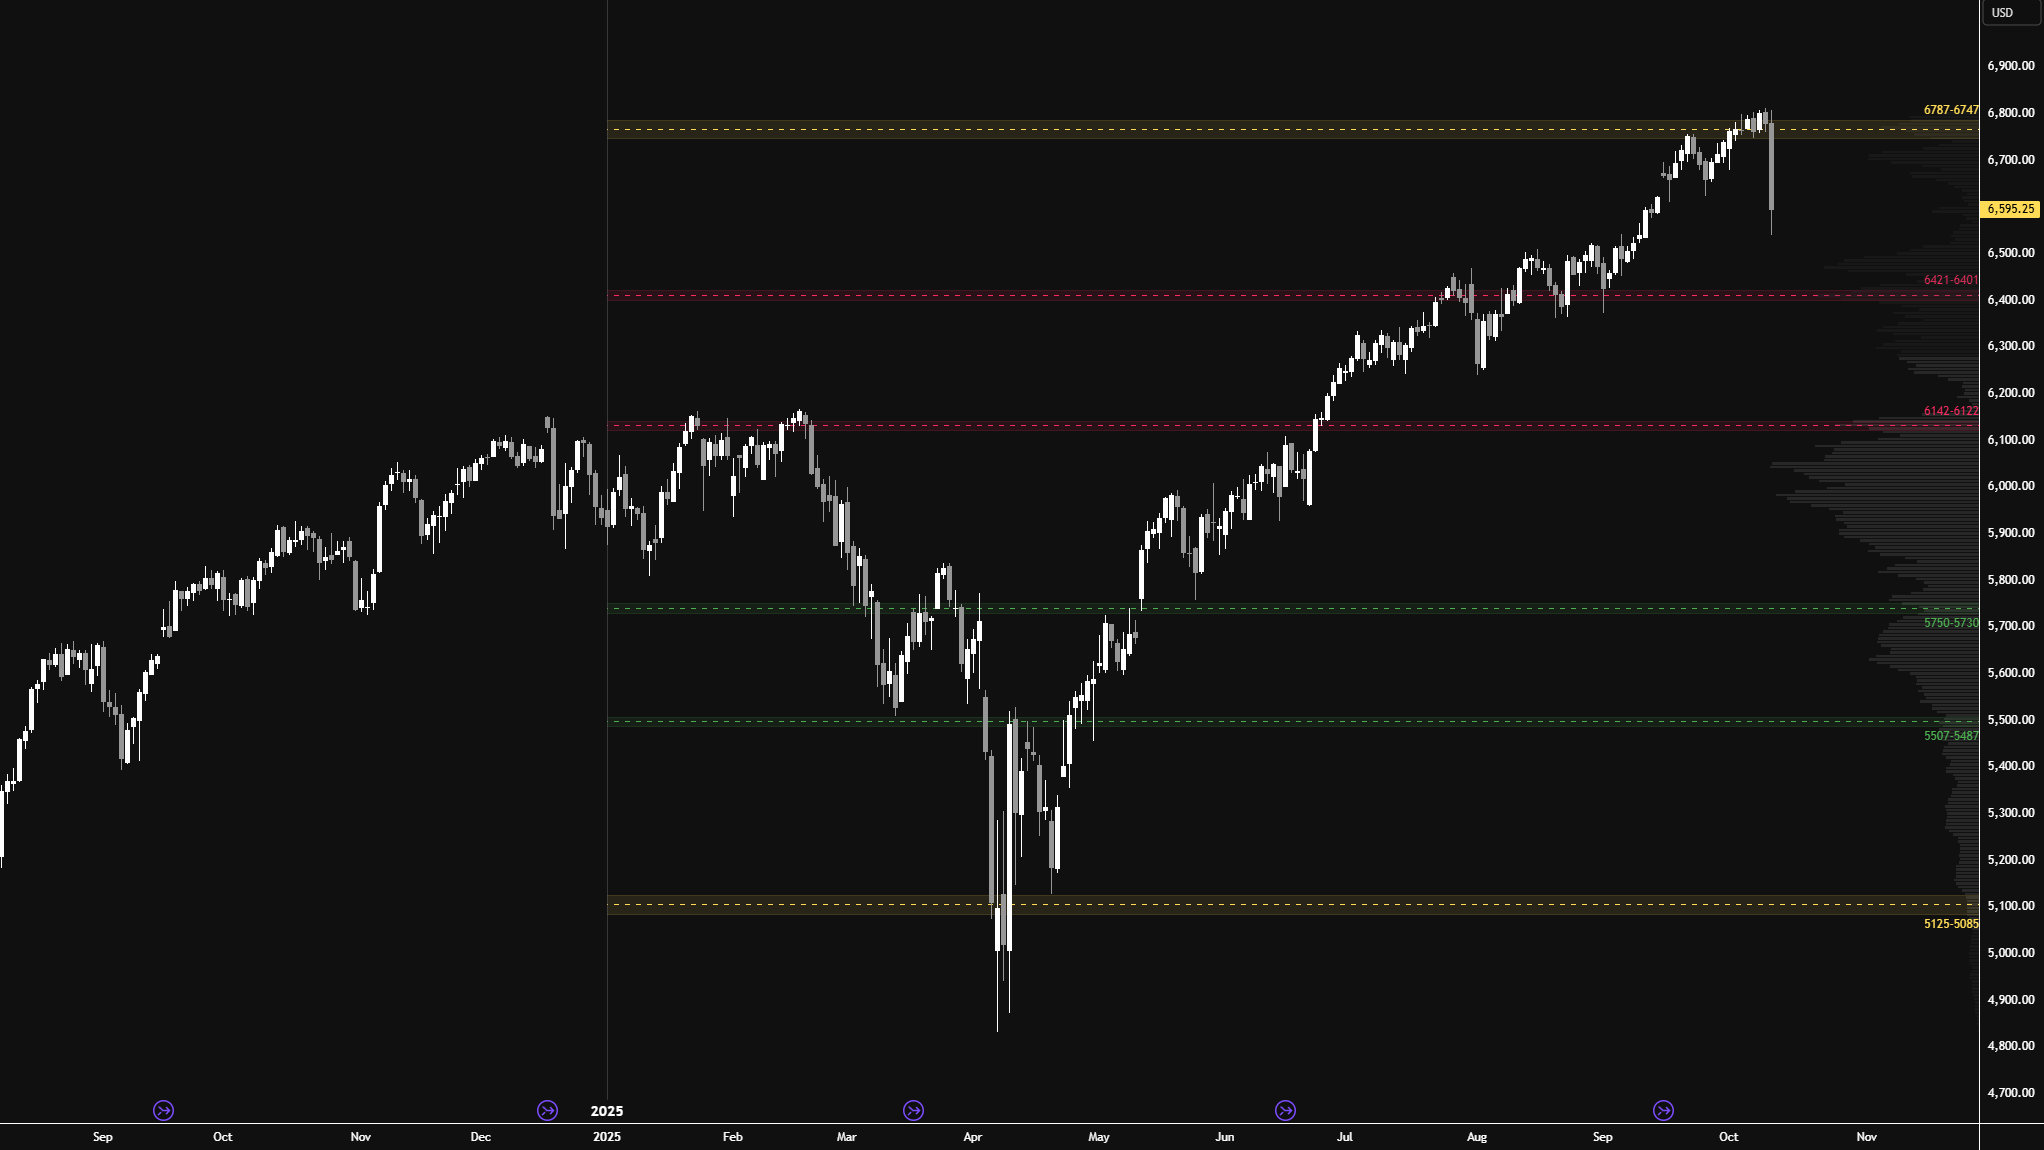
The market pulled back notably from the 6747–6787 area of interest this week. As discussed last week, the key takeaway was that the closer we got to this area, the less interested I was in initiating long-side swing trades. Waiting patiently for pullbacks to 6421–6401 or even 6142–6122 remains the more reasonable approach.
It remains to be seen where the market wants to go next. Friday was an emotional session, and that pattern will likely continue into next week, highlighting the importance of staying nimble.
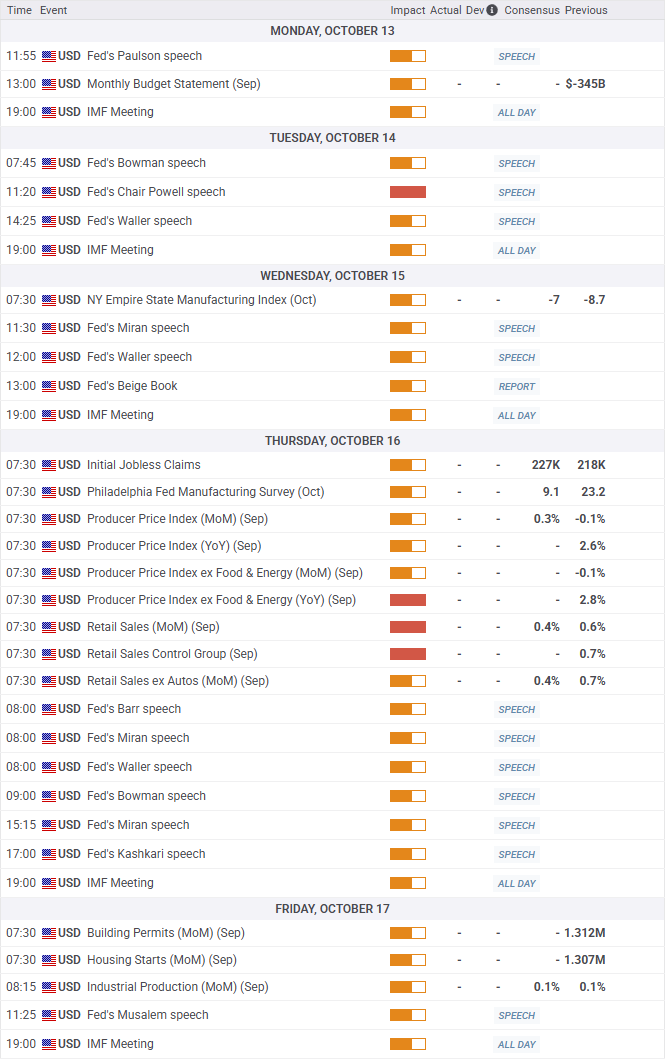
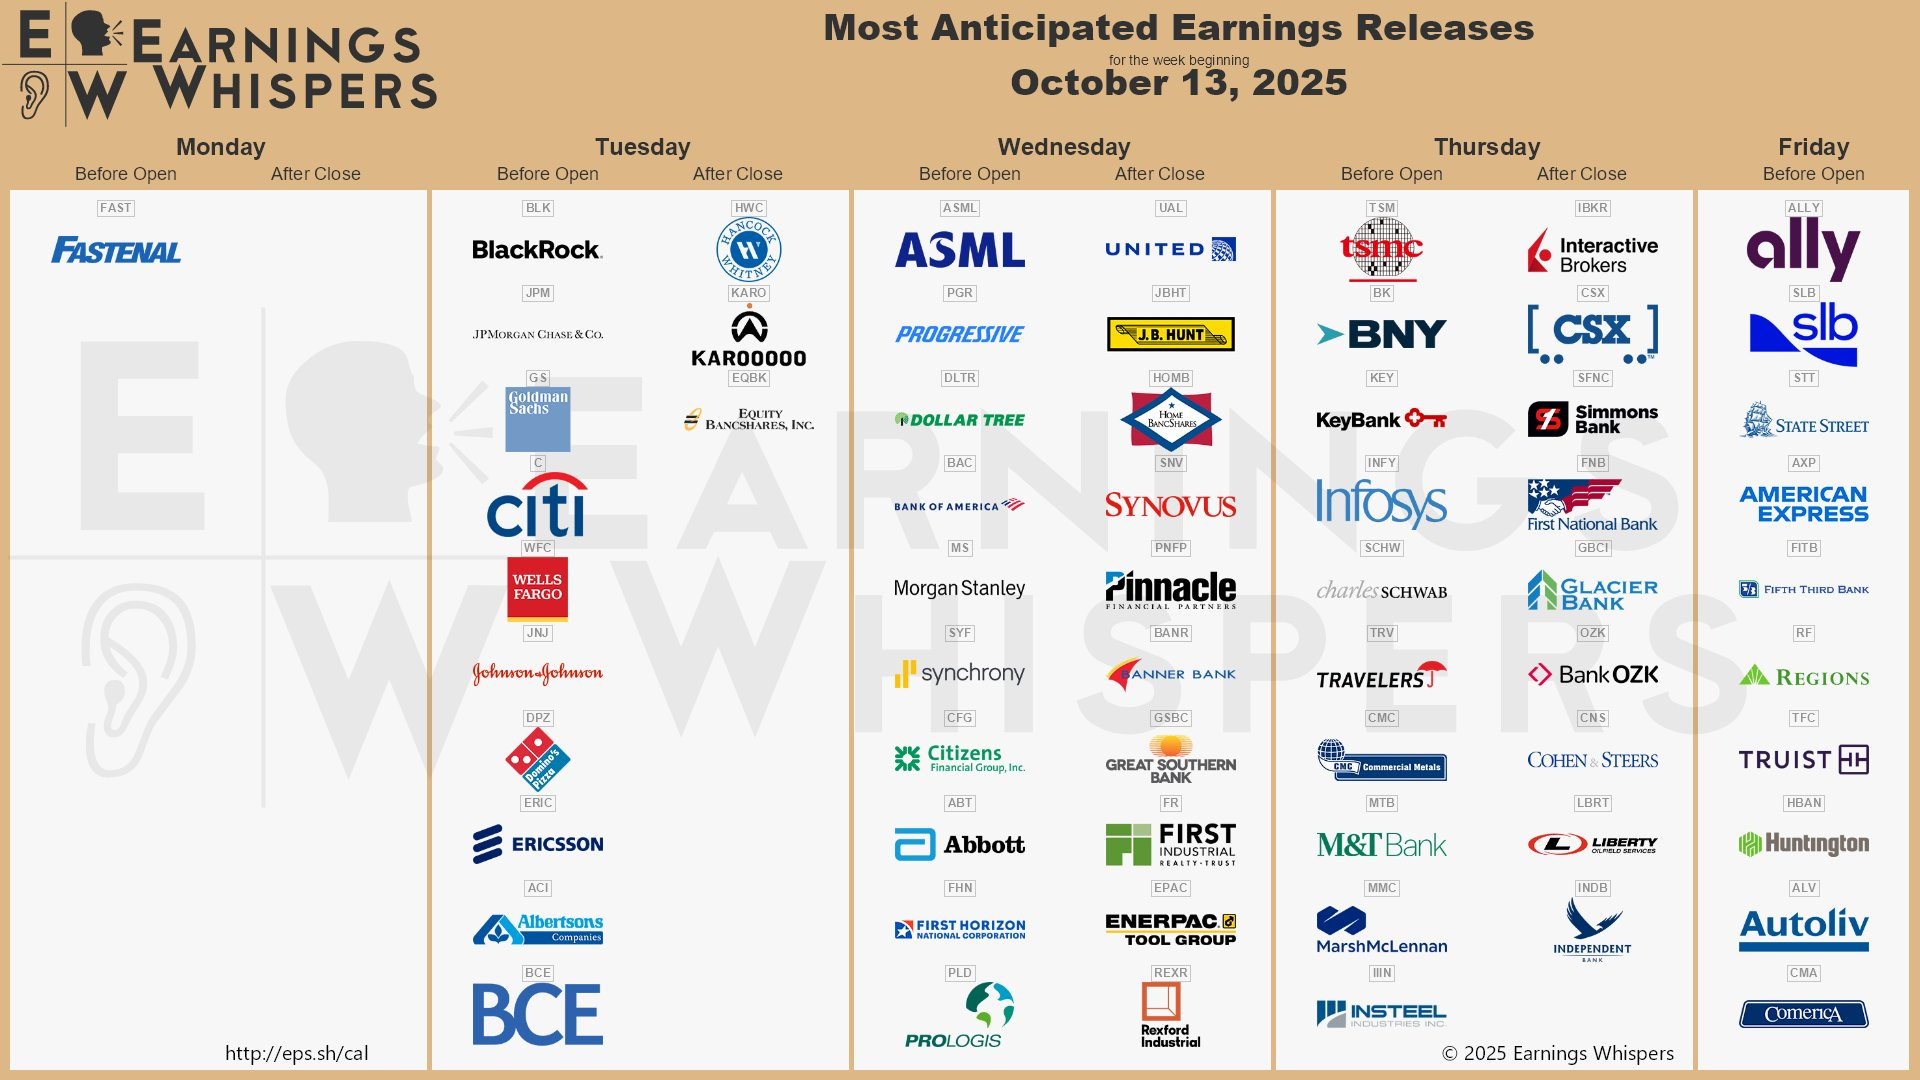
Economic & Earnings Calendar
Market Structure
🟥 Daily: OTFD → Ends at: 6806.50
🟨 Weekly: BALANCE → 4-Week → High: 6809.50 / Low: 6591.75
🟩 Monthly: OTFU → Ends at: 6371.75
Balance: A market condition where price consolidates within a defined range, reflecting indecision as the market awaits more market-generated information. We apply balance guidelines—favoring fade trades at range extremes (highs/lows) and preparing for breakout setups if balance resolves.
One-Time Framing Up (OTFU): A market condition where each subsequent bar forms a higher low, signaling a strong upward trend.
One-Time Framing Down (OTFD): A market condition where each subsequent bar forms a lower high, signaling a strong downward trend.
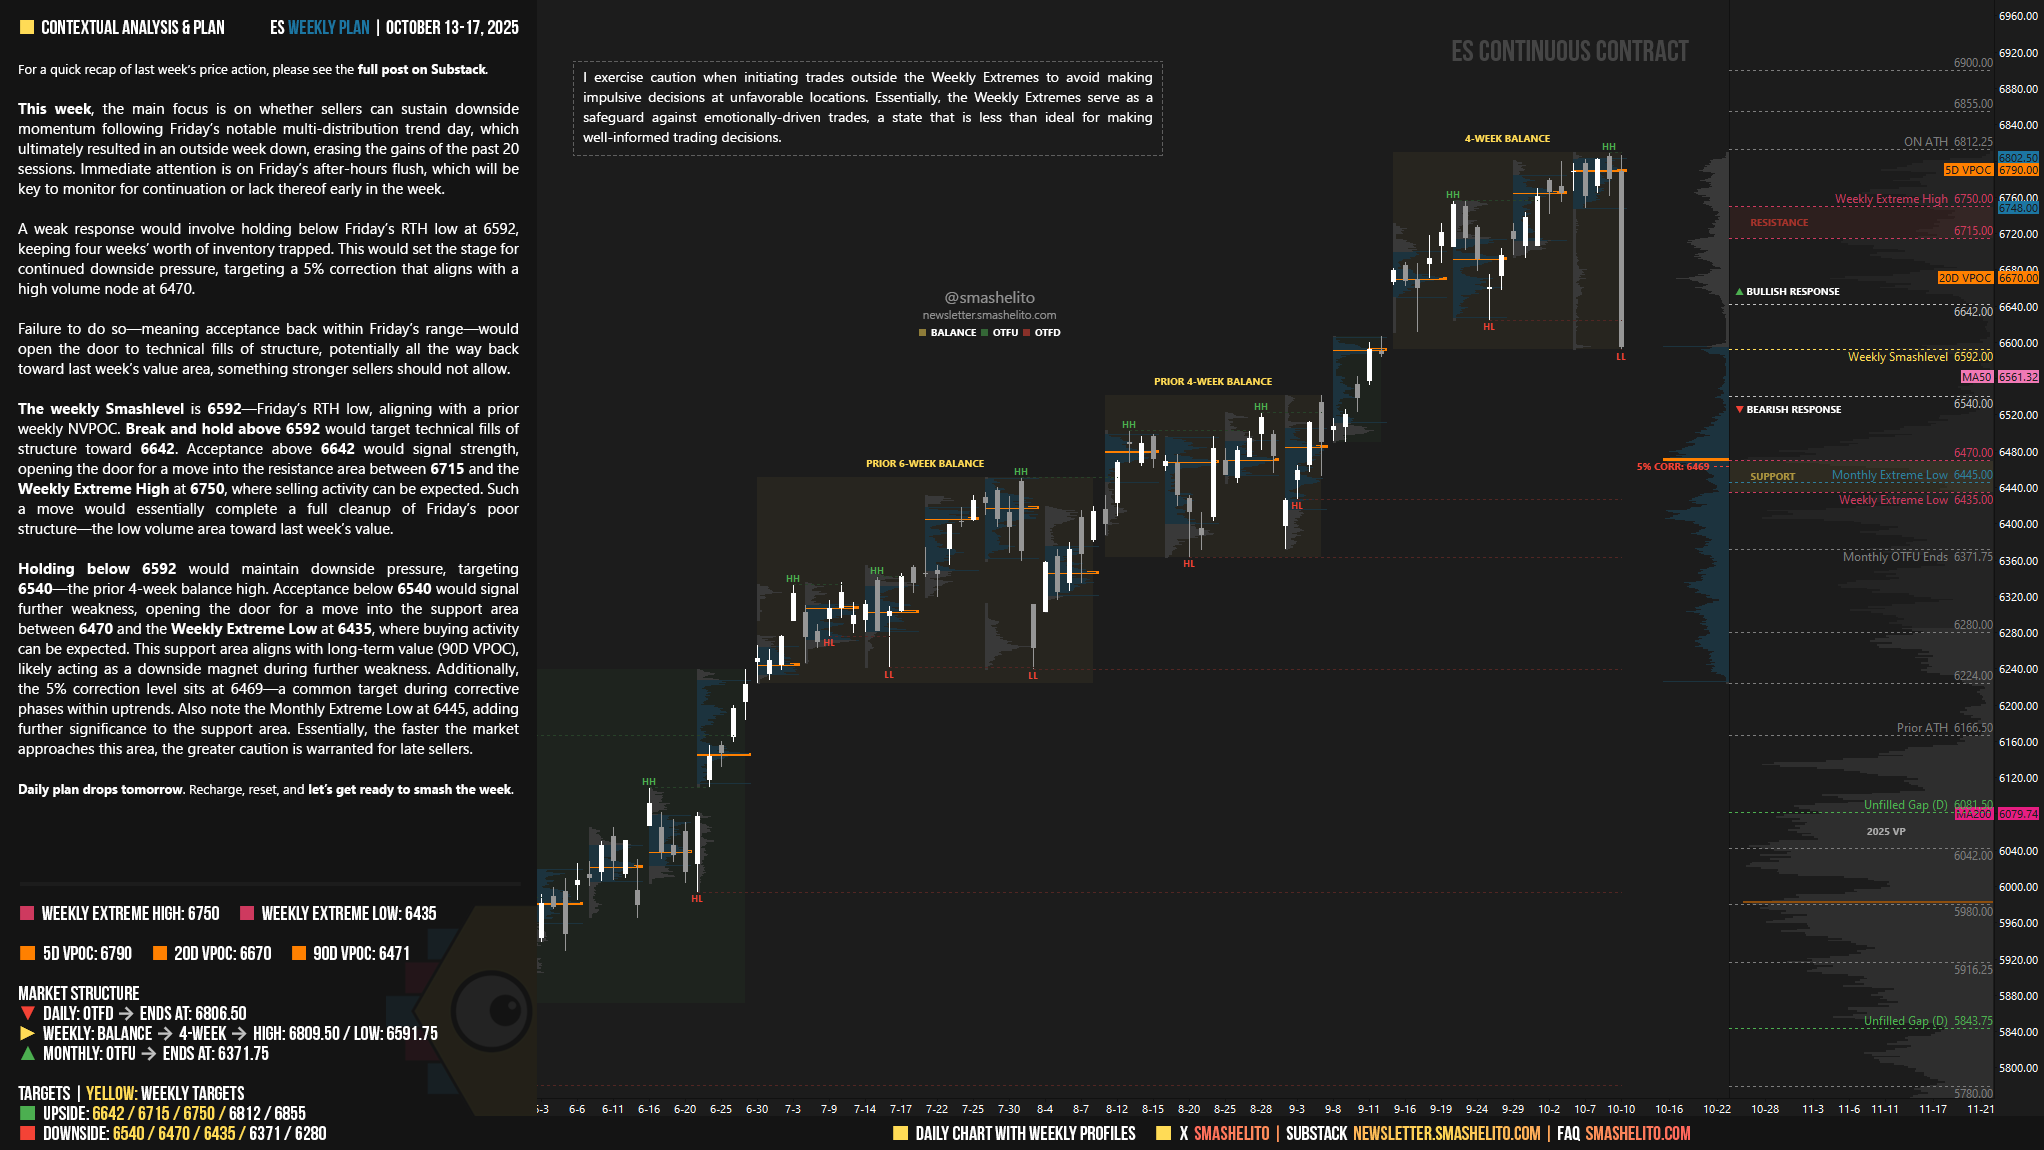
Contextual Analysis & Plan
This week, the main focus is on whether sellers can sustain downside momentum following Friday’s notable multi-distribution trend day, which ultimately resulted in an outside week down, erasing the gains of the past 20 sessions. Immediate attention is on Friday’s after-hours flush, which will be key to monitor for continuation or lack thereof early in the week.
A weak response would involve holding below Friday’s RTH low at 6592, keeping four weeks’ worth of inventory trapped. This would set the stage for continued downside pressure, targeting a 5% correction that aligns with a high volume node at 6470.
Failure to do so—meaning acceptance back within Friday’s range—would open the door to technical fills of structure, potentially all the way back toward last week’s value area, something stronger sellers should not allow.
The weekly Smashlevel is 6592—Friday’s RTH low, aligning with a prior weekly NVPOC. Break and hold above 6592 would target technical fills of structure toward 6642. Acceptance above 6642 would signal strength, opening the door for a move into the resistance area between 6715 and the Weekly Extreme High at 6750, where selling activity can be expected. Such a move would essentially complete a full cleanup of Friday’s poor structure—the low volume area toward last week’s value.
Holding below 6592 would maintain downside pressure, targeting 6540—the prior 4-week balance high. Acceptance below 6540 would signal further weakness, opening the door for a move into the support area between 6470 and the Weekly Extreme Low at 6435, where buying activity can be expected. This support area aligns with long-term value (90D VPOC), likely acting as a downside magnet during further weakness. Additionally, the 5% correction level sits at 6469—a common target during corrective phases within uptrends. Also note the Monthly Extreme Low at 6445, adding further significance to the support area. Essentially, the faster the market approaches this area, the greater caution is warranted for late sellers.
Key Levels of Interest
In the upcoming week, I will closely observe the behavior around 6592.
Break and hold above 6592 would target 6642 / 6715 / 6750* / 6812 / 6855
Holding below 6592 would target 6540 / 6470 / 6435* / 6371 / 6280
*Weekly Extremes. I exercise caution when initiating trades outside the Weekly Extremes to avoid making impulsive decisions at unfavorable locations. Essentially, the Weekly Extremes serve as a safeguard against emotionally-driven trades, a state that is less than ideal for making well-informed trading decisions.
Daily plan drops tomorrow. Recharge, reset, and let’s get ready to smash the week.
Thanks Smash. CPI is on Weds - don’t think the shutdown matters for this one.
Thank you! HTF chart strikes again!