
ES Weekly Plan | November 24-28, 2025
Recap, Market Context & Key Levels for the Week Ahead

Welcome to this week’s plan. Inside, you’ll find a quick review of last week’s price action, key economic events, market structure, context for the week ahead, and the levels I’ll be focusing on. Let’s get prepared.
Contents
Last Week in Review & Bonus Chart
Economic & Earnings Calendar
Market Structure
Contextual Analysis & Plan
Key Levels of Interest
Last Week in Review & Bonus Chart
Last week’s plan:

Heading into this week, the main focus was on whether sellers could do a better job of sustaining downside momentum than they did the previous week, having once again closed within the prior multi-week balance area. Notably, two of the past three weeks closed back inside that balance, yet all three weekly VPOCs from those weeks remained above it—making early value development especially important to monitor.
Immediate attention was on Friday’s short-covering rally, which produced a P-shaped profile. A strong response would involve new buying interest emerging within Friday’s main distribution, targeting a reclaim of 6790 and opening the door to filling the gap at 6852.
Sellers, meanwhile, aimed to build on last week’s lower high on the daily timeframe, treating Friday’s short-covering rally as an opportunity to reload at higher prices. Their broader objective was a move toward the multi-week balance lows, in an effort to end the monthly higher-lows pattern at 6591.75.
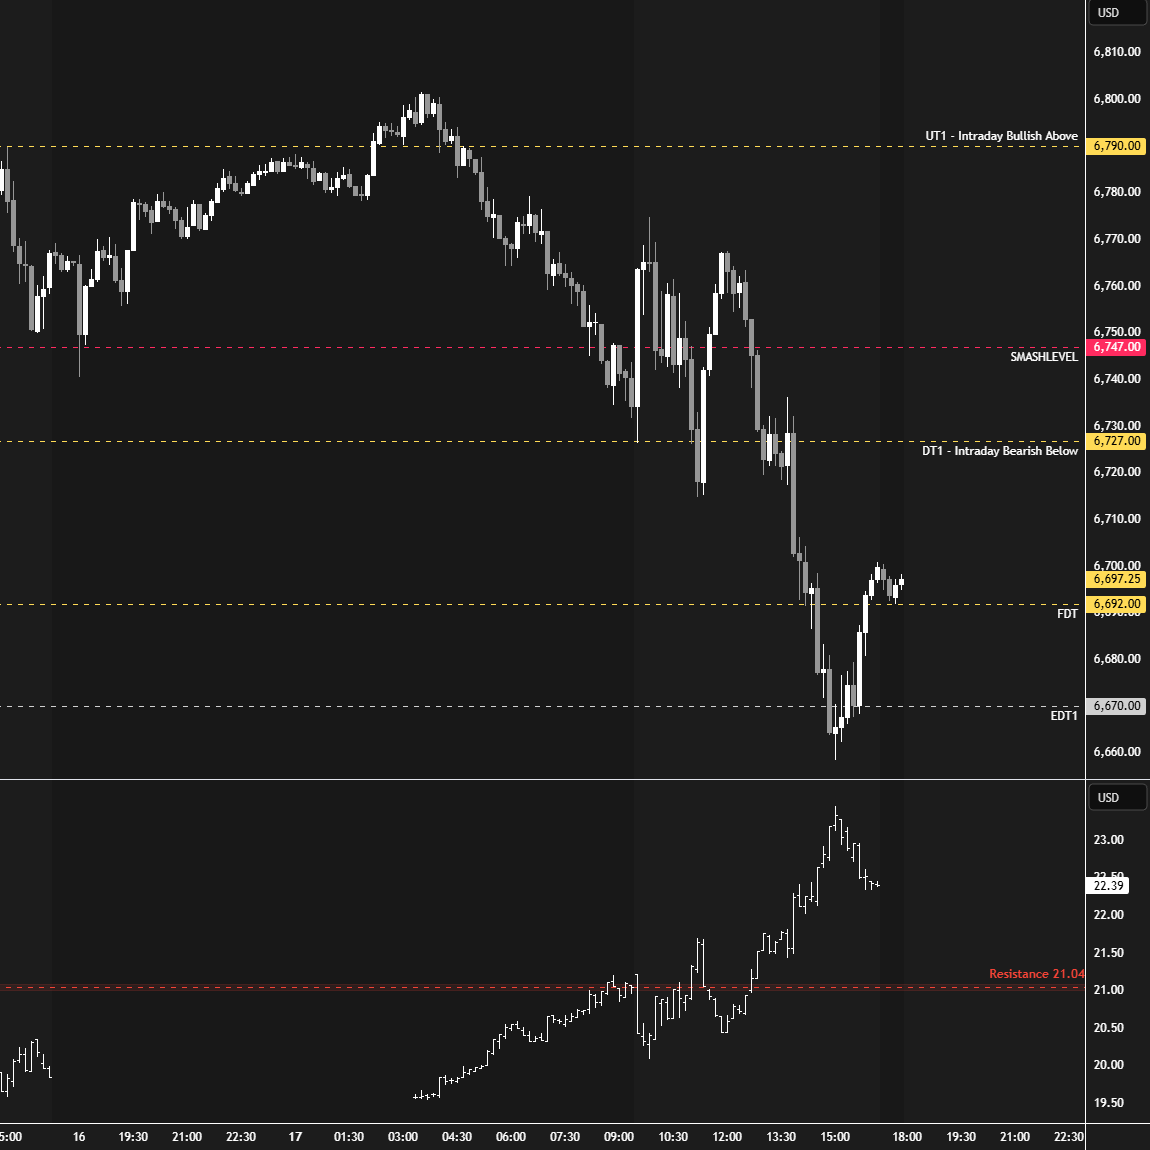
Monday kicked off the week with a breakout attempt out of Friday’s main distribution overnight, which ultimately resulted in a look above 6790 and fail, triggering weakness. The failure to attract new buying interest resulted in a double-distribution trend day to the downside.
Monday’s Auction
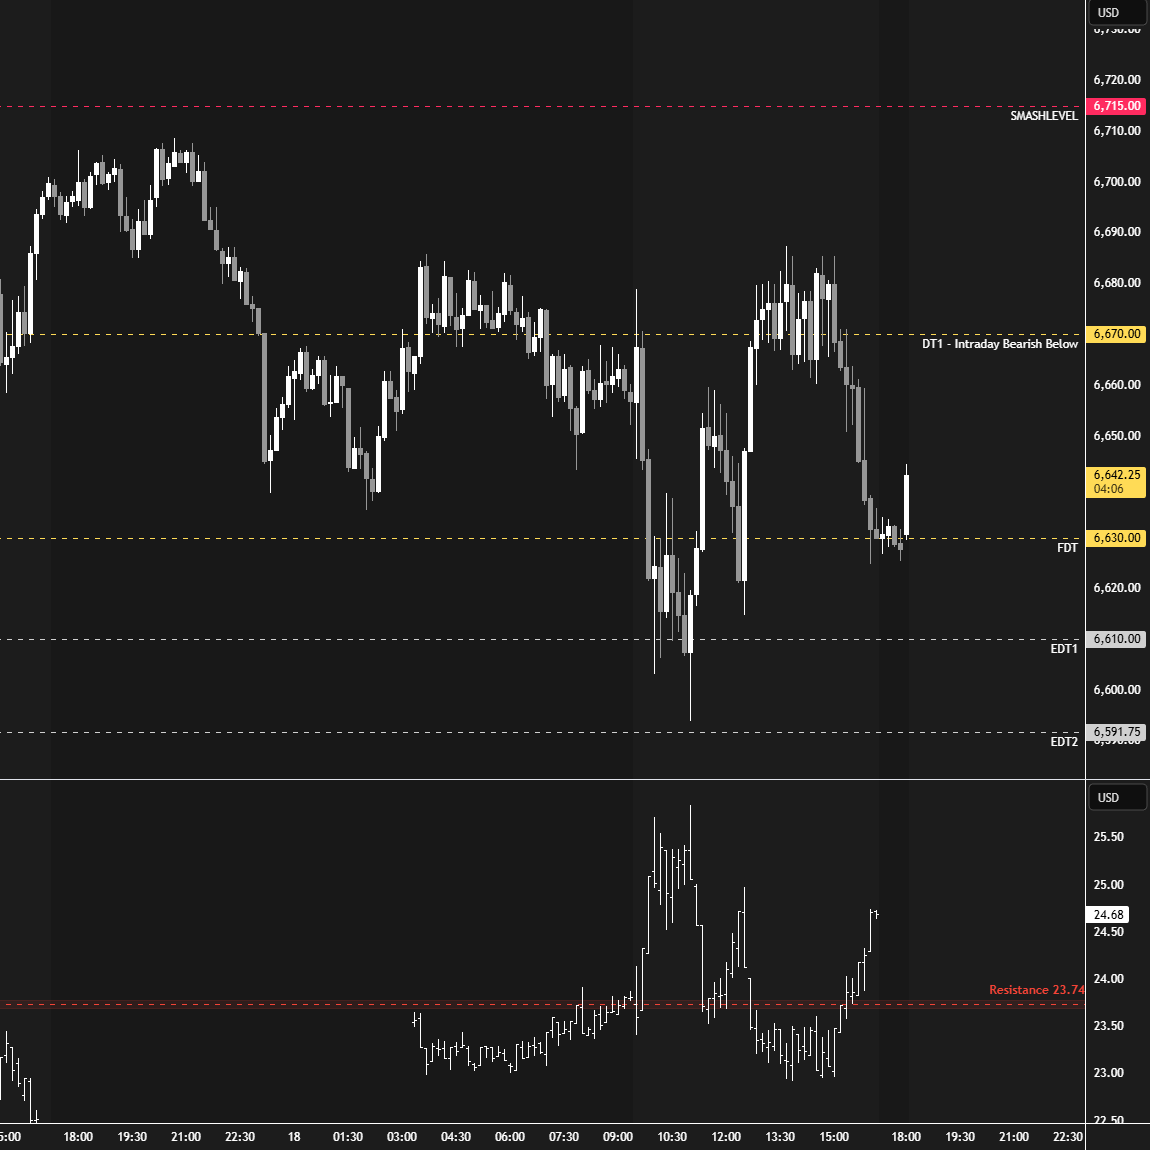
Tuesday’s session saw a continuation to the downside as price completed a traverse of the prior multi-week balance area, coming just two handles shy of ending the monthly one-time framing up at 6591.75. A 5% correction from the all-time high was completed (6604), testing the weekly support between 6610 and 6580 in the process.
Tuesday’s Auction
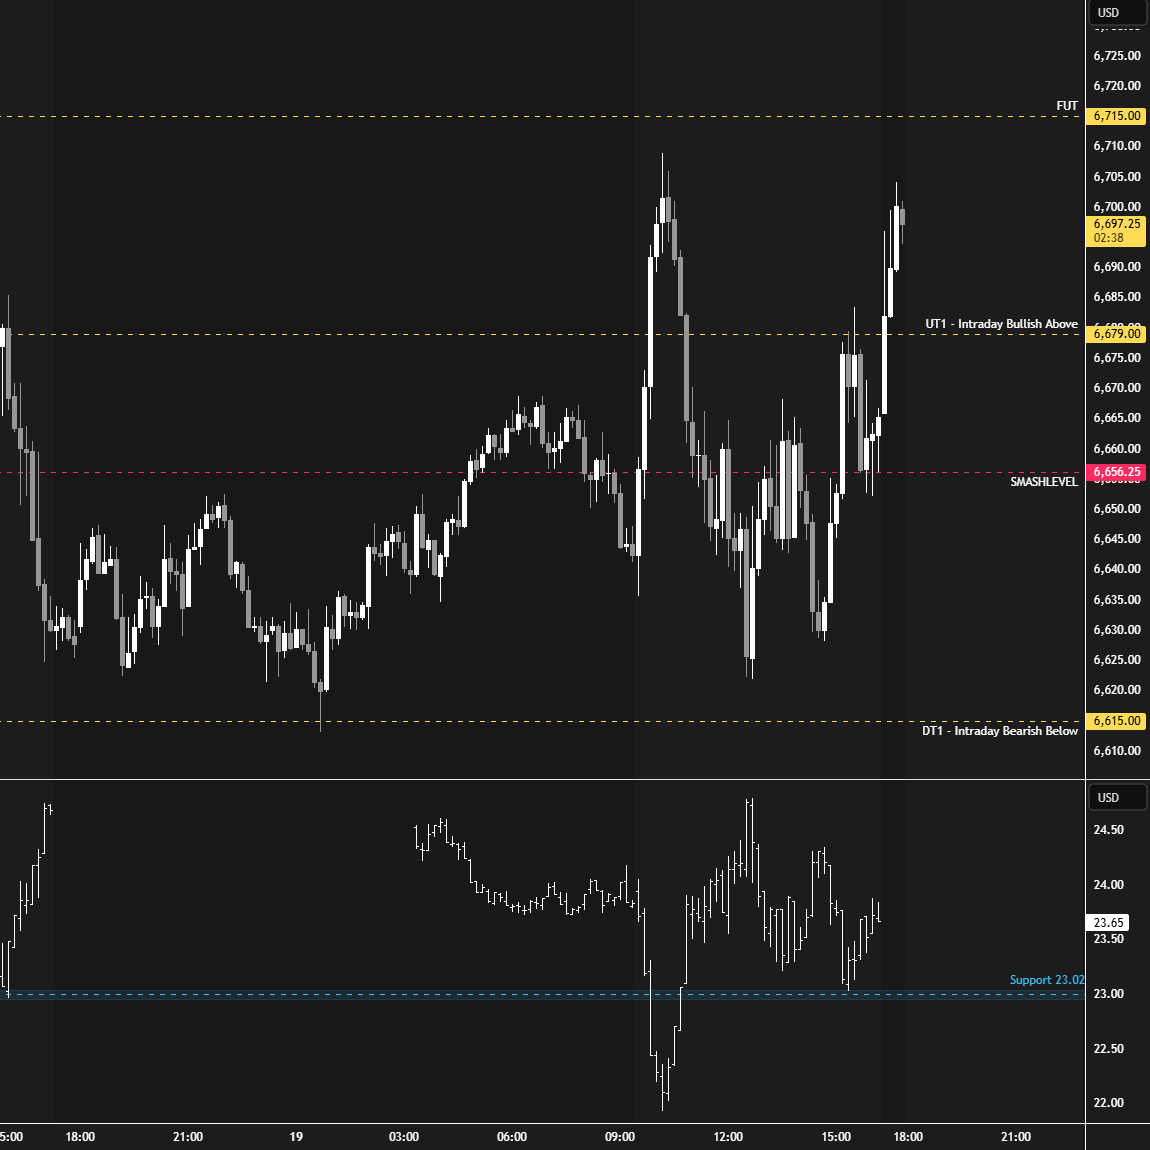
On Wednesday, the pattern of lower highs on the daily was broken, forming a 2-day balance that became a short-term area of interest—particularly its value area. After-hours strength driven by NVDA earnings pushed price above this composite value. The key going into Thursday’s session was to monitor whether this after-hours strength would be accepted or rejected.
Wednesday’s Auction
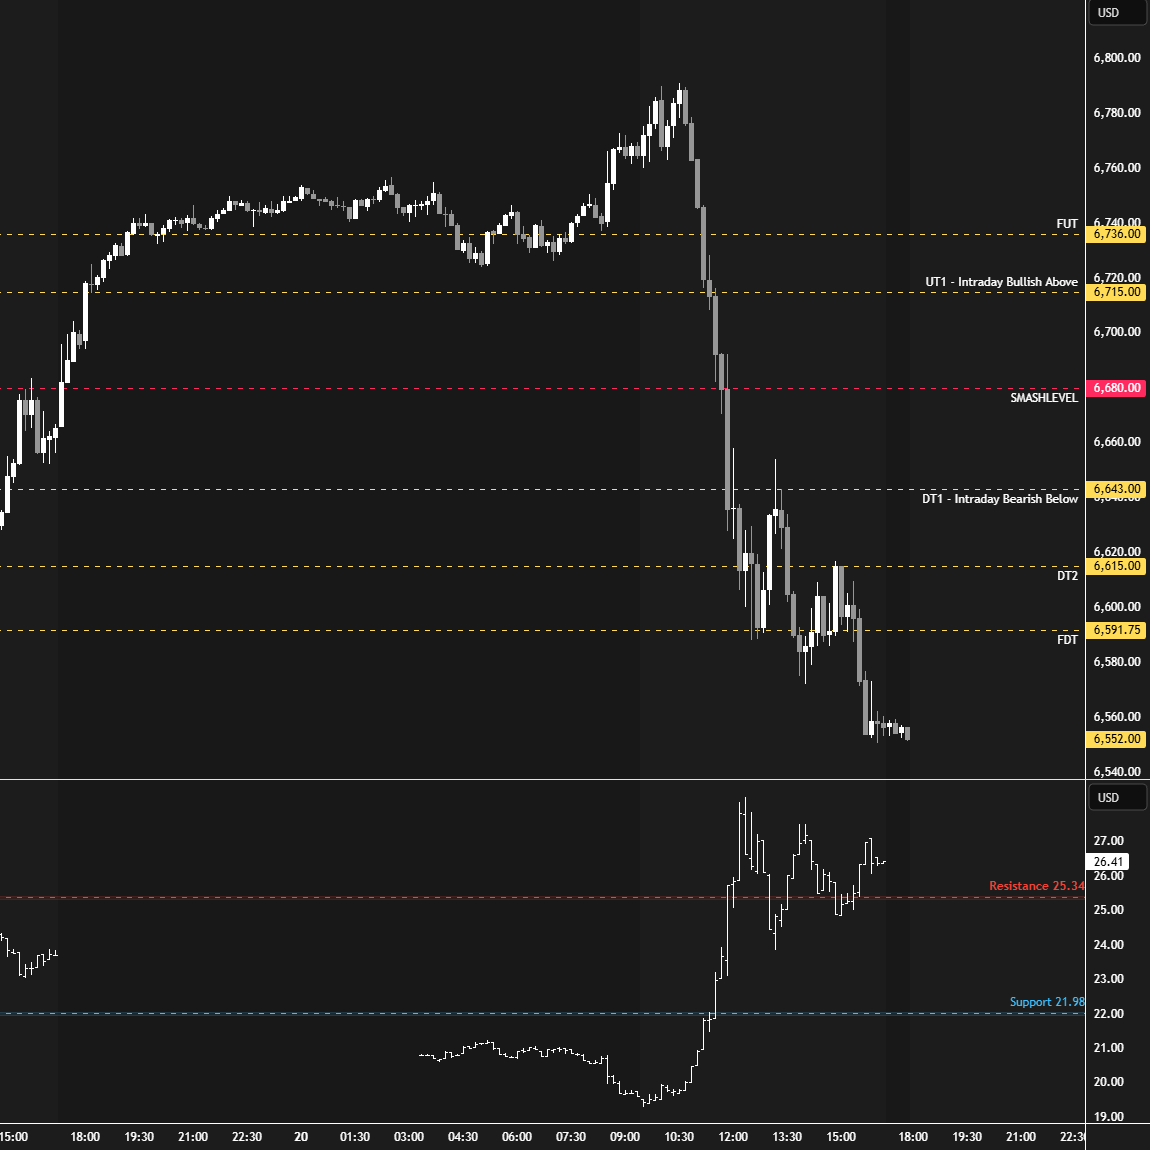
Thursday’s session was highly emotional. Emotional markets tend to push traders into impulsive, irrational decisions—stepping aside until things settle is never a bad idea. The after-hours strength driven by NVDA earnings carried over into the overnight session, during which all intraday upside targets were achieved and exceeded. The key question was how appealing it was to chase longs after such a notable overnight move, given that short-term control had been in favor of sellers and that short-covering rallies tend to weaken the market in a downtrend.
The market tested the critical 6790 level in the RTH session, from which a notable 250-handle drop unfolded. An outside day down was established, with sellers achieving their objective to end the monthly one-time framing up by breaching the 6591.75 level.
Thursday’s Auction
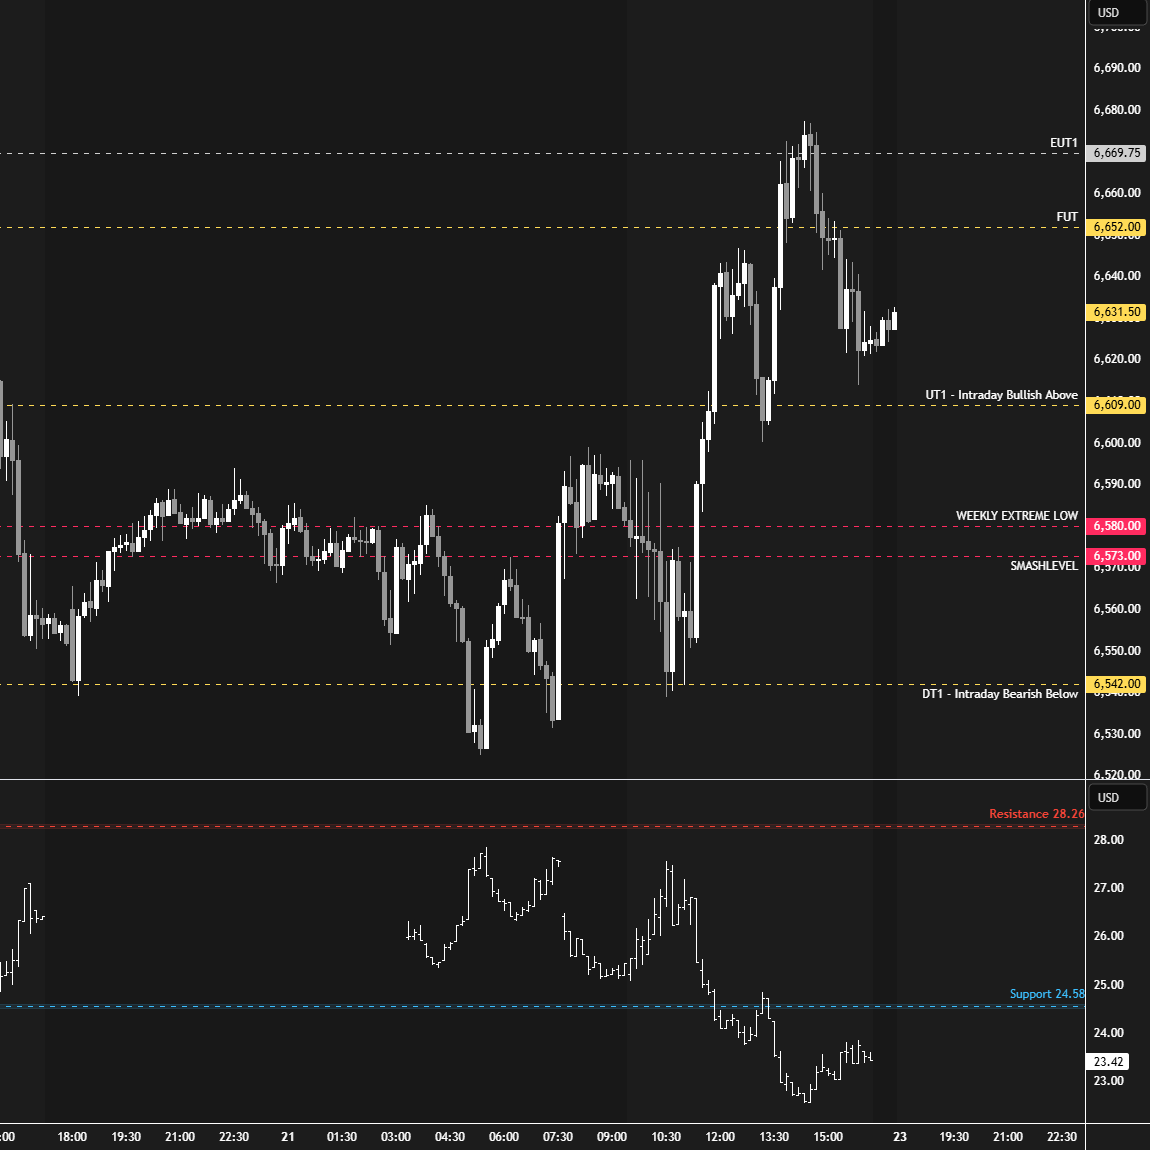
On Friday, sellers applied downside pressure overnight; however, the Monthly Extreme Low at 6542 stalled the momentum. As discussed during the week, despite sellers being in control, approaching both the Weekly (6580) and Monthly (6542) Extremes made it tricky to be an aggressive seller. Buyers ultimately defended 6542, triggering a solid counter-move. The week closed back within the prior multi-week balance area.
Friday’s Auction
Price Action vs. Weekly Levels

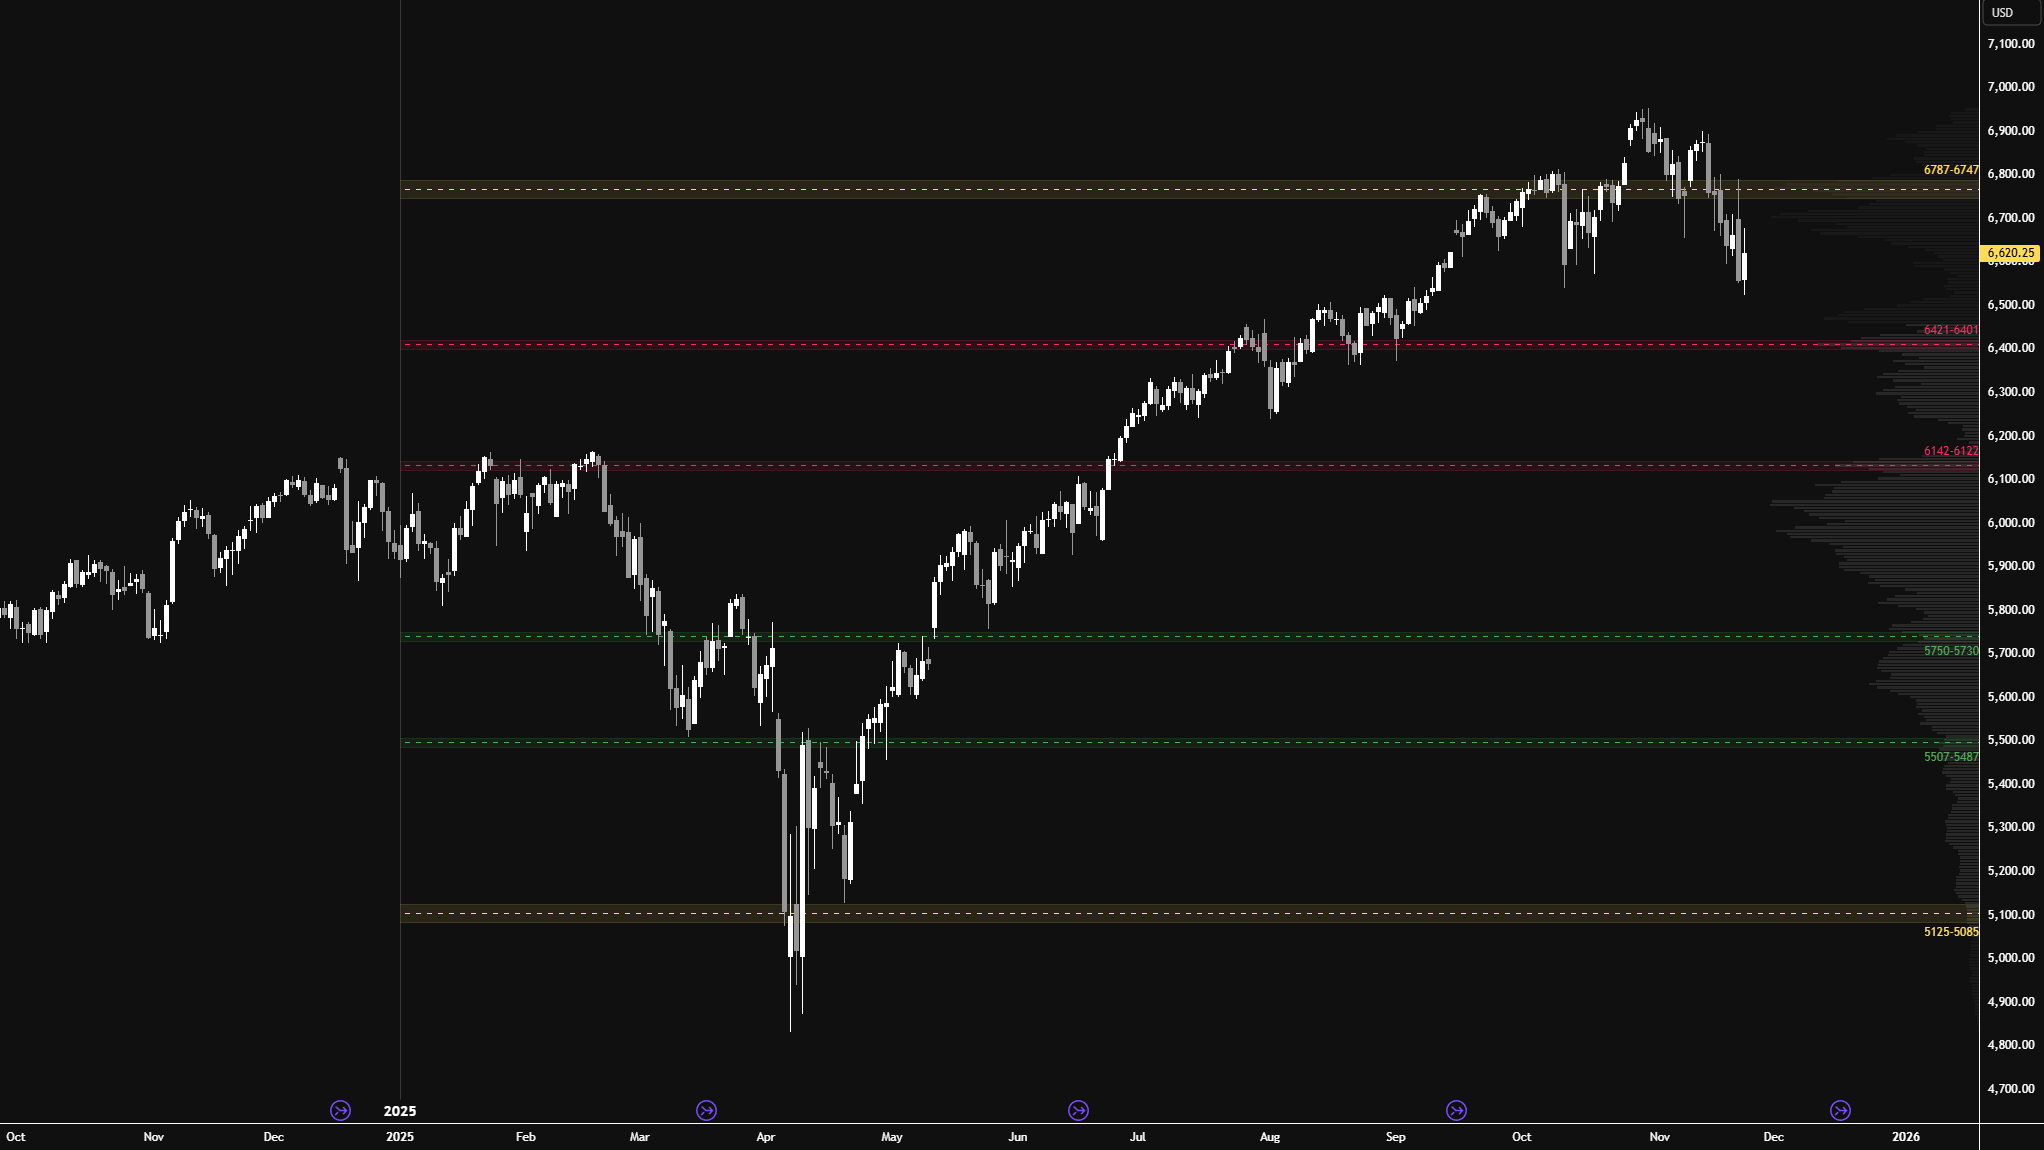
I will continue to include the HTF chart from a good friend of mine, featuring levels generated by one of his models at the start of 2025. As you can see, this year’s price action has respected these levels remarkably well.
As discussed, the door to weakness would only open with acceptance back below the 6747–6787 area of interest. Last week, that area was breached and met with selling activity on Thursday’s retest, ultimately ending the pattern of higher lows on the monthly chart.
The key question now is whether the market will test the 6421–6401 area of interest next, or if buyers will defend the notable low volume area.
Higher Time Frame Levels
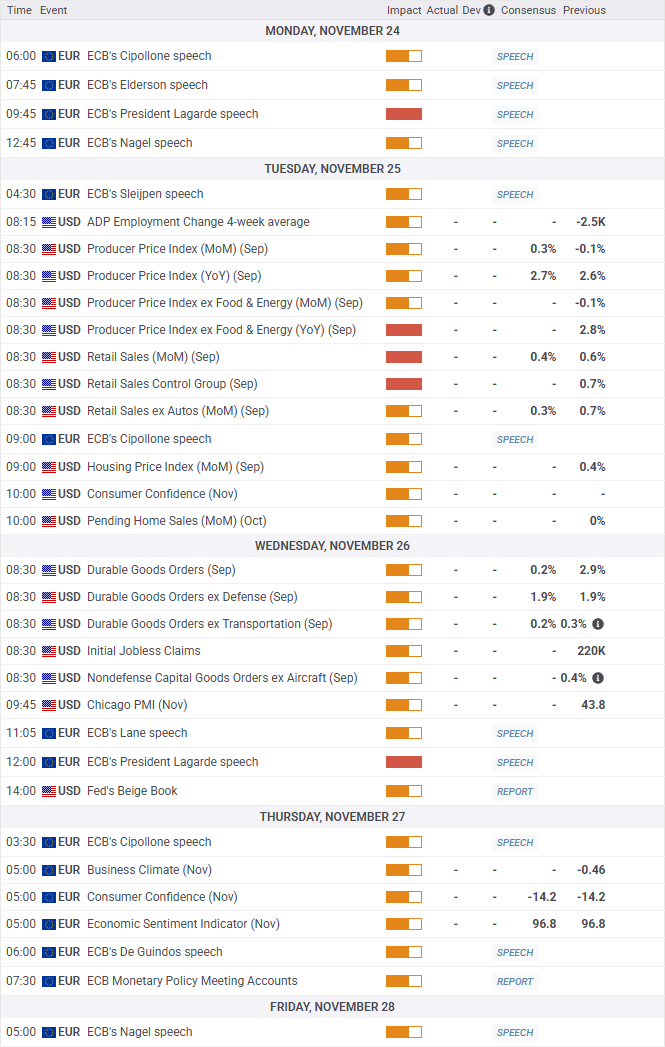
Economic & Earnings Calendar
Central Standard Time
Earnings Whispers

Market Structure
🟥 Daily: OTFD → Ends at: 6677.50
🟥 Weekly: OTFD → Ends at: 6791.25
🟨 Monthly: BALANCE → TBD EOM
Balance: A market condition where price consolidates within a defined range, reflecting indecision as the market awaits more market-generated information. We apply balance guidelines—favoring fade trades at range extremes (highs/lows) and preparing for breakout setups if balance resolves.
One-Time Framing Up (OTFU): A market condition where each subsequent bar forms a higher low, signaling a strong upward trend.
One-Time Framing Down (OTFD): A market condition where each subsequent bar forms a lower high, signaling a strong downward trend.
Contextual Analysis & Plan
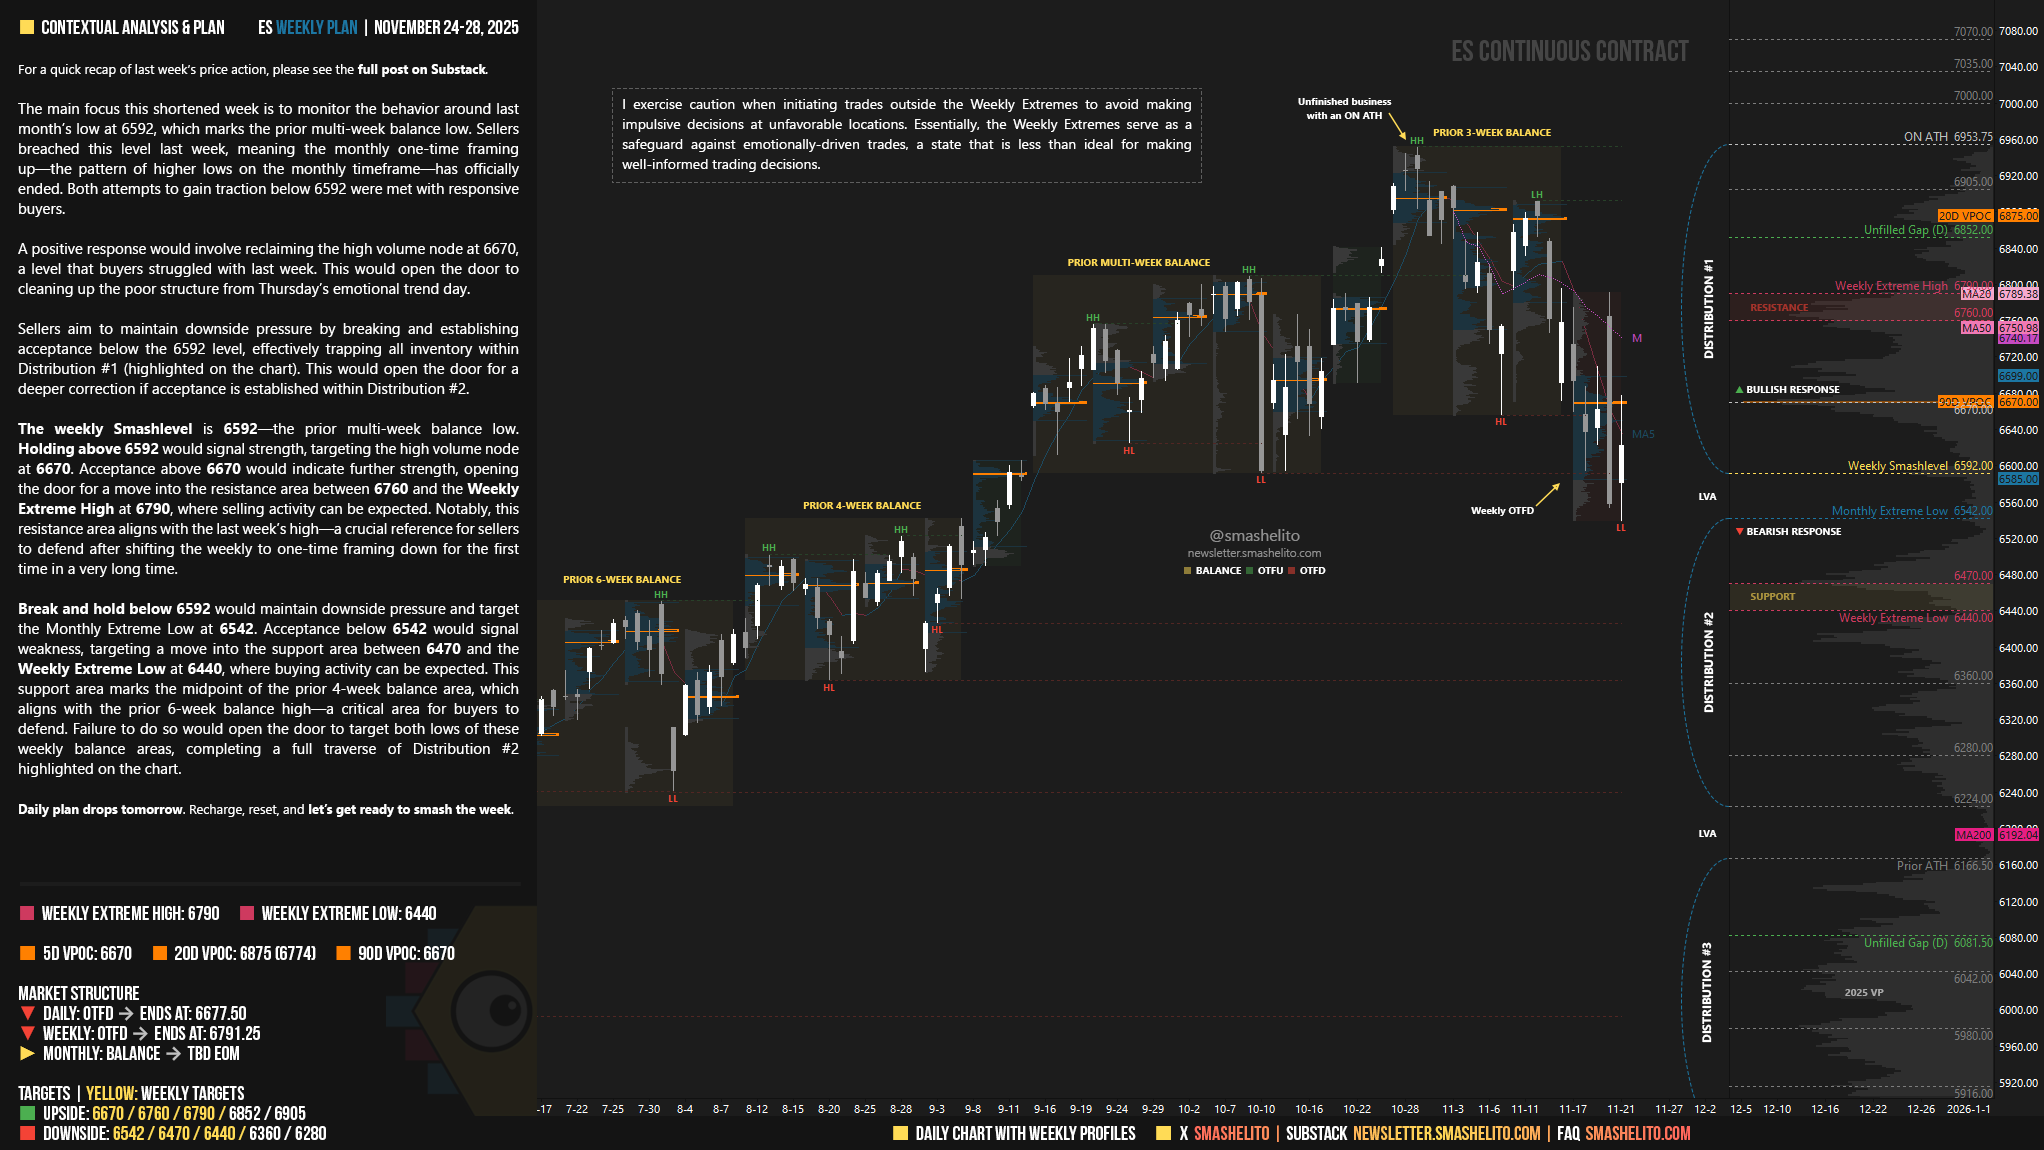
The main focus this shortened week is to monitor the behavior around last month’s low at 6592, which marks the prior multi-week balance low. Sellers breached this level last week, meaning the monthly one-time framing up—the pattern of higher lows on the monthly timeframe—has officially ended. Both attempts to gain traction below 6592 were met with responsive buyers.
A positive response would involve reclaiming the high volume node at 6670, a level that buyers struggled with last week. This would open the door to cleaning up the poor structure from Thursday’s emotional trend day.
Sellers aim to maintain downside pressure by breaking and establishing acceptance below the 6592 level, effectively trapping all inventory within Distribution #1 (highlighted on the chart). This would open the door for a deeper correction if acceptance is established within Distribution #2.
The weekly Smashlevel is 6592—the prior multi-week balance low. Holding above 6592 would signal strength, targeting the high volume node at 6670. Acceptance above 6670 would indicate further strength, opening the door for a move into the resistance area between 6760 and the Weekly Extreme High at 6790, where selling activity can be expected. Notably, this resistance area aligns with the last week’s high—a crucial reference for sellers to defend after shifting the weekly to one-time framing down for the first time in a very long time.
Break and hold below 6592 would maintain downside pressure and target the Monthly Extreme Low at 6542. Acceptance below 6542 would signal weakness, targeting a move into the support area between 6470 and the Weekly Extreme Low at 6440, where buying activity can be expected. This support area marks the midpoint of the prior 4-week balance area, which aligns with the prior 6-week balance high—a critical area for buyers to defend. Failure to do so would open the door to target both lows of these weekly balance areas, completing a full traverse of Distribution #2 highlighted on the chart.
Key Levels of Interest
In the upcoming week, I will closely observe the behavior around 6592.
Holding above 6592 would target 6670 / 6760 / 6790* / 6852 / 6905
Break and hold below 6592 would target 6542 / 6470 / 6440* / 6360 / 6280
*Weekly Extremes. I exercise caution when initiating trades outside the Weekly Extremes to avoid making impulsive decisions at unfavorable locations. Essentially, the Weekly Extremes serve as a safeguard against emotionally-driven trades, a state that is less than ideal for making well-informed trading decisions.
Daily plan drops tomorrow. Recharge, reset, and let’s get ready to smash the week.
Thank you Samsh. Truly appreciate all of your hard work which you put into this.
Thank you Smash!