
ES Weekly Plan | November 10-14, 2025
Recap, Market Context & Key Levels for the Week Ahead

Welcome to this week’s plan. Inside, you’ll find a quick review of last week’s price action, key economic events, market structure, context for the week ahead, and the levels I’ll be focusing on. Let’s get prepared.
Contents
Last Week in Review & Bonus Chart
Economic & Earnings Calendar
Market Structure
Contextual Analysis & Plan
Key Levels of Interest
Last Week in Review & Bonus Chart
Last week’s plan:

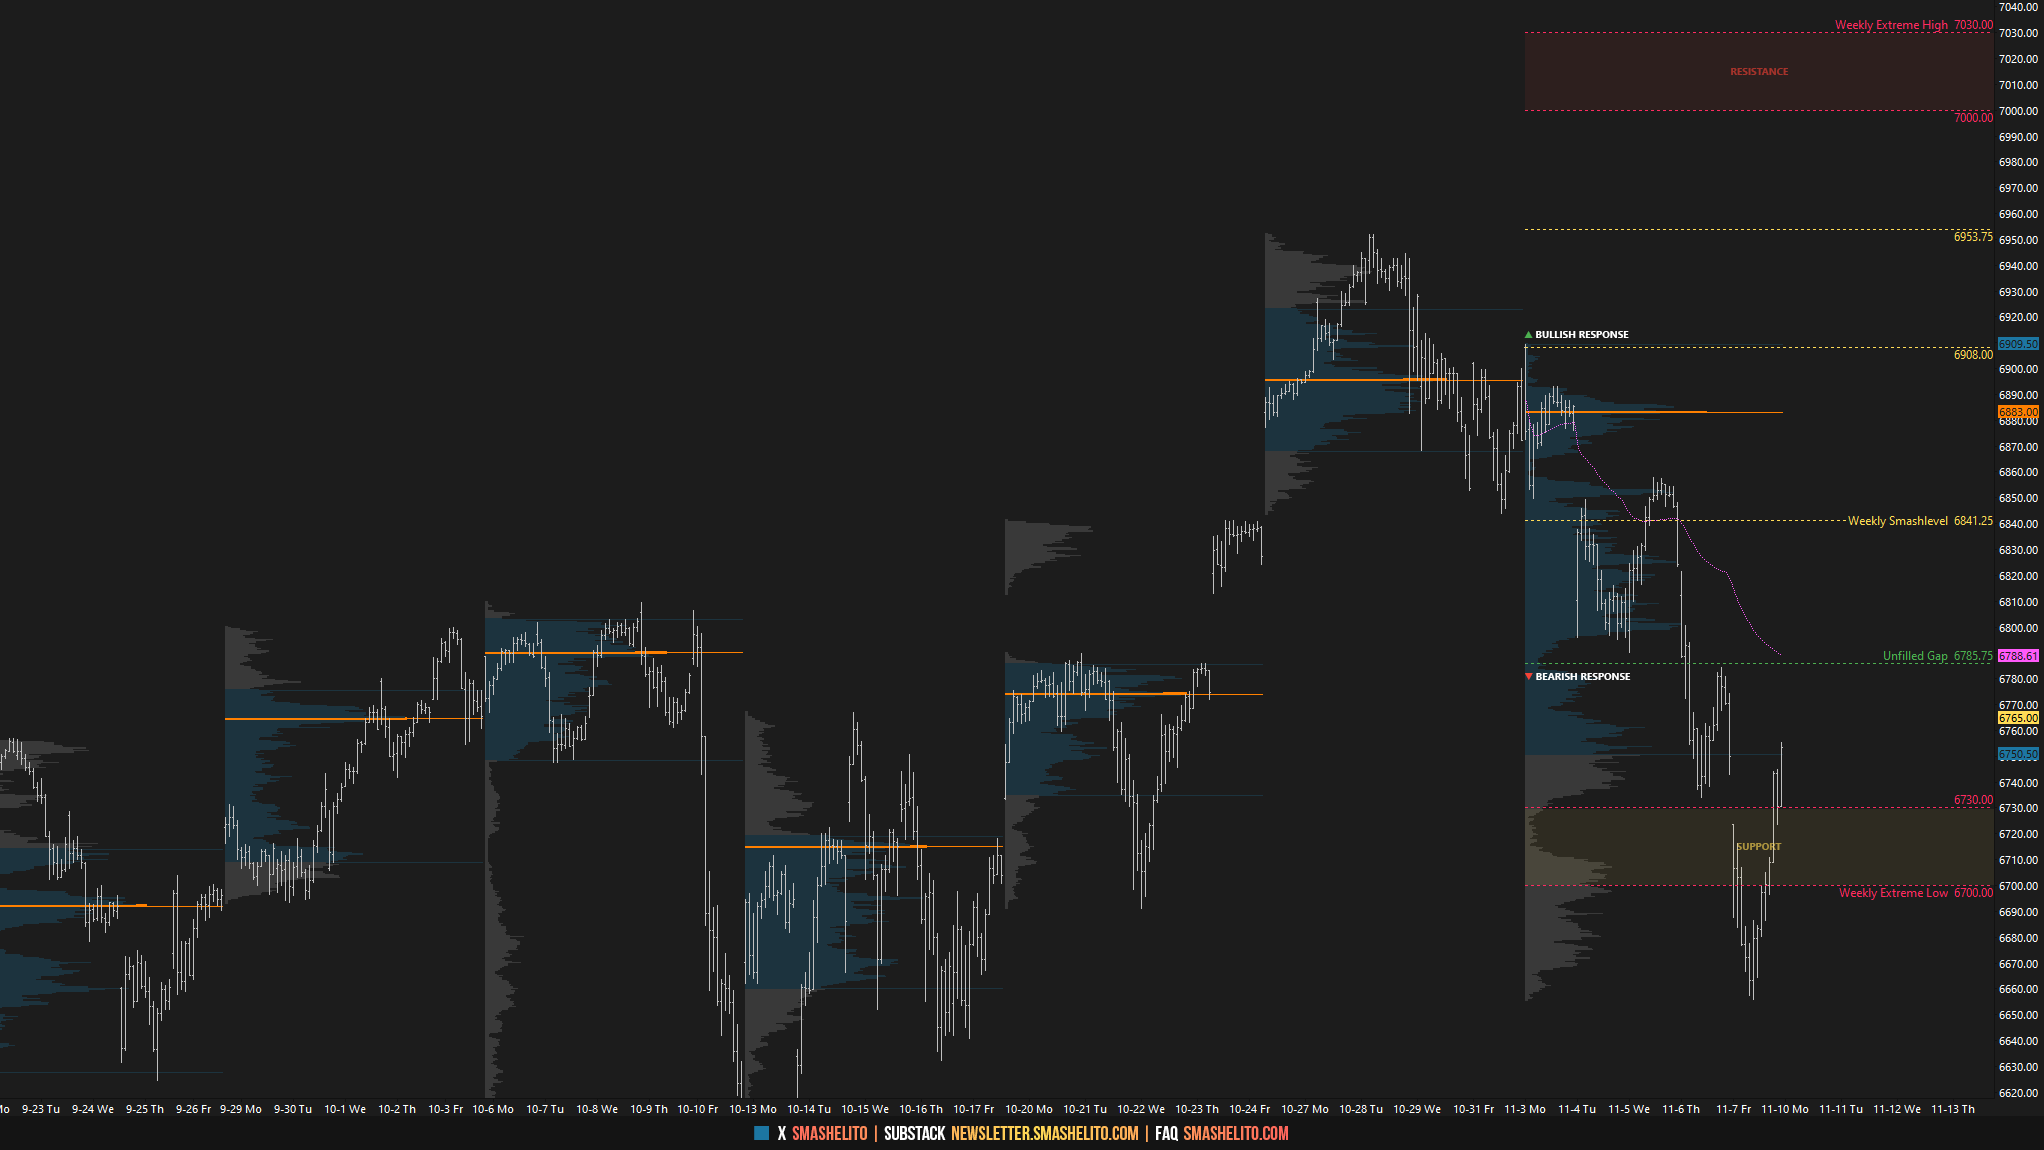
Heading into this week, the main focus was on where the market would build value relative to the two key distributions, #1 and #2—the former marking the previous week’s range, and the latter representing the prior multi-week balance area. Immediate attention was on the unfilled gap at 6841.25.
The primary objective was to monitor whether value would continue to develop within distribution #1—signaling ongoing acceptance of the multi-week balance breakout—or whether sellers could force a return into distribution #2, which would imply a potential failed breakout. Continued acceptance within distribution #1 favored upside continuation toward the unfinished business at the overnight all-time high of 6953.75, while meaningful acceptance back inside the prior multi-week balance area, requiring both gaps to be filled, would have marked a notable shift in tone—a scenario that ultimately played out.
Monday kicked off the week with buyers breaking the pattern of lower highs on the daily, bringing the daily into a 3-day balance. It was an overall balanced session, holding within UT1 and DT1.
Monday’s Auction
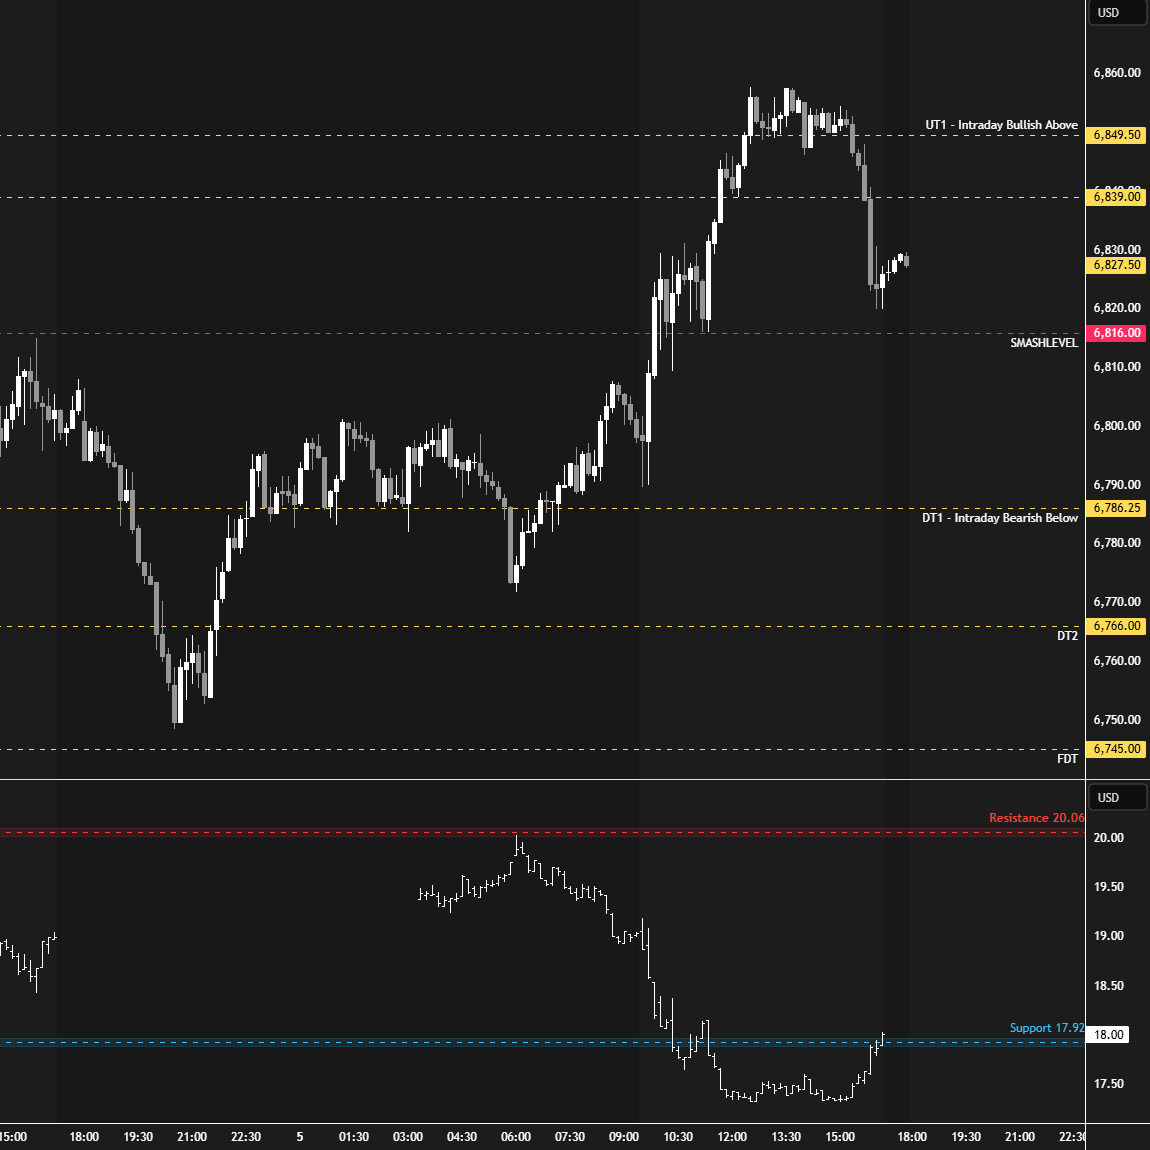
Change took place on Tuesday as sellers initiated a 3-day balance breakdown, filling the weekly gap at 6841.25 and partially filling the daily gap from two weeks ago at 6785.75. This second gap was significant, as filling it and finding acceptance below it—meaning acceptance back within the prior multi-week balance area—would be a bearish development that opens the door for further downside pressure (see Figure 1). Buyers needed to reclaim the 3-day balance area to negate this potential for change.
Tuesday’s Auction
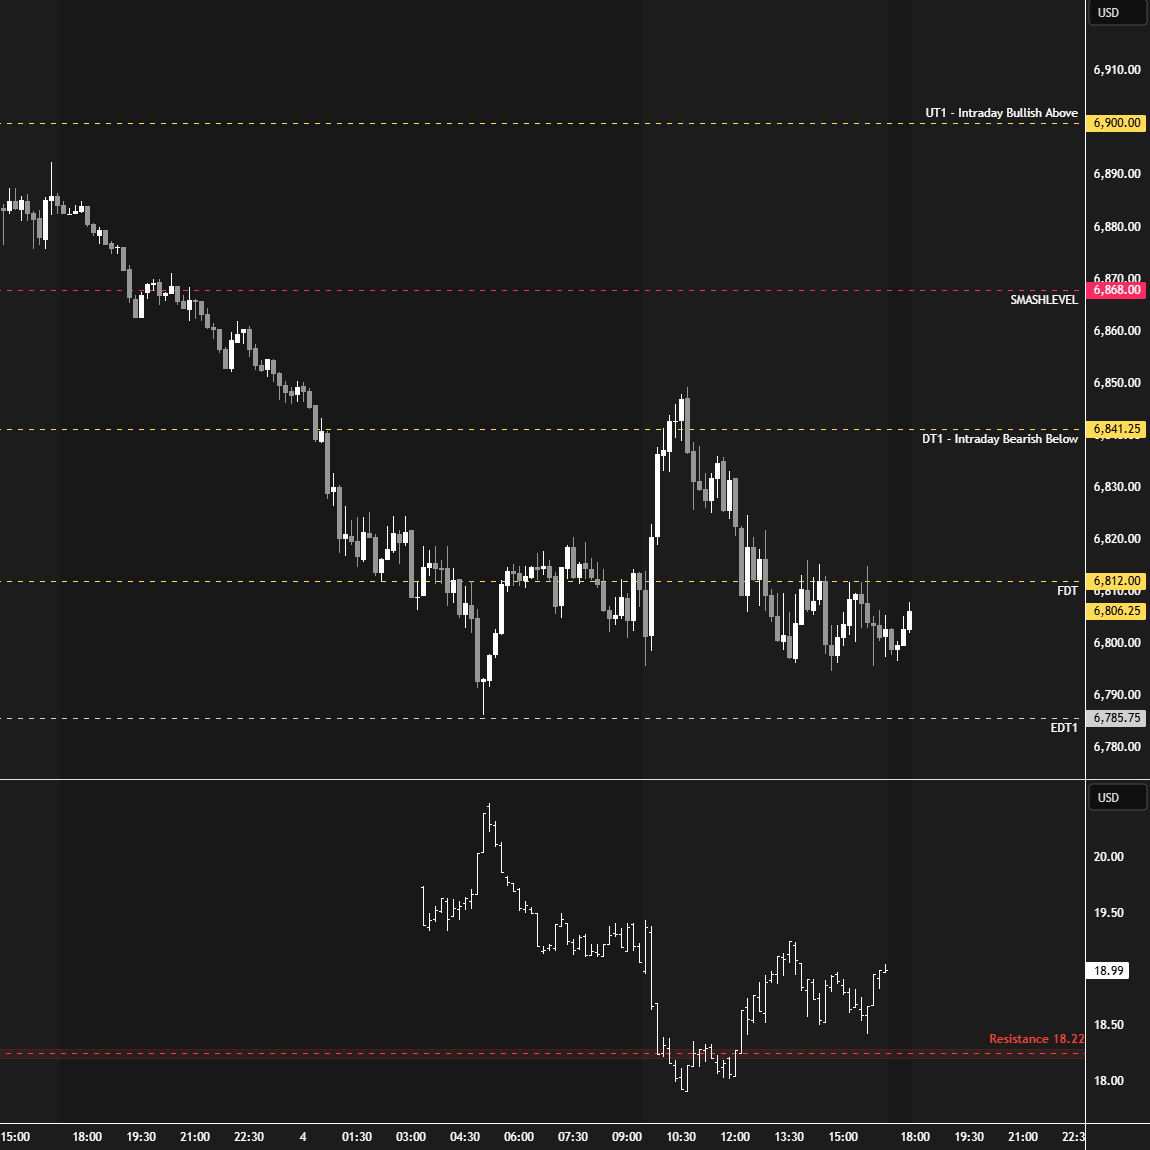
On Wednesday, sellers attempted to fill the second gap at 6785.75—an attempt that ultimately failed after being met by responsive buyers. This, in turn, triggered a short-covering rally. Buyers made a solid attempt to regain acceptance back within the 3-day balance area; however, a closing liquidation unfolded after forming a poor high. This essentially meant that once shorts had covered, new buying interest was absent. The daily formed a 2-day balance.
Wednesday’s Auction
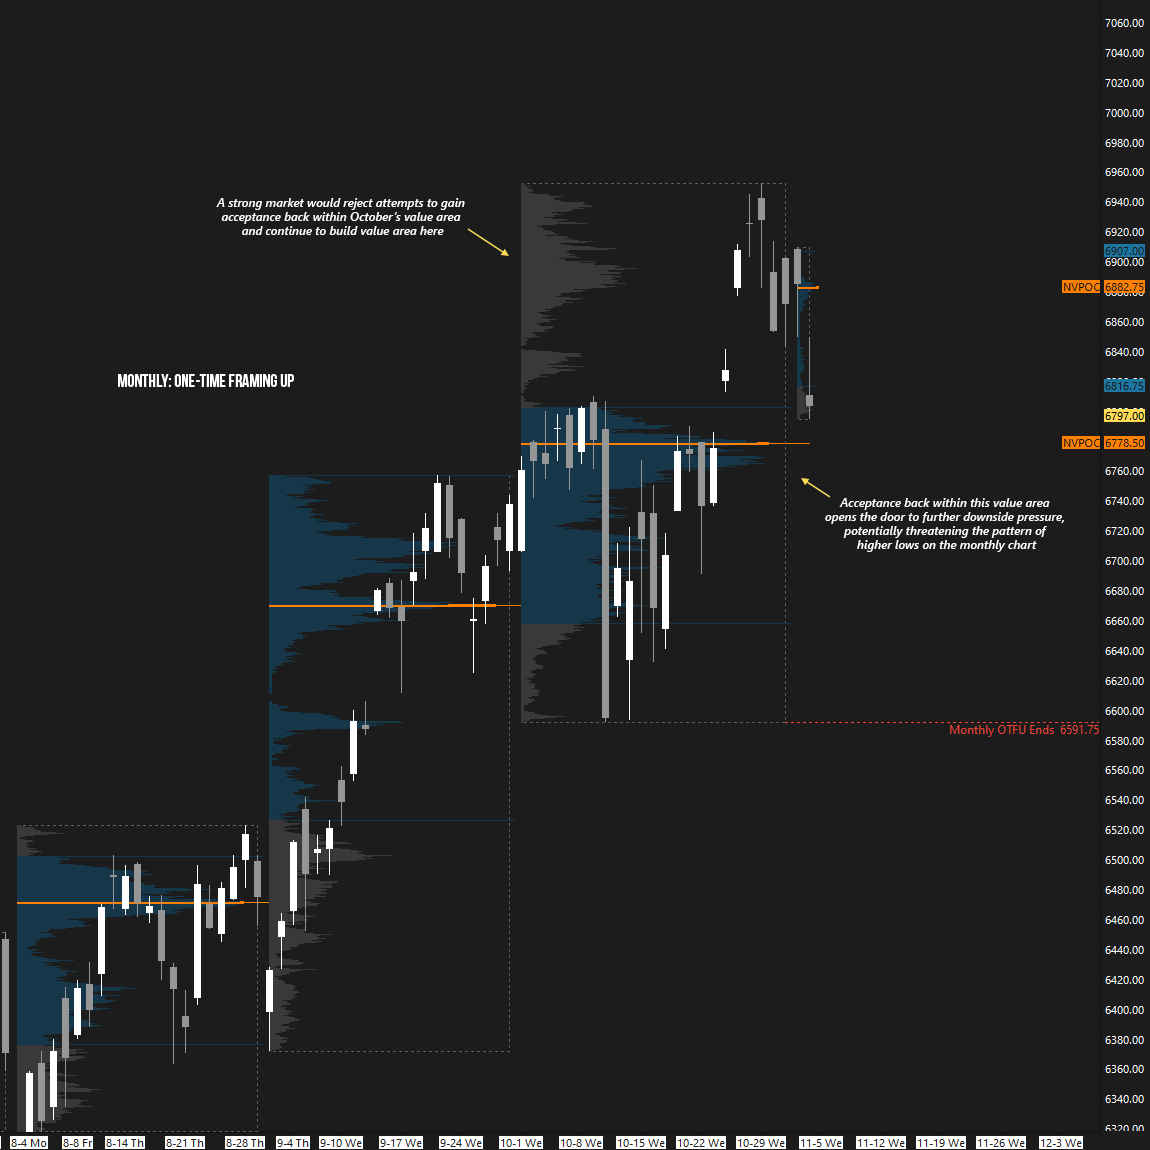
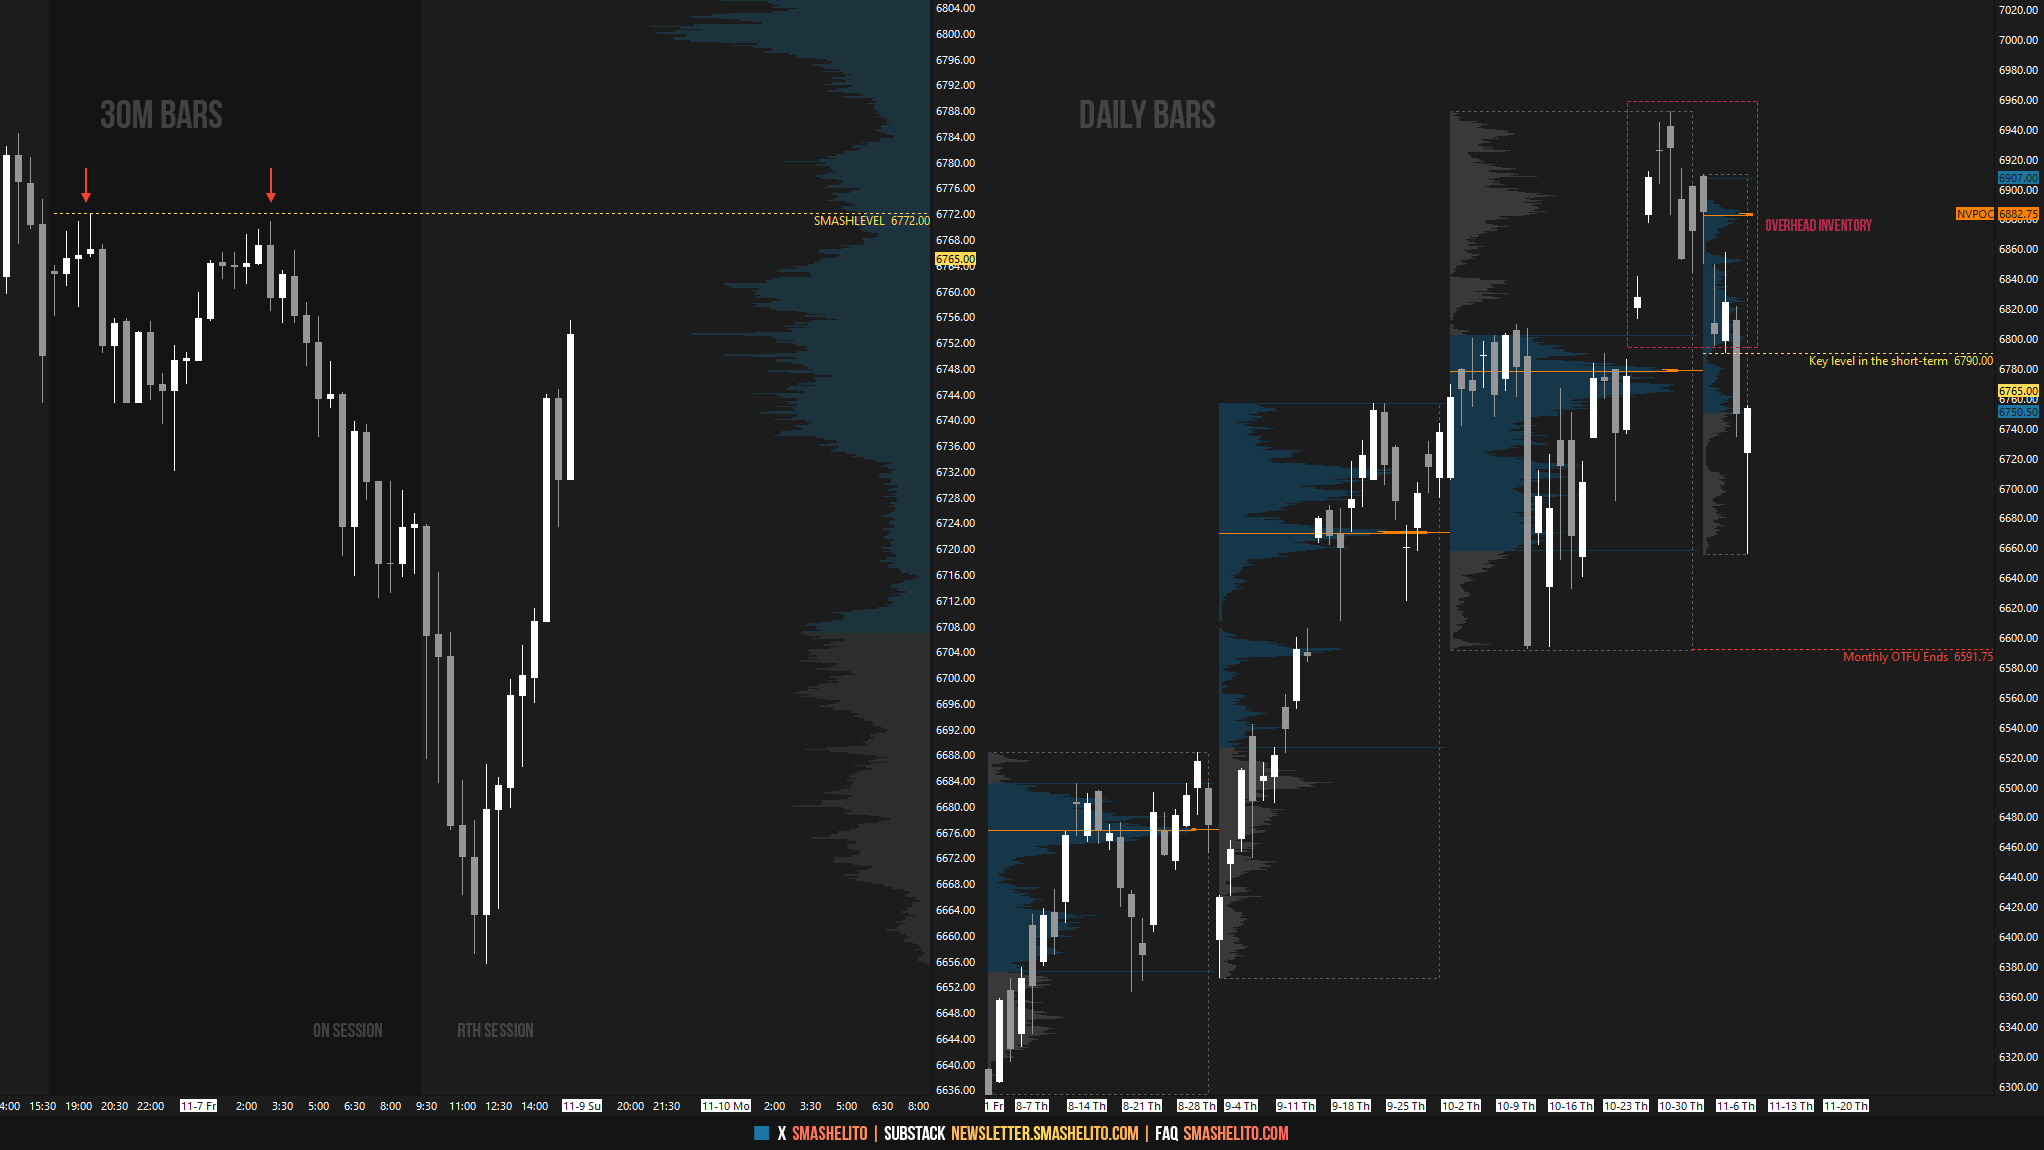
Wednesday’s failure to negate short-term weakness led to downside continuation on Thursday, as sellers initiated another daily balance breakdown, filling the 6785.75 gap and closing the session below this reference. Having filled both gaps, ended the weekly one-time framing up, and closed back within October’s value area, sellers had opened the door to a shift in tone.
Thursday’s Auction
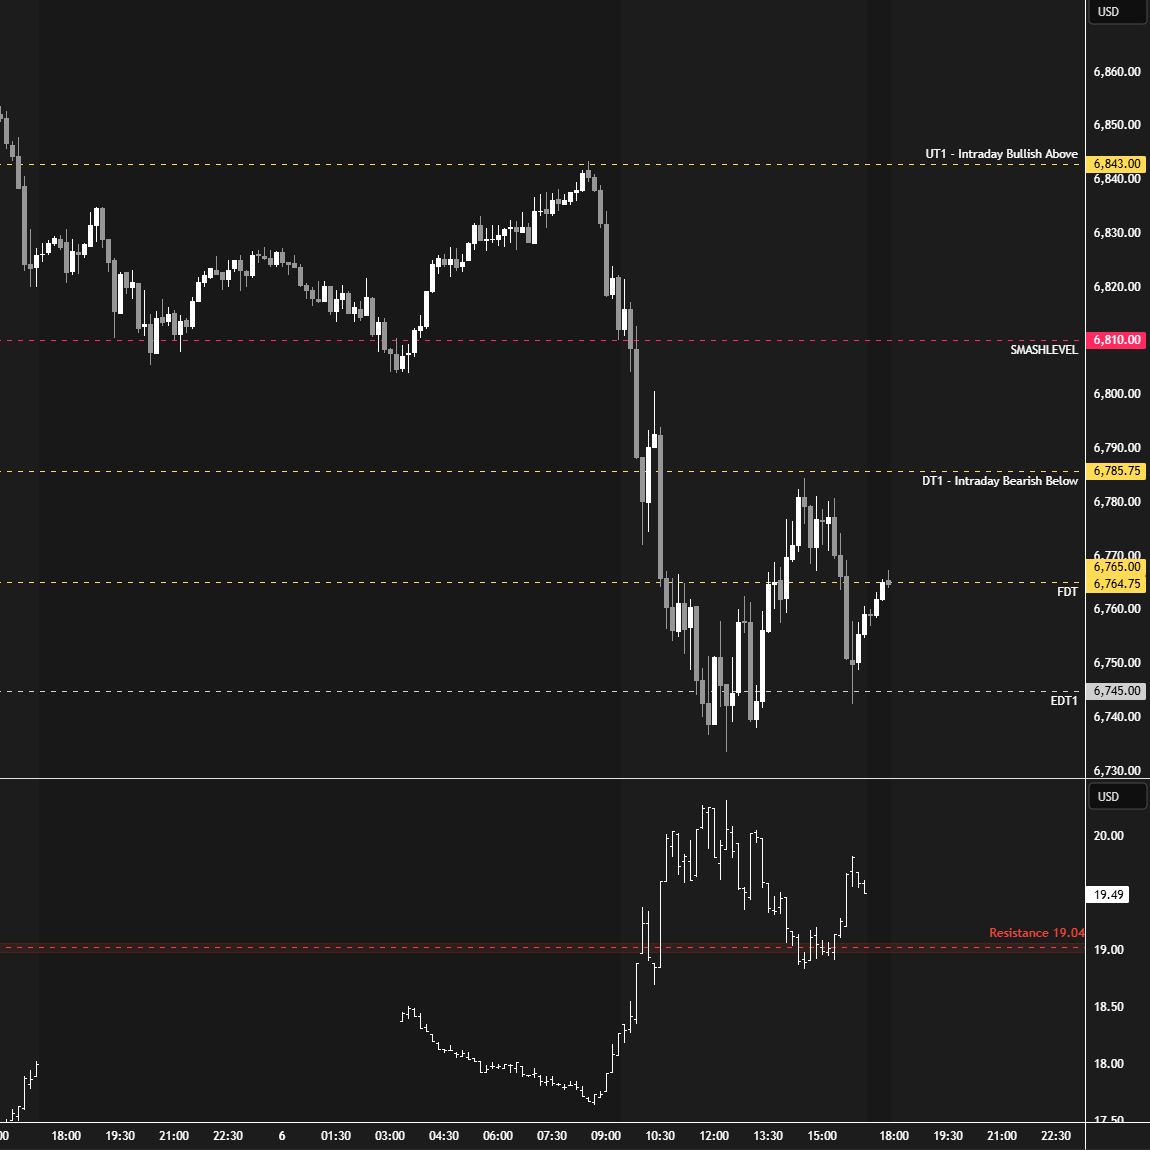
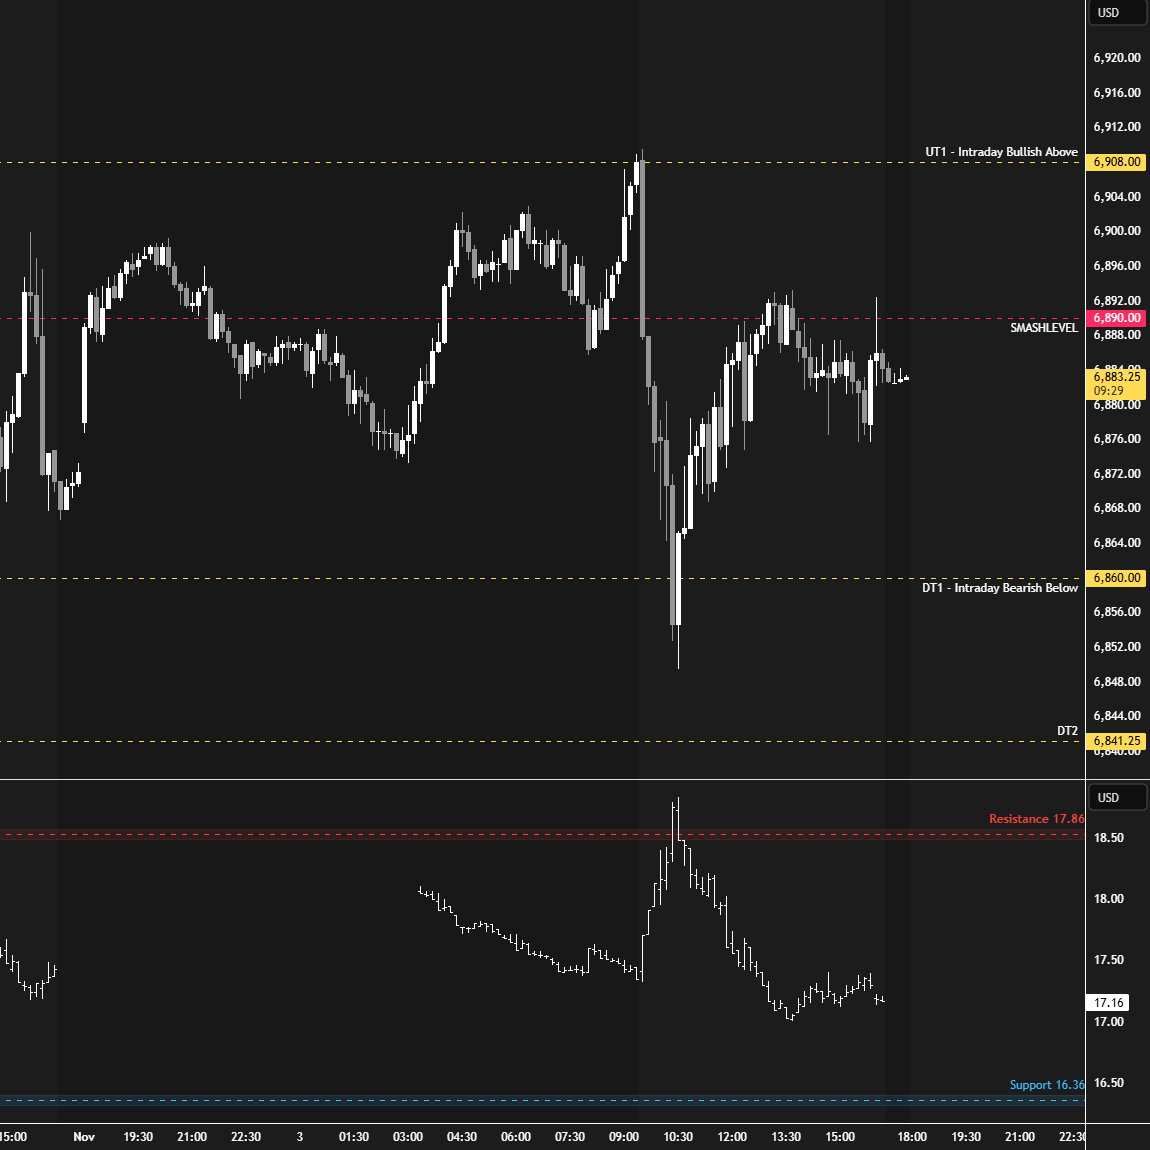
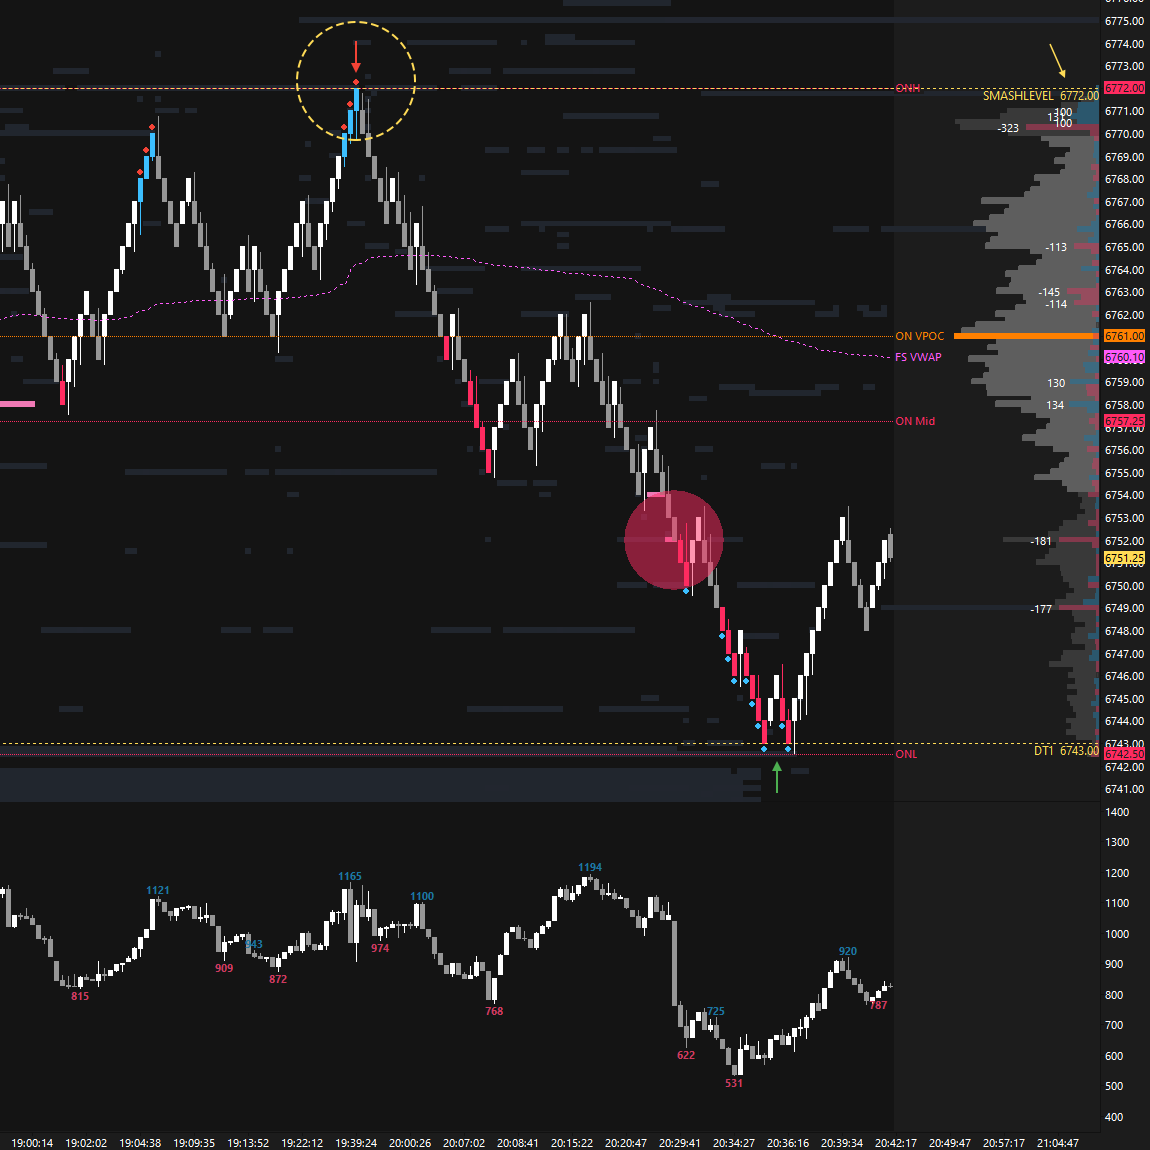
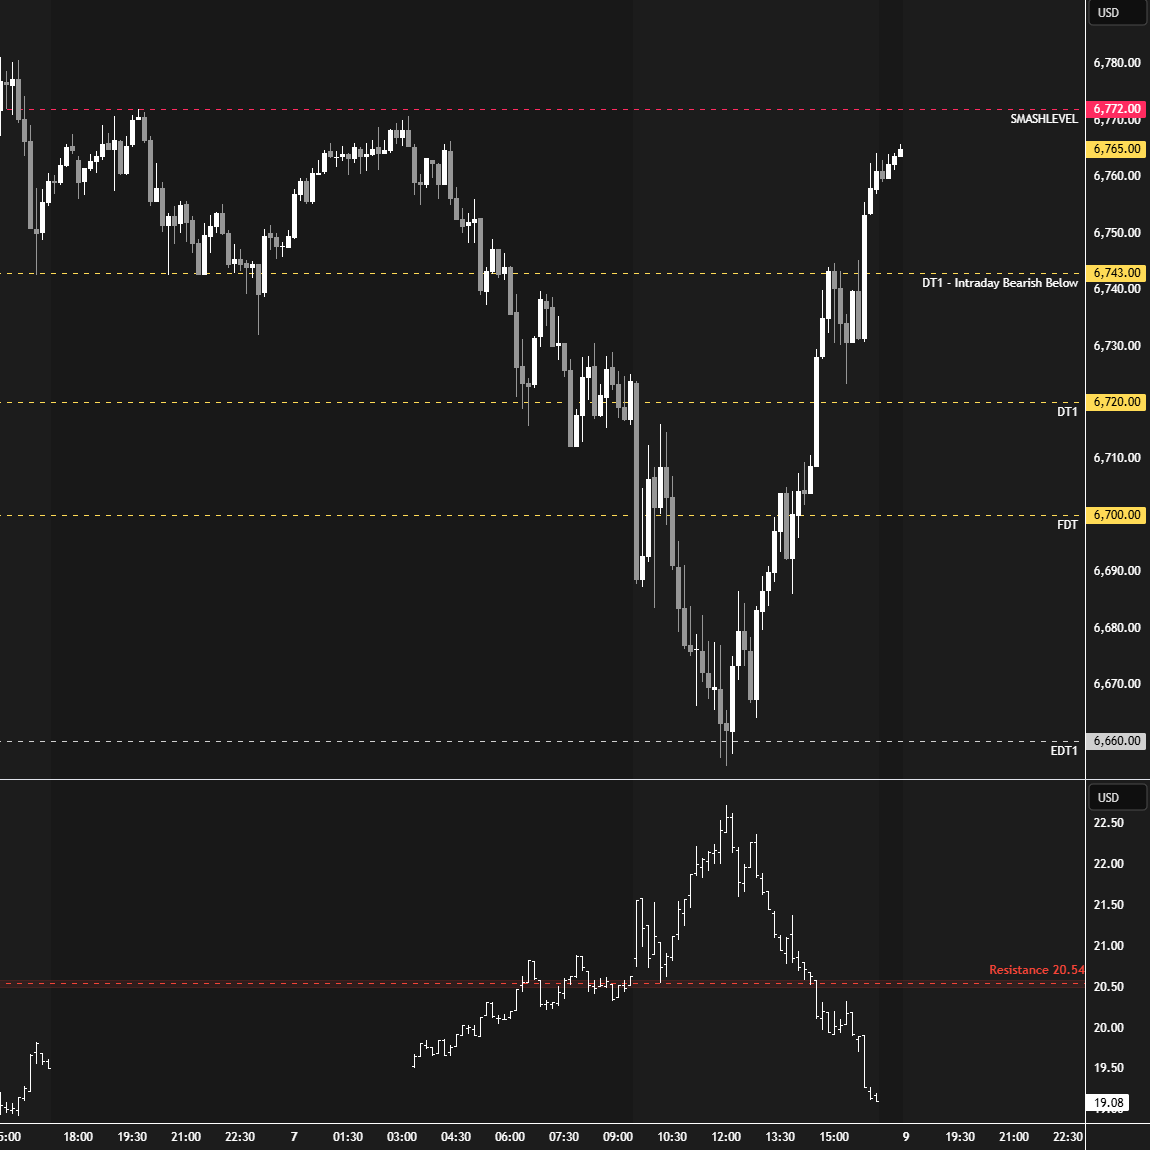
On Friday, the Smashlevel was 6772, tagged to the tick during the overnight session and met by selling activity (see Figure 2). The pressure to the downside remained intact. In the process, the market completed a full traverse of October’s value area, tagging its VAL at 6660. This is a classic setup: when price accepts into a prior value area, it often tests the opposite extreme. We closed out the week with a vicious short-covering rally from 6660; however, the daily remains in one-time framing down mode, and price stays within October’s value area, suggesting the presence of overhead inventory (see Figure 3). The Weekly Extreme Low at 6700 was breached; however, the week closed back above it, highlighting how it’s generally tricky to chase moves outside the weekly extremes.
Friday’s Auction
Price Action vs. Weekly Levels
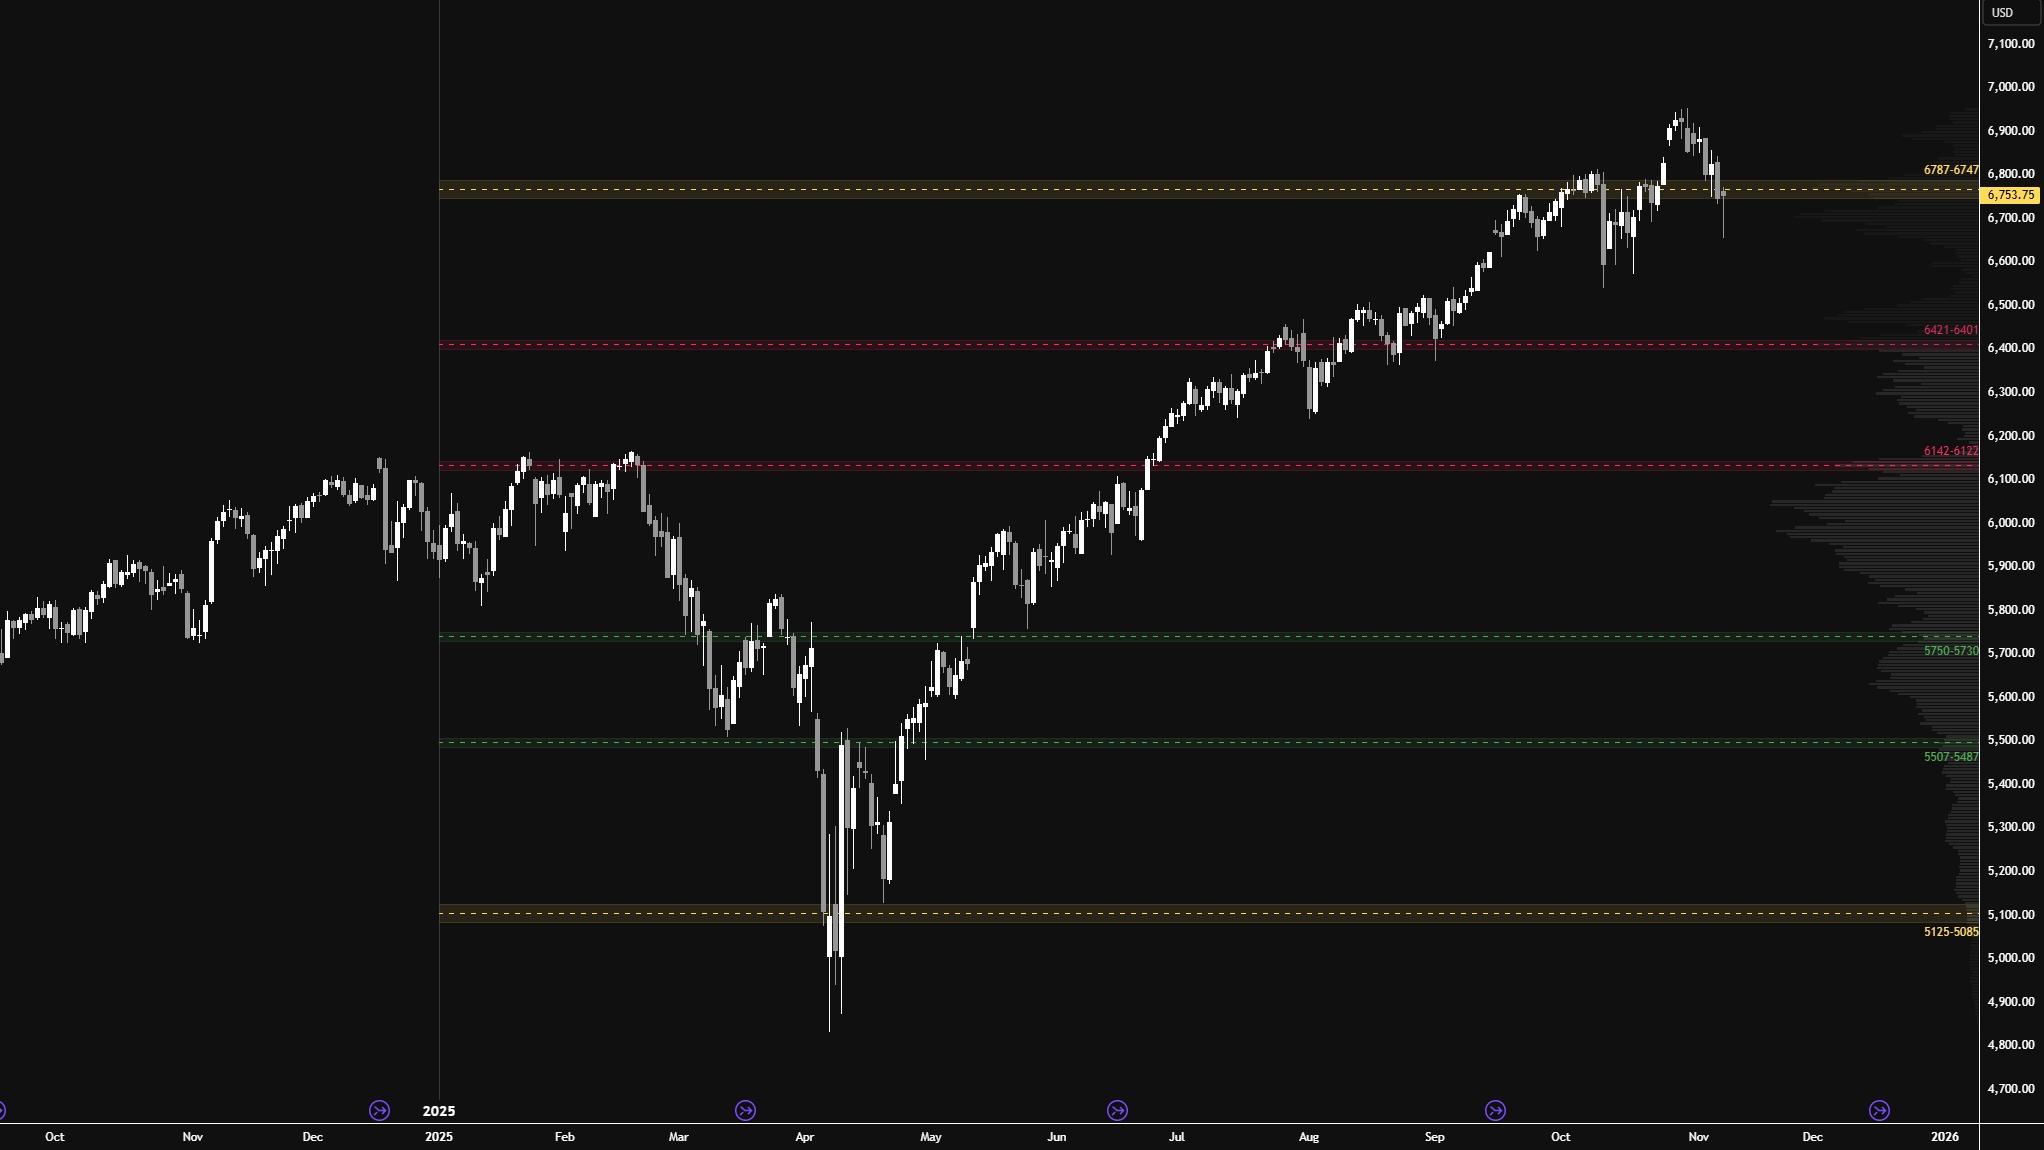
I will continue to include the HTF chart from a good friend of mine, featuring levels generated by one of his models at the start of 2025. As you can see, this year’s price action has respected these levels remarkably well.
As discussed last week, the door to weakness would only open with acceptance back below the 6747–6787 area of interest, and Friday’s session closed right in this area following the afternoon squeeze. This is clearly a short-term inflection point, and its alignment with the prior multi-week balance high adds another layer of significance.
Failing to quickly reclaim this area would maintain downside pressure, potentially opening the door to another leg lower.
Higher Time Frame Levels
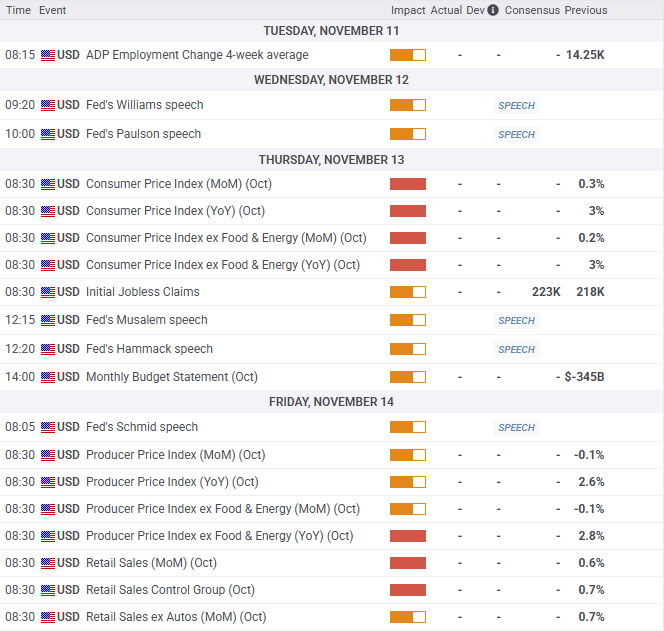
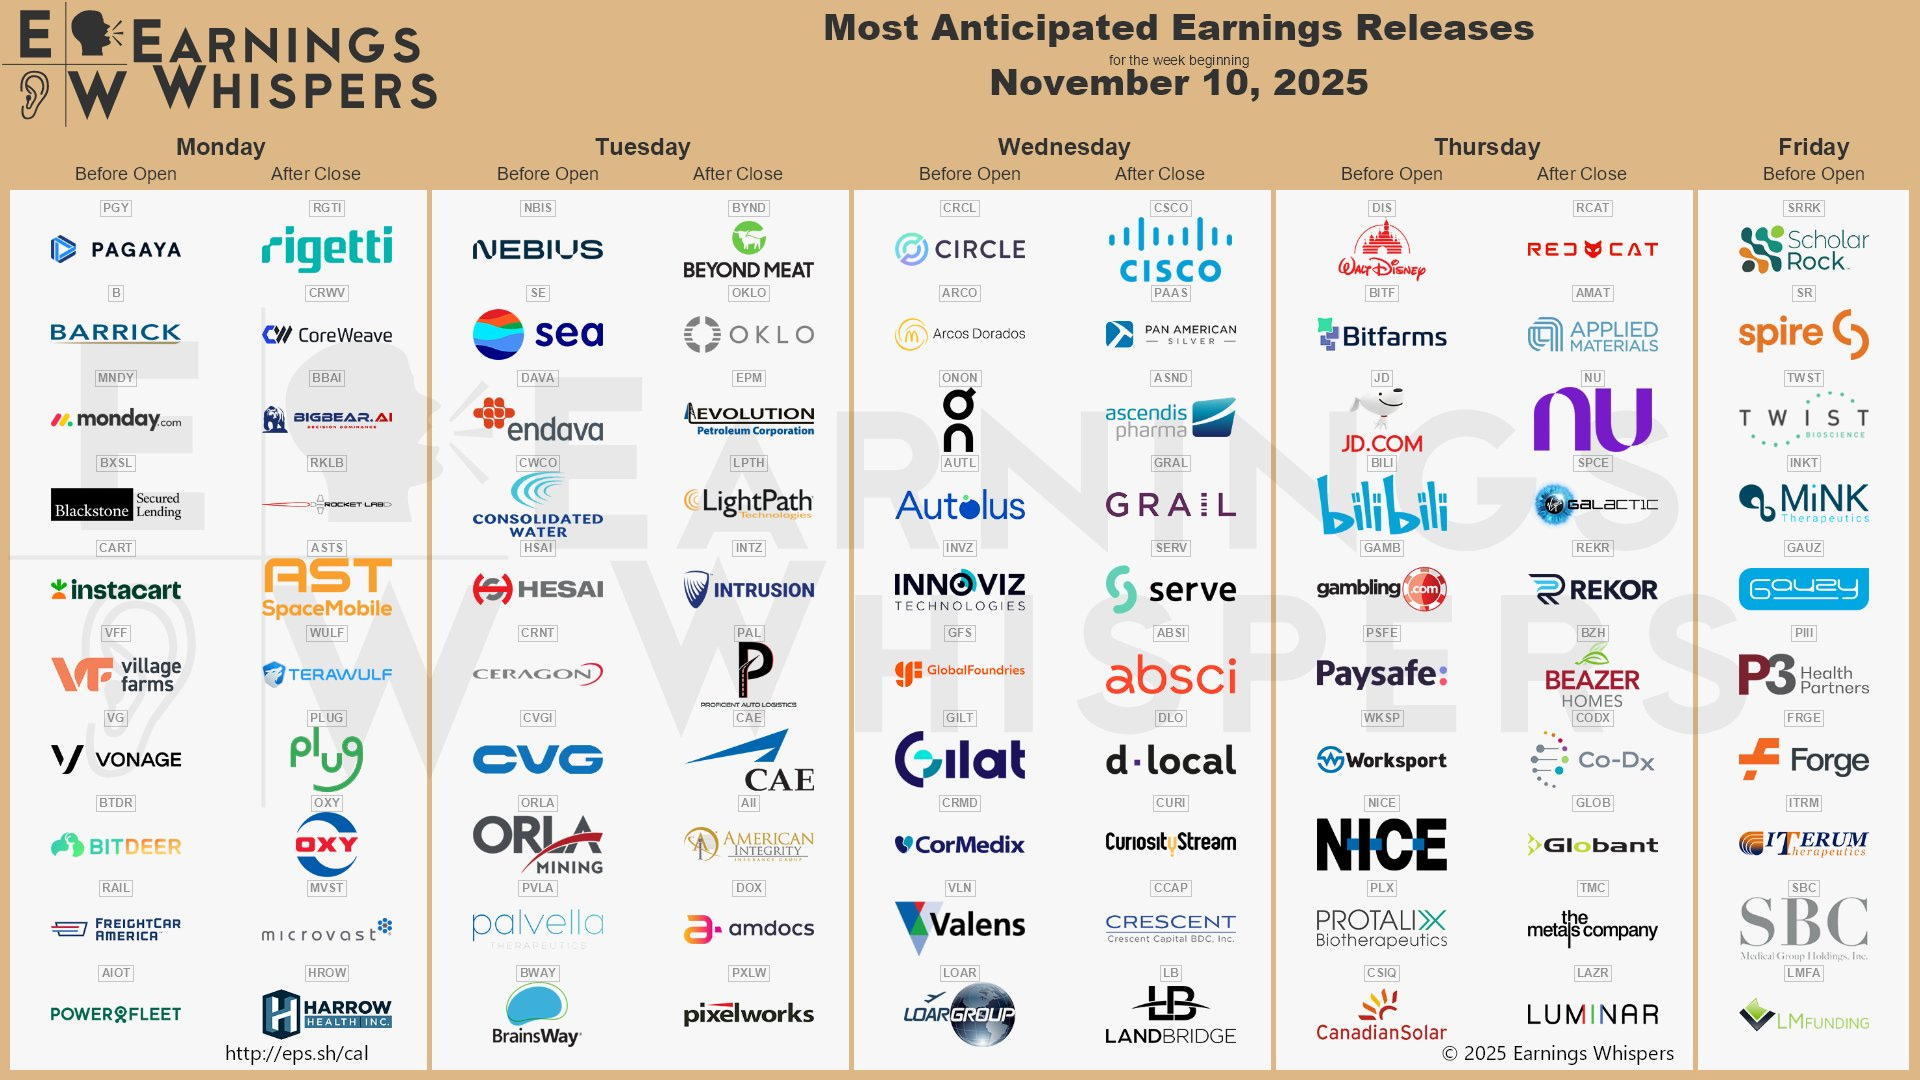
Economic & Earnings Calendar
Market Structure
🟥 Daily: OTFD → Ends at: 6755.50
🟨 Weekly: BALANCE → 2-Week → High: 6952 / Low: 6655.50
🟩 Monthly: OTFU → Ends at: 6591.75
Balance: A market condition where price consolidates within a defined range, reflecting indecision as the market awaits more market-generated information. We apply balance guidelines—favoring fade trades at range extremes (highs/lows) and preparing for breakout setups if balance resolves.
One-Time Framing Up (OTFU): A market condition where each subsequent bar forms a higher low, signaling a strong upward trend.
One-Time Framing Down (OTFD): A market condition where each subsequent bar forms a lower high, signaling a strong downward trend.
Contextual Analysis & Plan
The main focus this week is whether sellers can sustain downside pressure following last week’s achievements: filling both recent gaps, ending the pattern of higher lows on the weekly timeframe, and closing back within the prior multi-week balance area—shifting the tone in the market. Immediate attention is on the 6790 area—a key reference with multiple confluences.
A weak market will remain within the prior multi-week balance area, keeping the overhead inventory trapped and favoring a test of the opposite side of the balance—a must hold area for buyers. Sellers’ next objective is to end the pattern of higher lows on the monthly timeframe (6591.75).
Failure to do so—meaning acceptance back above the 6790 level—would be a sign of strength, effectively negating the weakness seen on Thursday and Friday. This would set the stage to revisit the all-time high, where we have unfinished business.
The weekly Smashlevel is 6790—a key reference with multiple confluences (see chart). Break and hold above 6790 would signal strength, targeting 6843—the level that ended the weekly OTFU. Acceptance above 6843 would indicate further strength, opening the door for a move into the resistance area between 6905 and the Weekly Extreme High at 6935, where selling activity can be expected. Notably, this resistance area aligns with the value area highs from both last week and the prior week, highlighting its significance. Additionally, unfinished business remains at the all-time highs.
Holding below 6790 would maintain downside pressure and target Friday’s IB high at 6724. Acceptance below 6724 would signal weakness, targeting the HVN at 6670, as well as a move into the support area between 6610 and the Weekly Extreme Low at 6580, where buying activity can be expected. This support area marks the lower end of the prior multi-week balance—a critical level for buyers to defend, as failure would trap a significant amount of long positions above. Additionally, a break of 6591.75 would end the monthly one-time framing up, representing a notable achievement for sellers.
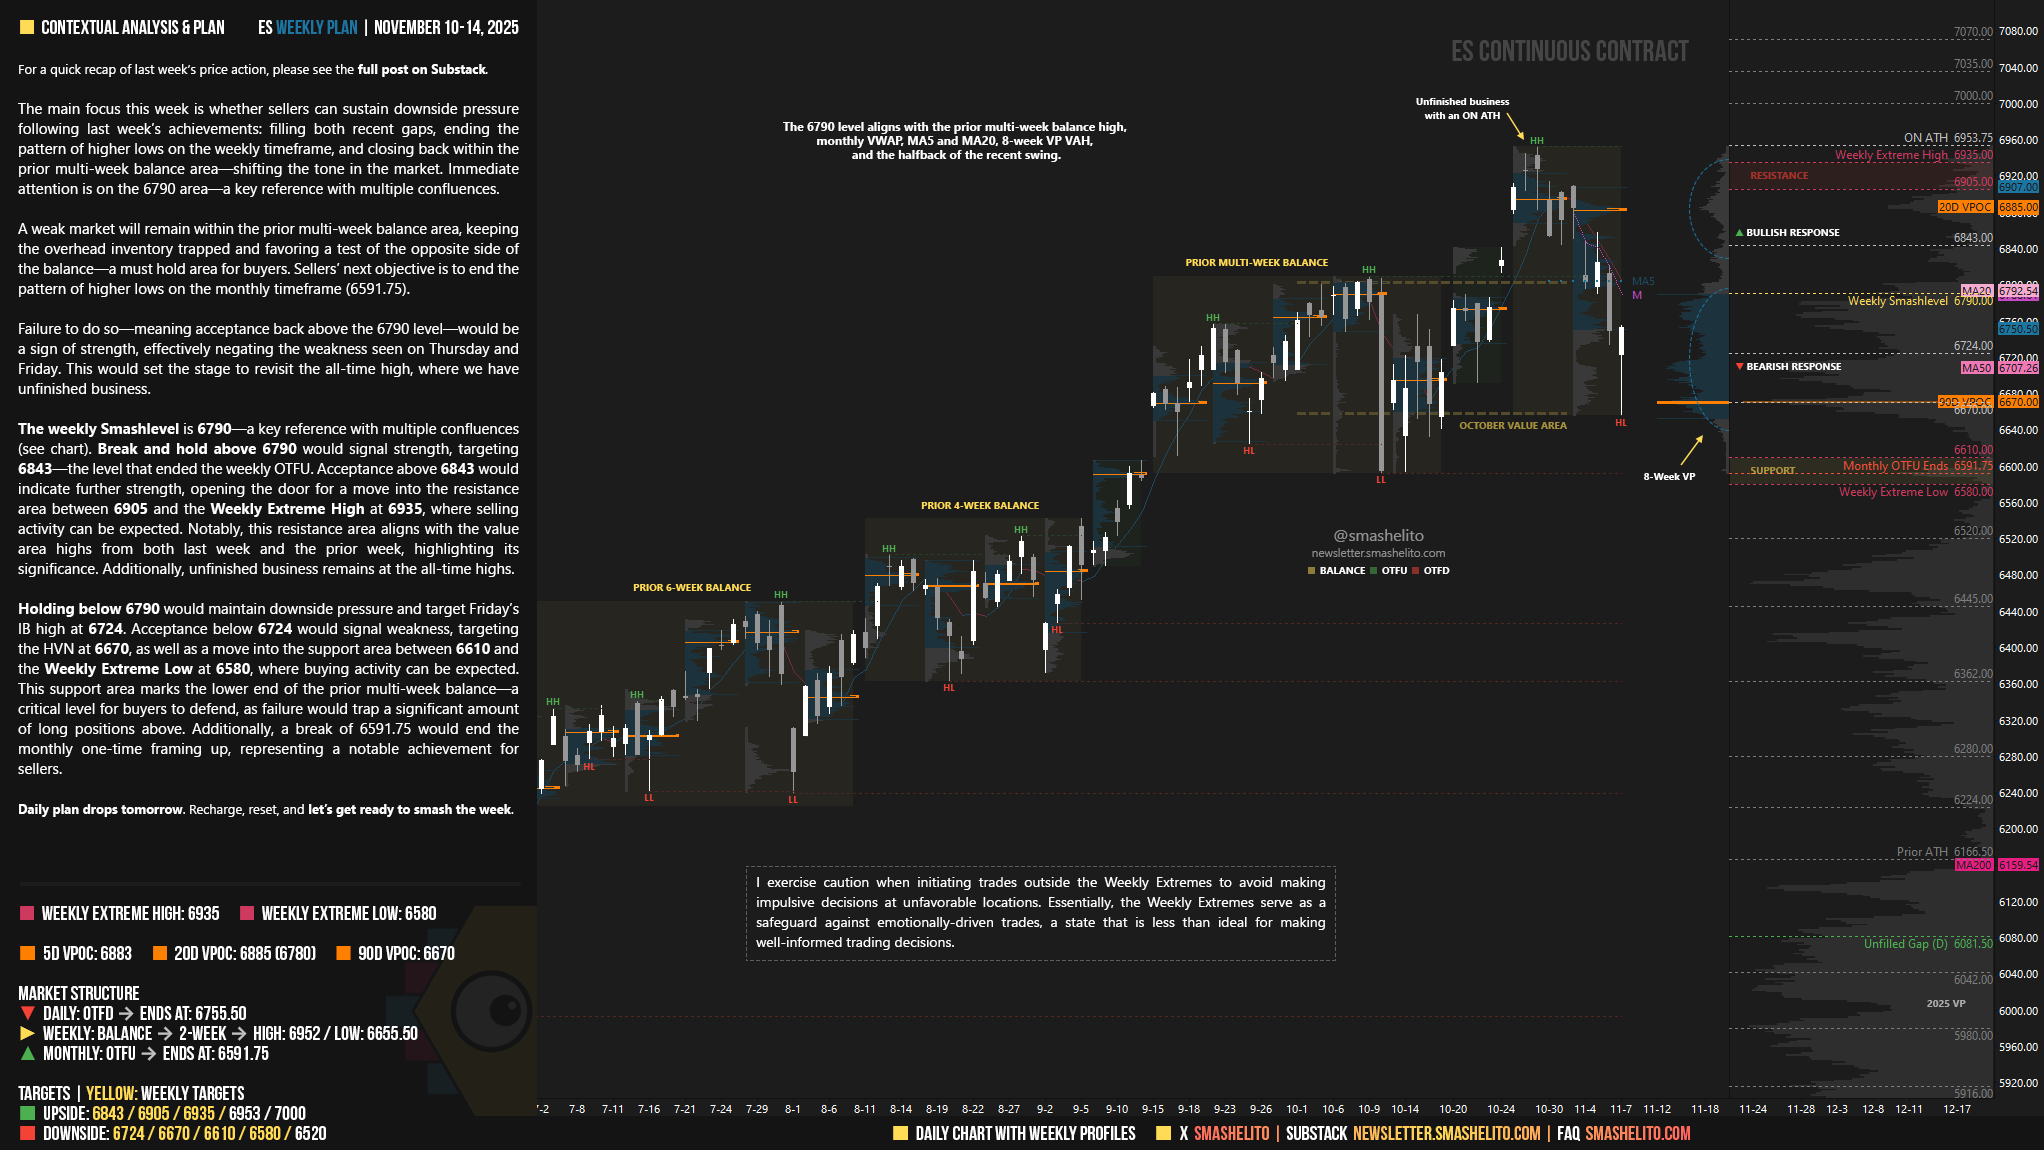
Key Levels of Interest
In the upcoming week, I will closely observe the behavior around 6790.
Break and hold above 6790 would target 6843 / 6905 / 6935* / 6953 / 7000
Holding below 6790 would target 6724 / 6670 / 6610 / 6580* / 6520
*Weekly Extremes. I exercise caution when initiating trades outside the Weekly Extremes to avoid making impulsive decisions at unfavorable locations. Essentially, the Weekly Extremes serve as a safeguard against emotionally-driven trades, a state that is less than ideal for making well-informed trading decisions.
Daily plan drops tomorrow. Recharge, reset, and let’s get ready to smash the week.
Excellent
Thank you
We've started the week and it's already clear how important 6790 is. It's going to be a great and very interesting week. I wish you all the best. Thank you for everything you do; you've been a great mentor these past 4-5 months that I've been following your every move. I really appreciate it!