
ES Weekly Plan | May 4-8, 2026
Recap, Market Context & Key Levels for the Week Ahead

Welcome to this week’s plan. Inside, you’ll find a quick review of last week’s price action, key economic events, market structure, context for the week ahead, and the levels I’ll be focusing on. Let’s get prepared.
Contents
Last Week in Review
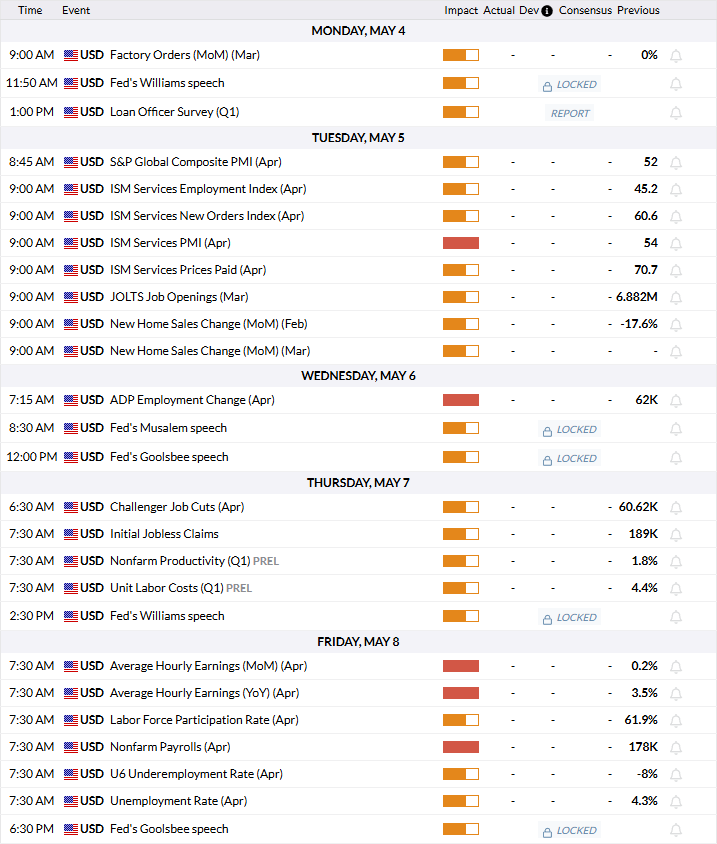
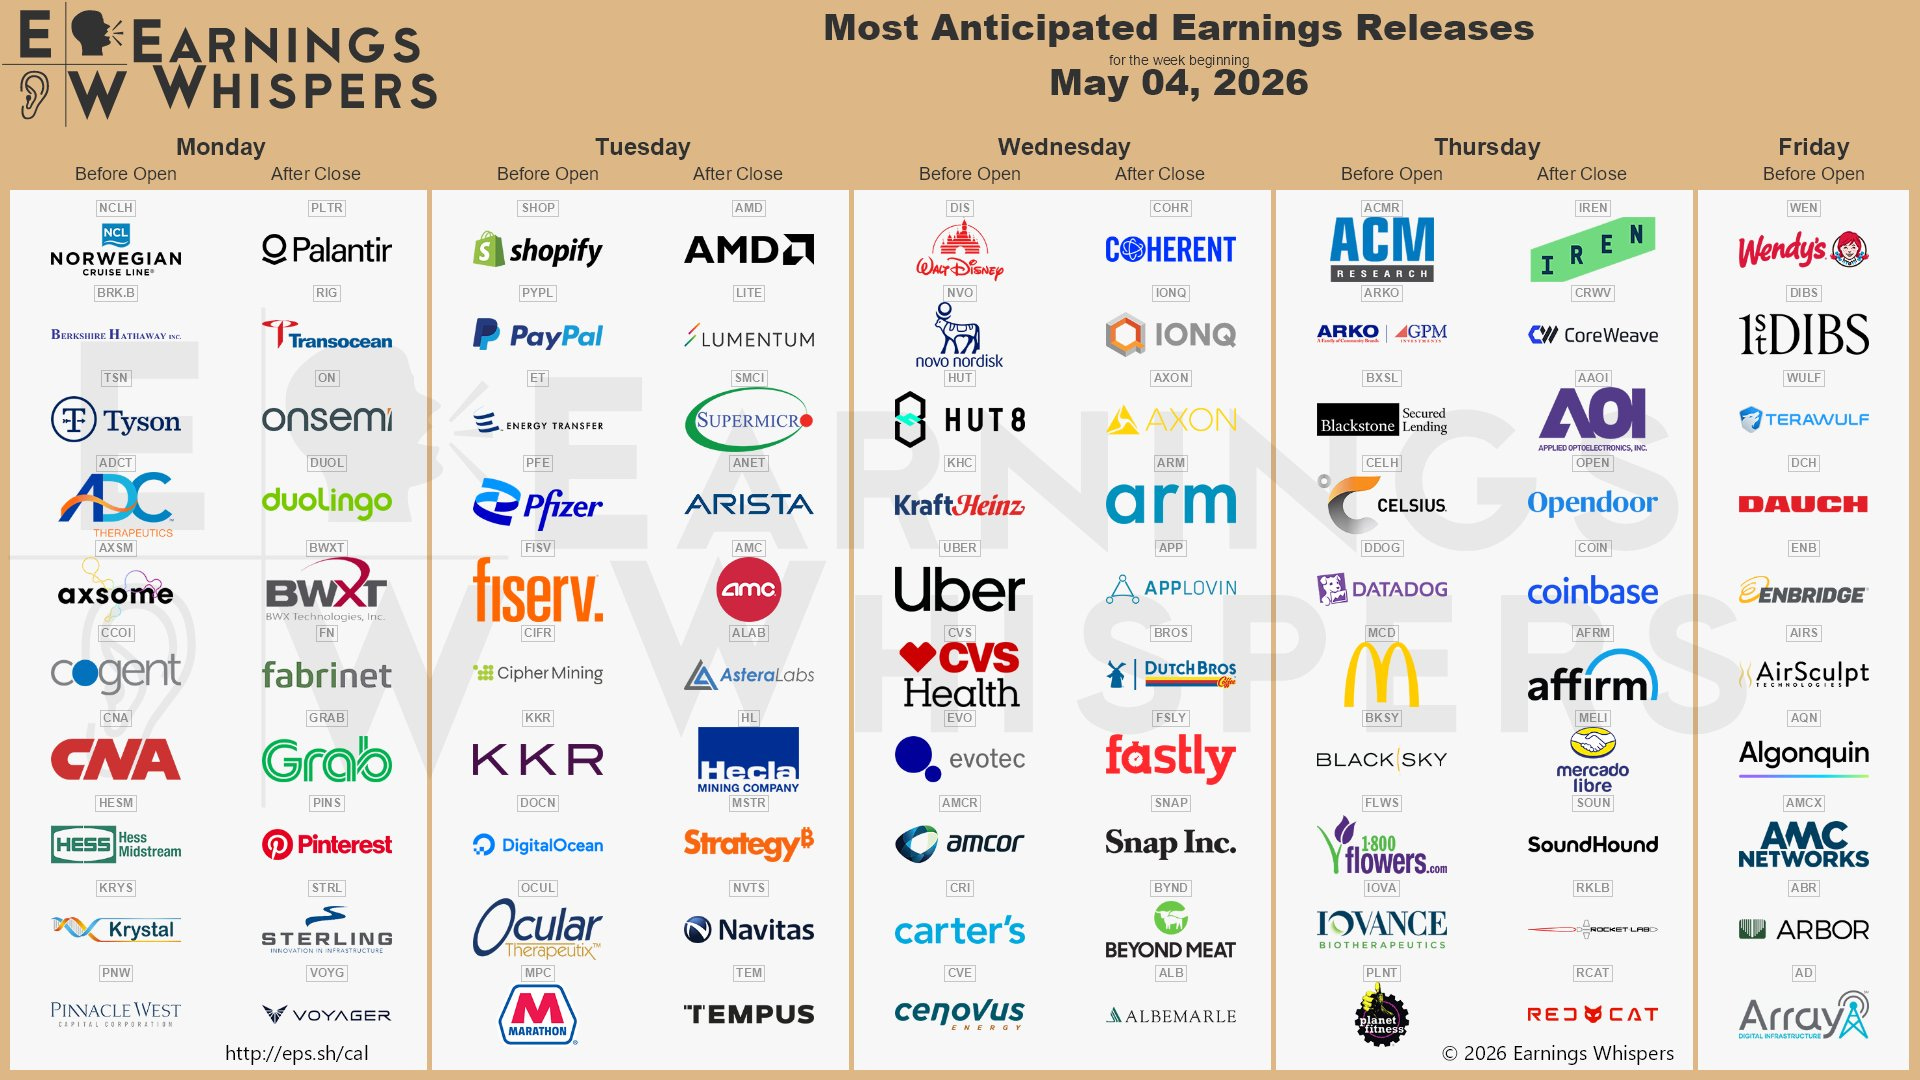
Economic & Earnings Calendar
Market Structure
Contextual Analysis & Plan
Key Levels of Interest
Last Week in Review
Last week’s plan:

Last week kicked off with a double distribution trend day on Monday, as buyers stepped in to defend the single prints from the Friday, April 24 double distribution trend day. A textbook Look Below and Fail (LBAF) at 7183 marked the launching point of that trend day. Passive buyers were able to absorb the aggressive selling effort, triggering a reversal, exactly the type of behavior you want to see in an uptrend (see Figure 1).
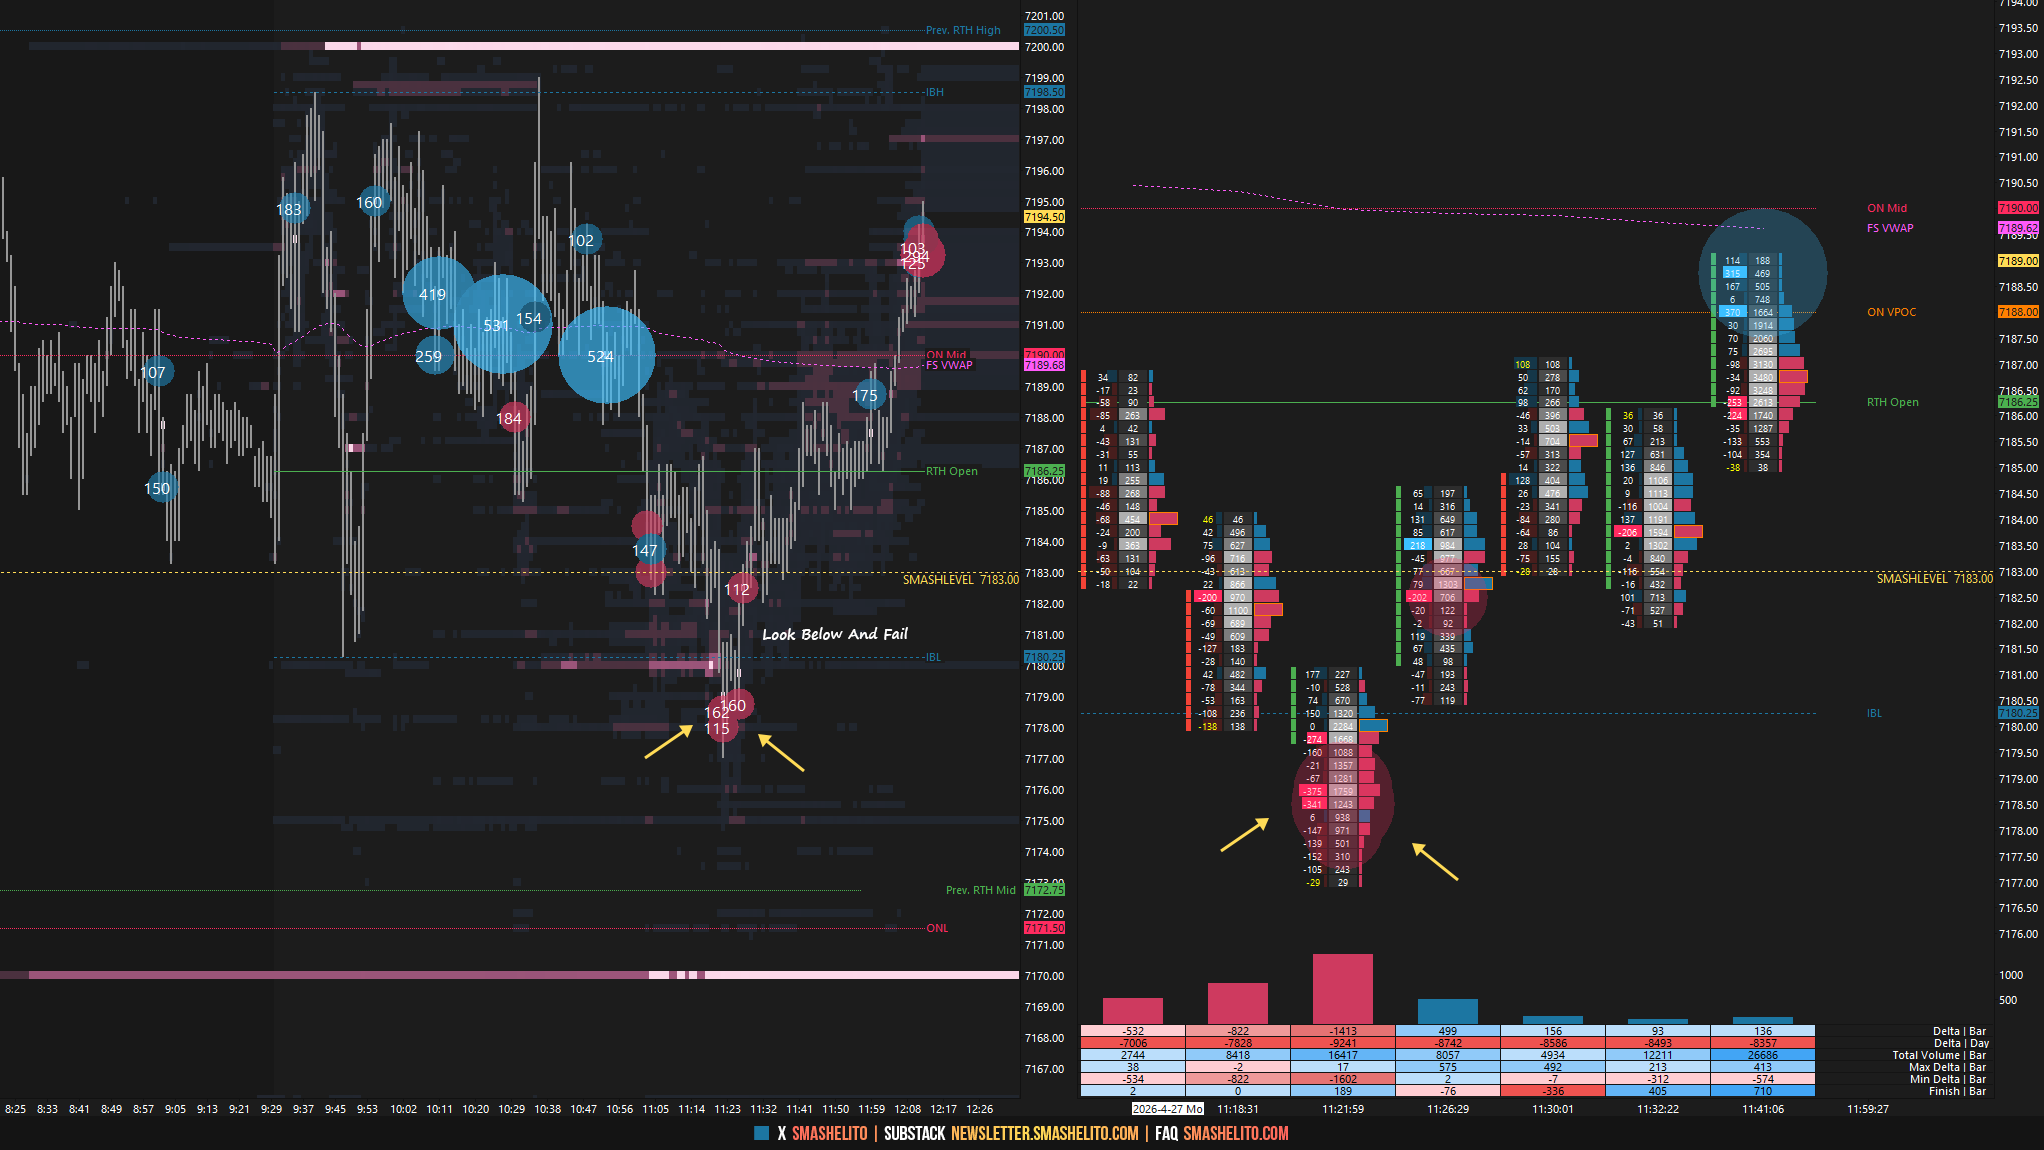
A key principle is that in an uptrend, the best long setups often emerge after a selling effort fails to shift tone and momentum, typically leading to continuation in the direction of the trend. The same applies in reverse for a downtrend, where the best short setups emerge after a buying effort fails.
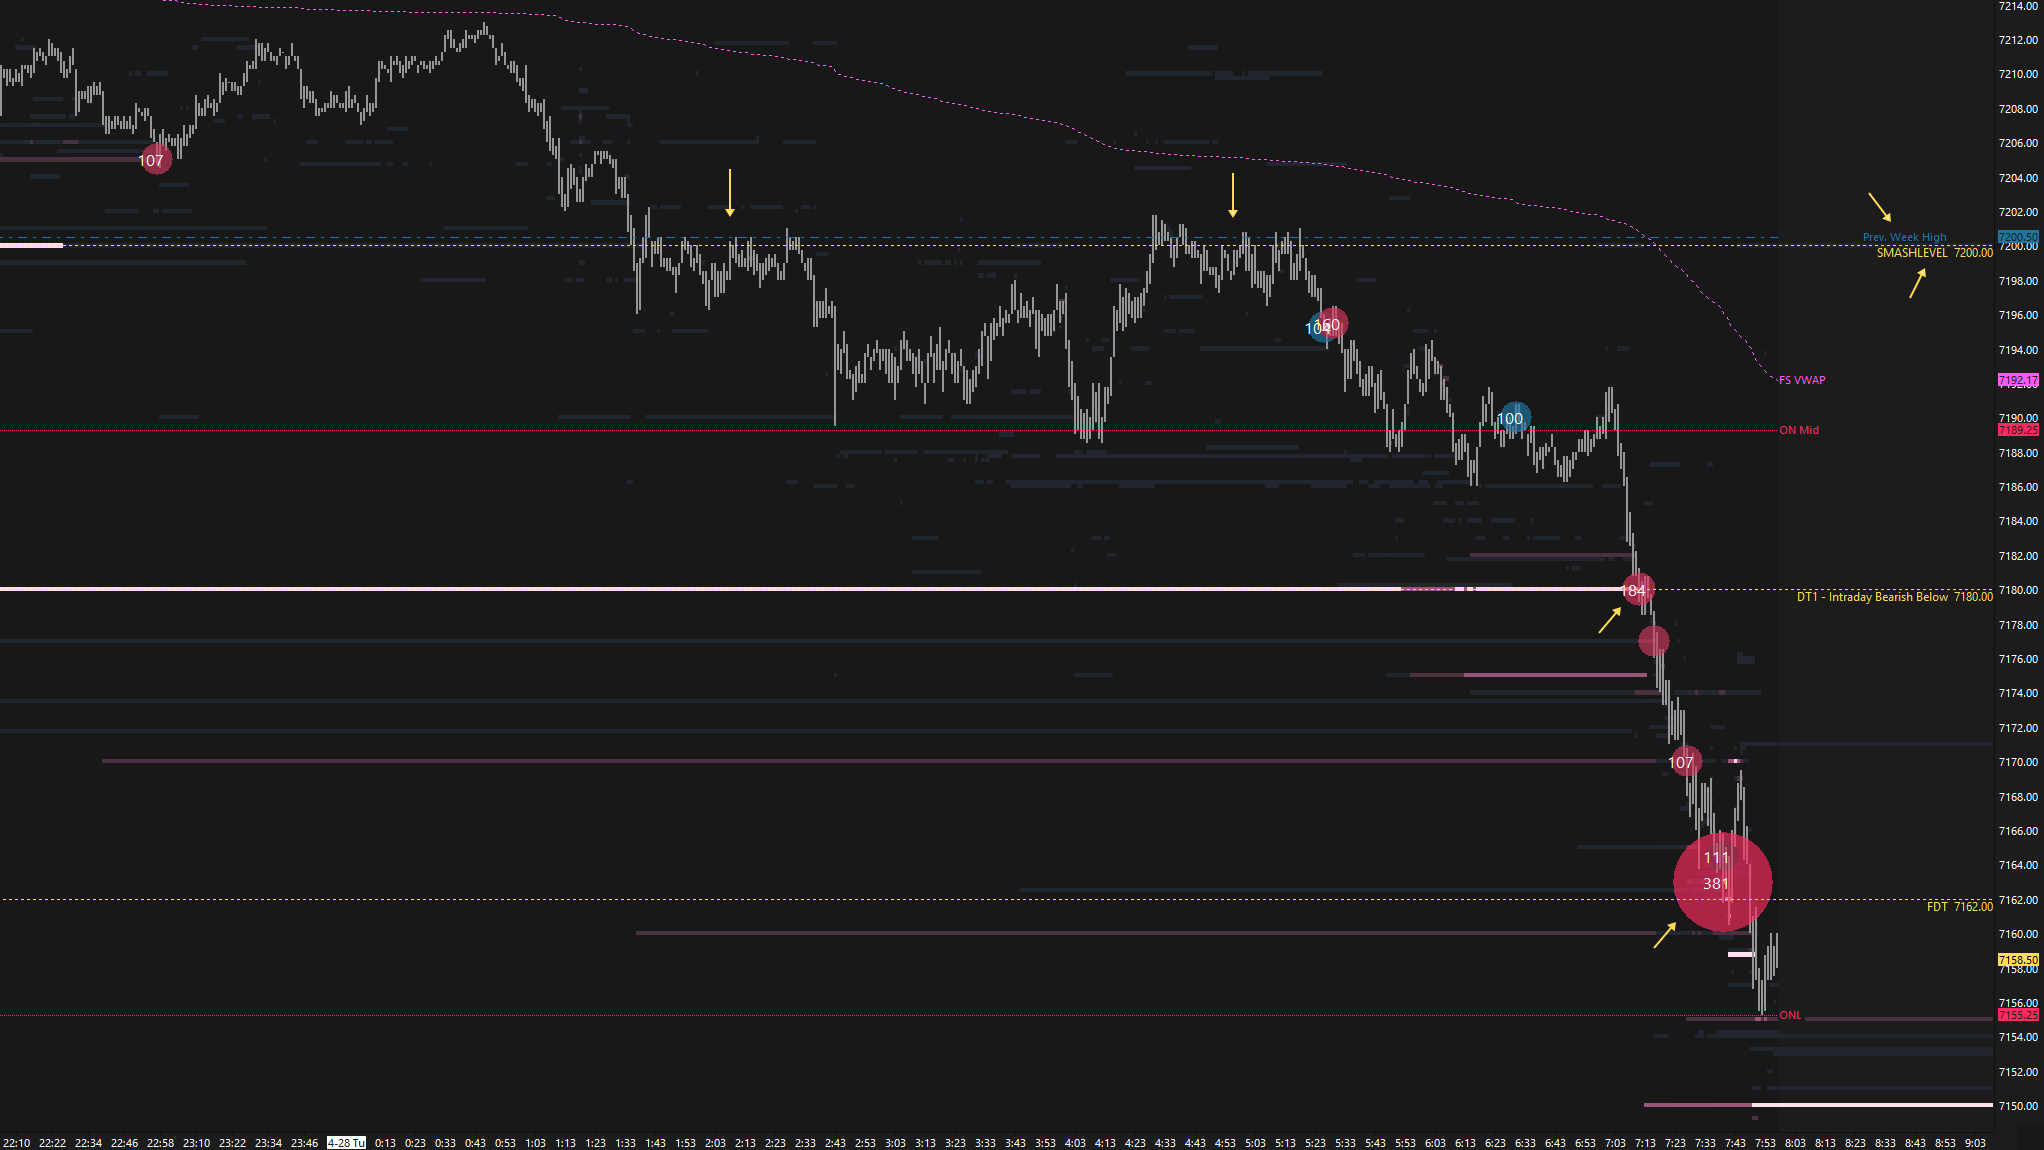
Tuesday’s session rejected both Monday’s and Friday’s (April 24) trend days after buyers failed to defend Tuesday’s Smashlevel (pivot) at 7200 (see Figure 2). As a result, the auction returned to balance heading into Wednesday’s session, with FOMC and tech earnings on deck.
On Wednesday, two-sided trade continued as the market awaited tech earnings. While the session offered limited trade opportunities, a great Look Below and Fail (LBAF) setup played out at 7156, the Smashlevel for the session.
Notice how price made a new low while cumulative volume delta (CVD) did not, signaling a lack of aggressive seller participation and potential exhaustion (see Figure 3). This is a divergence I like to see, especially around predefined levels of interest, particularly when it is counter to the prevailing trend.
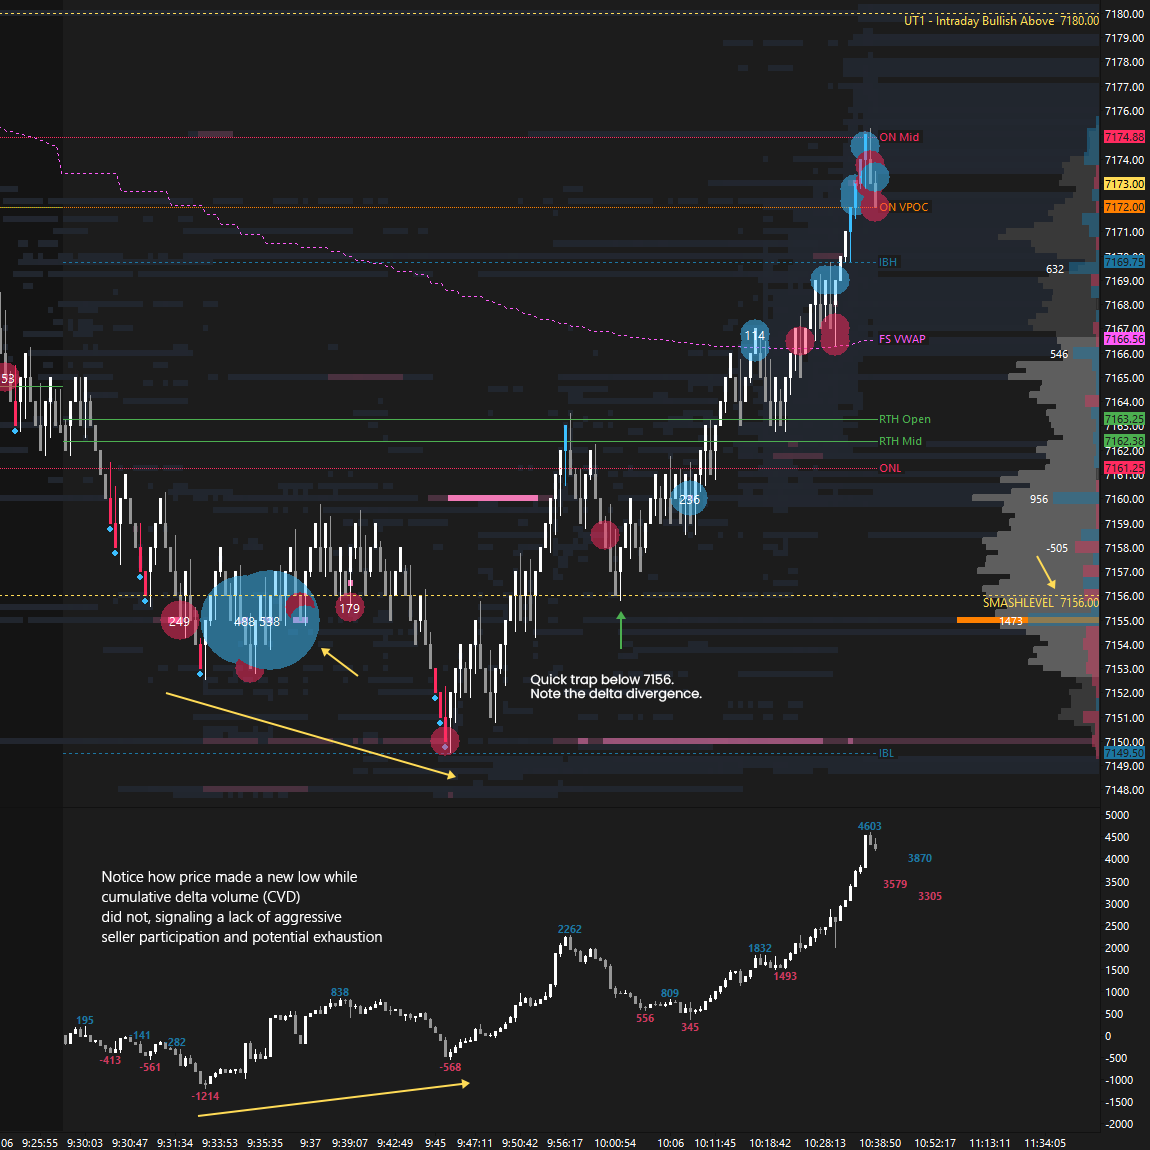
Cumulative Volume Delta (CVD) is a running total of the difference between aggressive buying (market buys lifting the ask) and aggressive selling (market sells hitting the bid). It helps reveal underlying order flow pressure that is not always visible in price alone, and can be used to identify absorption, exhaustion, and potential shifts in control between buyers and sellers when price and volume behavior begin to diverge.
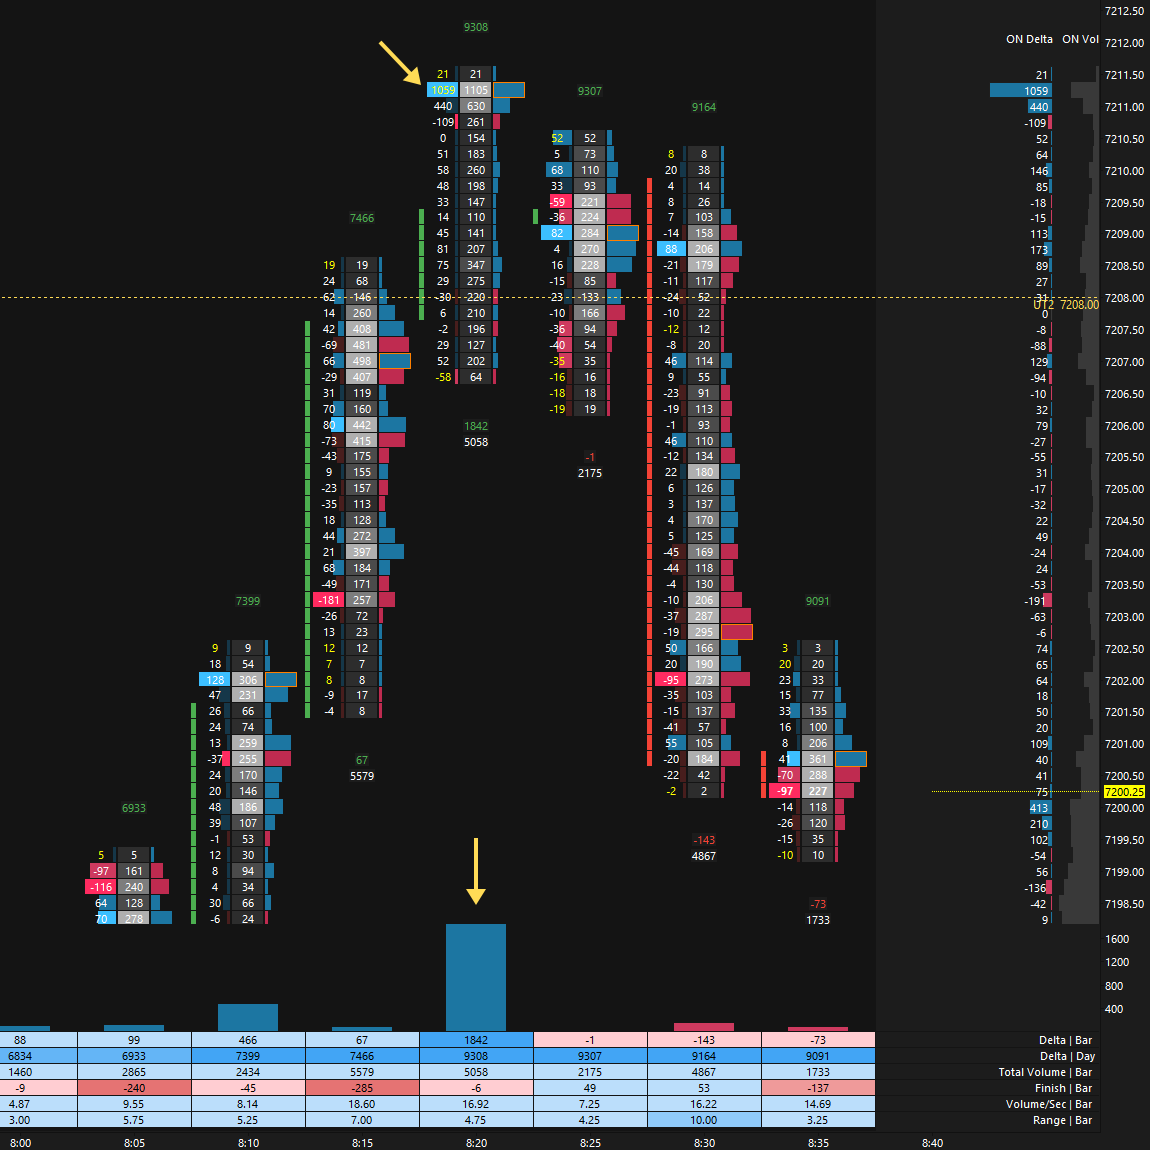
Thursday’s overnight session was wild, to say the least. A vicious rally was initiated off the 7150 Smashlevel (see Figure 4), driven by tech earnings (AMZN, GOOG, MSFT & META).
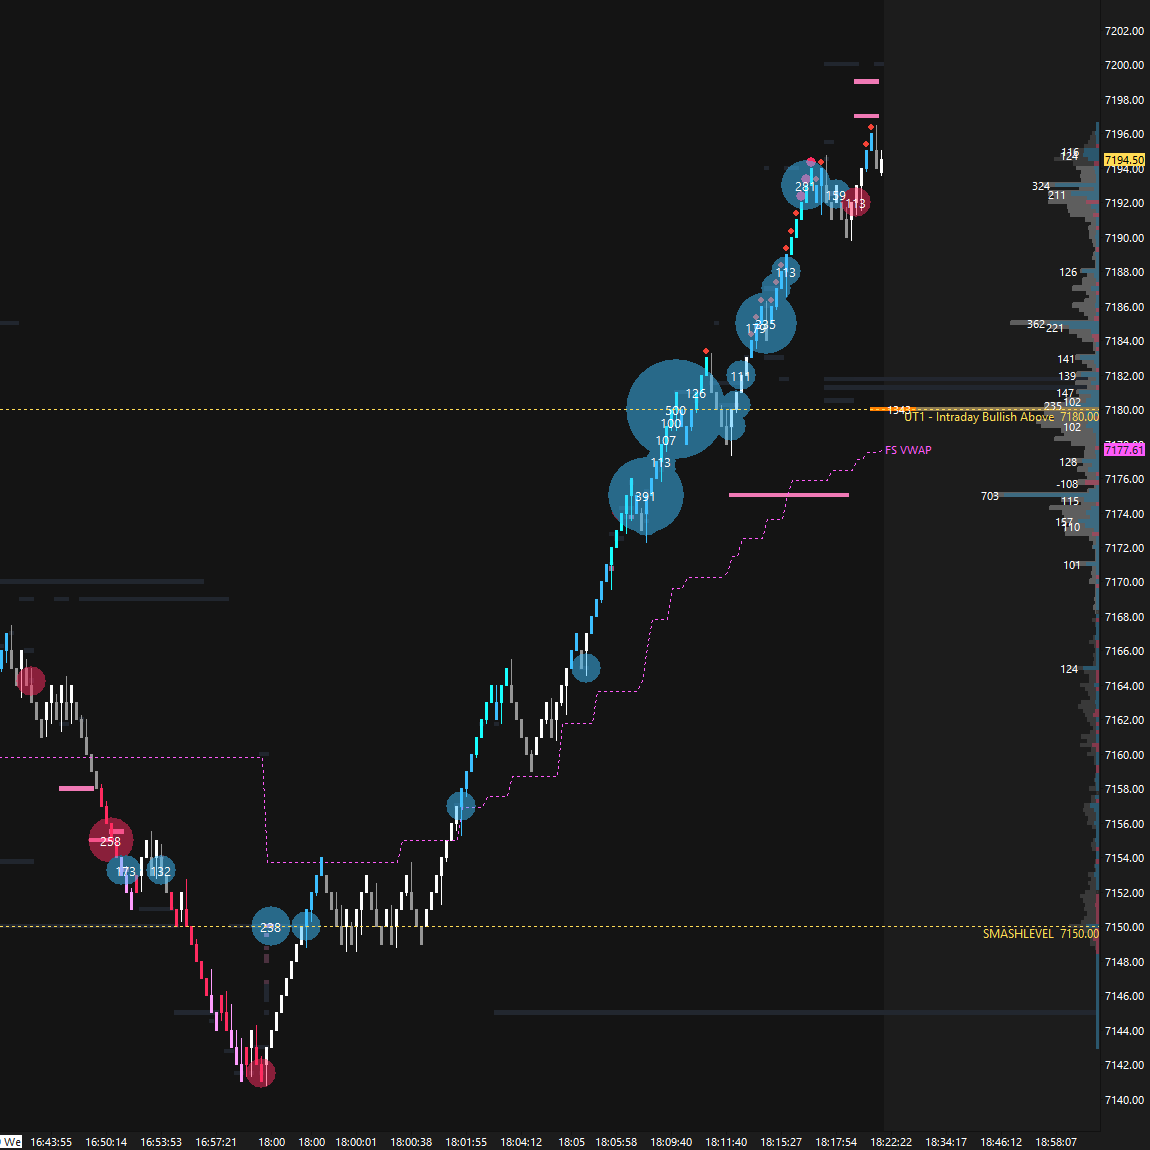
This move was difficult to participate in unless joined early. The better opportunity came on the first meaningful pullback toward 7180 (UT1), where buyers stepped in to the tick (see Figure 5).
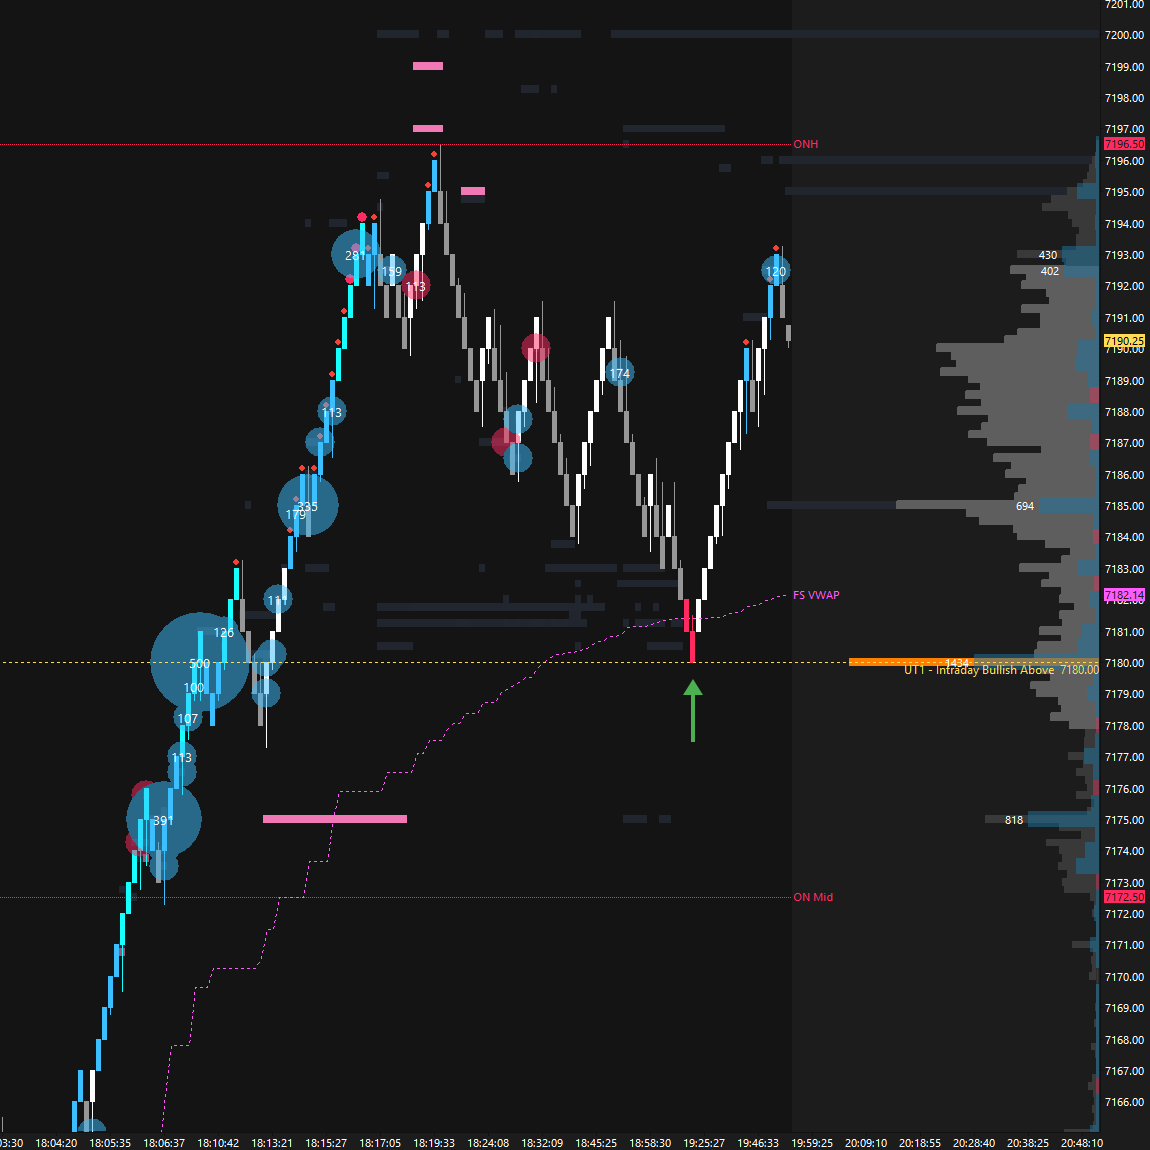
Another interesting sequence from this overnight session was the notable absorption at 7211.25 pre-open, from which a strong reversal unfolded, a move that extended into the RTH session, totaling 50 handles (see Figure 6).
This always looks great in hindsight; however, the key is knowing which trade locations are favorable, and more importantly unfavorable, before the fact, so you can act quickly when opportunities like these appear. This was aggressive buying being absorbed by passive sellers at the multi-day balance high, an unfavorable location for initiating longs.
During Thursday’s RTH session, buyers initiated a breakout from the developing 9-day balance, forming a double distribution trend day with four sets of single prints and shifting the auction into imbalance. This was followed by a true gap higher on Friday, a gap that remained unfilled (7251.75).
Friday’s session established an excess high, which was well auctioned from an order flow perspective (volume tapering). This is a key nuance to carry forward, as excess often marks the end of one auction and the start of another.
While ES formed an excess high and closed at the session lows, NQ once again showed relative strength on Friday. In last week’s Weekly Plan, a HTF level for NQ at 27930 was outlined as worth monitoring, along with both NQ and ES reactions. NQ came 13 handles shy of testing it (see Figure 7), while ES formed an excess high.
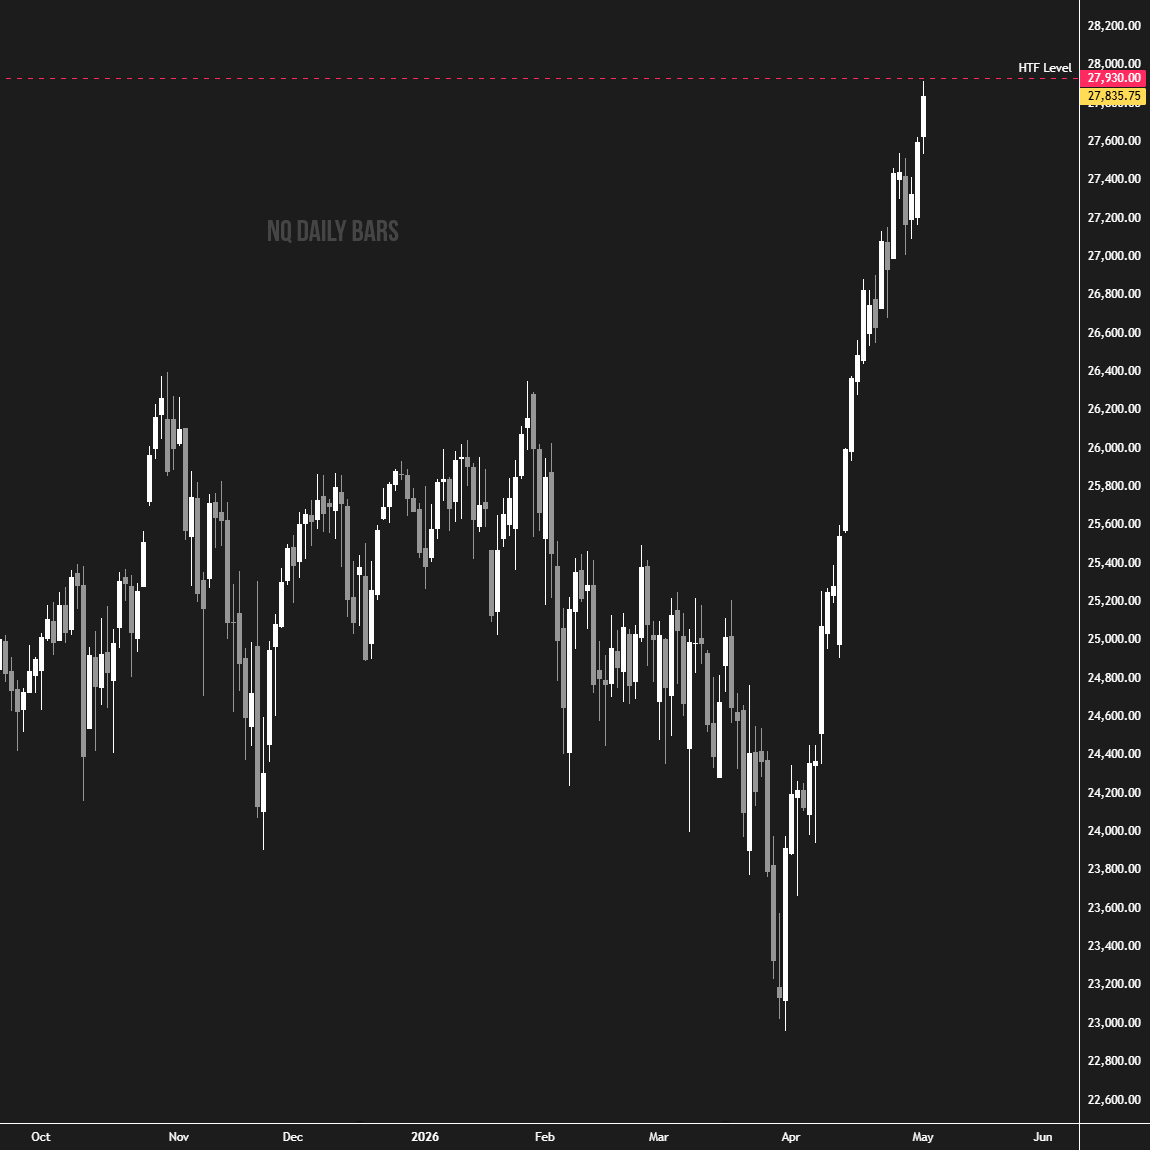
It remains to be seen if this coincidence carries any significance. I would continue to monitor behavior around 27930. Acceptance above it could drag ES higher, while failure to do so could introduce short-term weakness.
Last Week’s Levels in Review
Economic & Earnings Calendar
Central Standard Time
Earnings Whispers
Market Structure
🟩 Daily: OTFU → Ends at: 7255.50
🟩 Weekly: OTFU → Ends at: 7137
🟩 Monthly: OTFU → Ends at: 6514.25
Balance: A market condition where price consolidates within a defined range, reflecting indecision as the market awaits more market-generated information. We apply balance guidelines—favoring fade trades at range extremes (highs/lows) and preparing for breakout setups if balance resolves.
One-Time Framing Up (OTFU): A market condition where each subsequent bar forms a higher low, signaling a strong upward trend.
One-Time Framing Down (OTFD): A market condition where each subsequent bar forms a lower high, signaling a strong downward trend.
Contextual Analysis & Plan
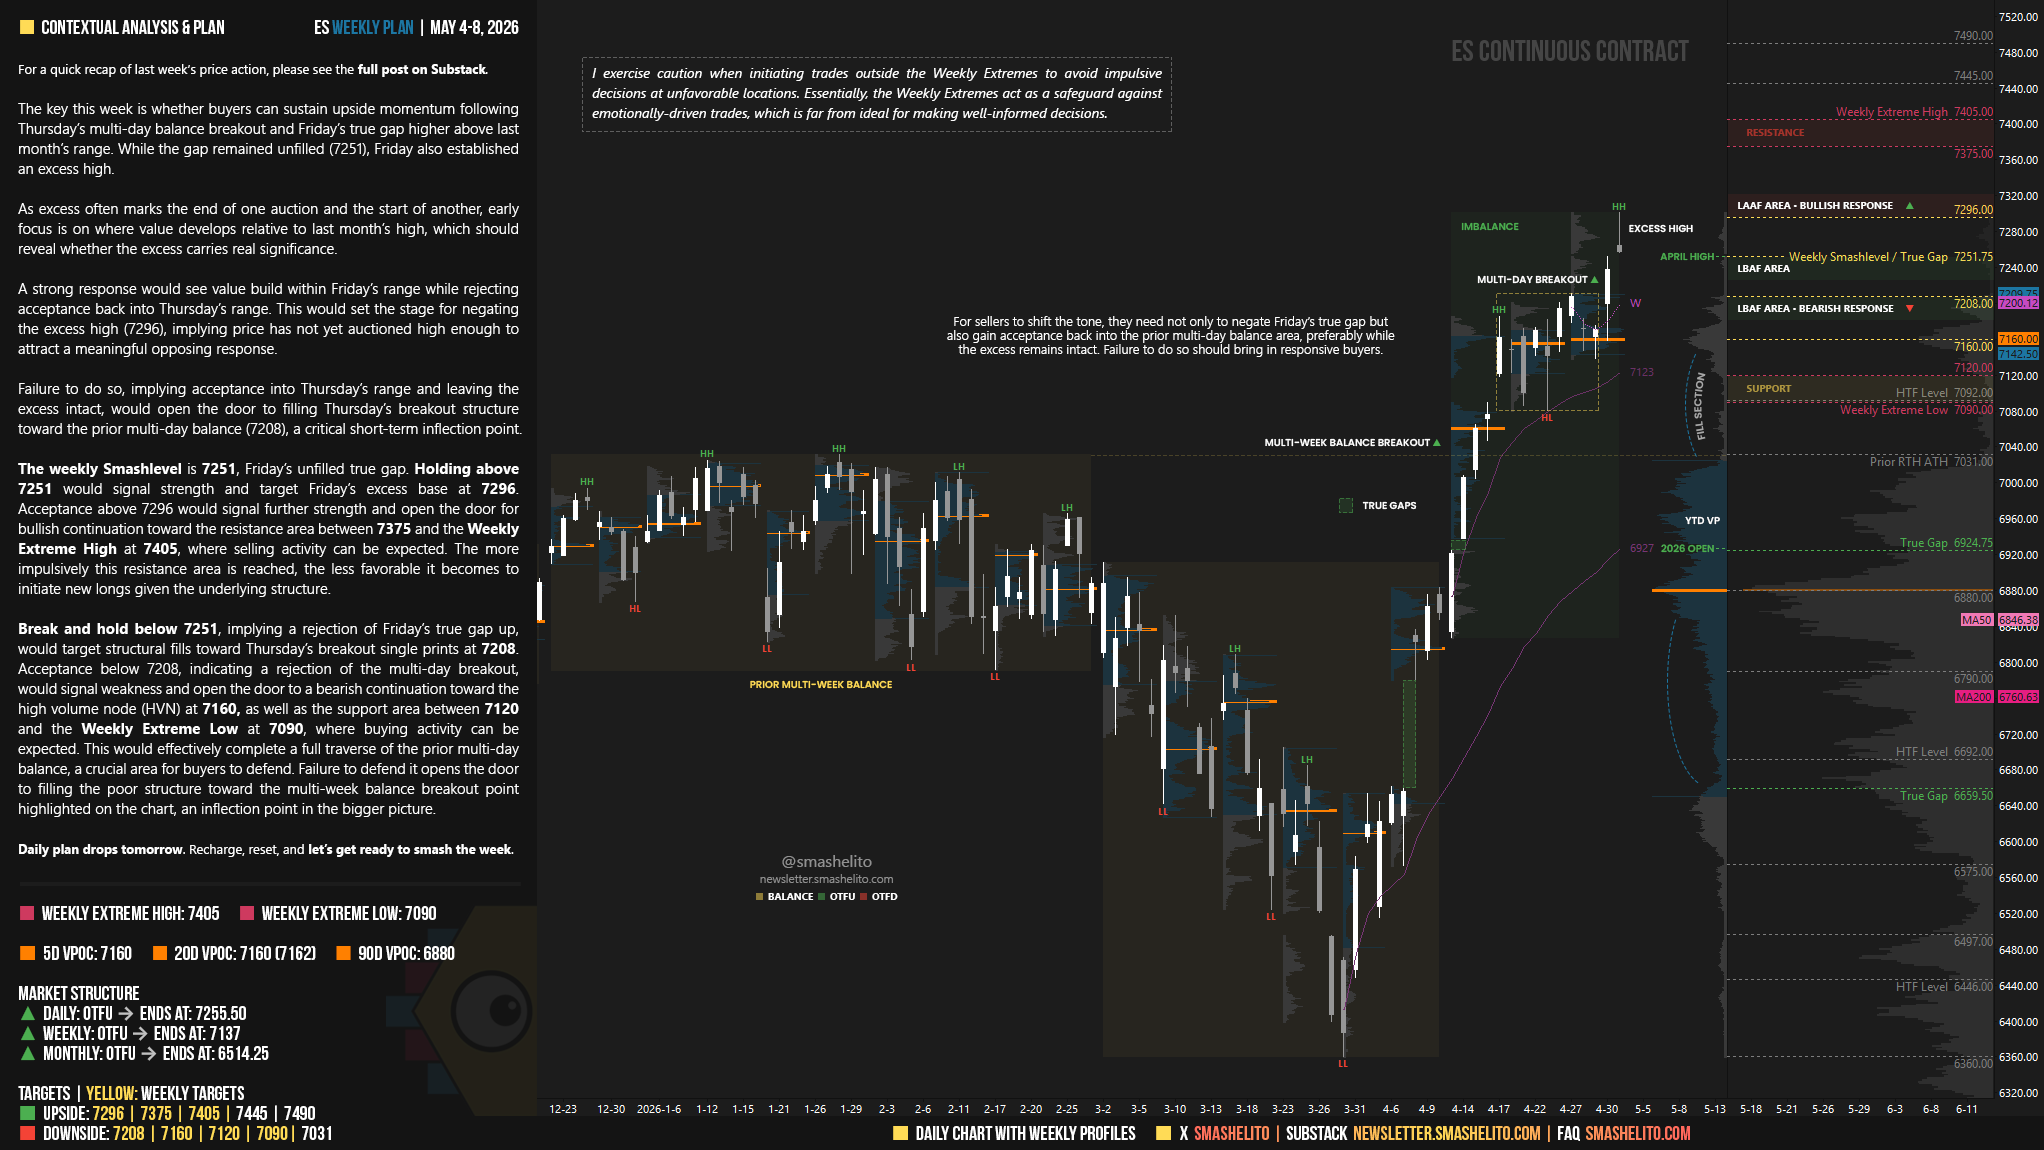
The key this week is whether buyers can sustain upside momentum following Thursday’s multi-day balance breakout and Friday’s true gap higher above last month’s range. While the gap remained unfilled (7251), Friday also established an excess high.
As excess often marks the end of one auction and the start of another, early focus is on where value develops relative to last month’s high, which should reveal whether the excess carries real significance.
A strong response would see value build within Friday’s range while rejecting acceptance back into Thursday’s range. This would set the stage for negating the excess high (7296), implying price has not yet auctioned high enough to attract a meaningful opposing response.
Failure to do so, implying acceptance into Thursday’s range and leaving the excess intact, would open the door to filling Thursday’s breakout structure toward the prior multi-day balance (7208), a critical short-term inflection point.
The weekly Smashlevel is 7251, Friday’s unfilled true gap. Holding above 7251 would signal strength and target Friday’s excess base at 7296. Acceptance above 7296 would signal further strength and open the door for bullish continuation toward the resistance area between 7375 and the Weekly Extreme High at 7405, where selling activity can be expected. The more impulsively this resistance area is reached, the less favorable it becomes to initiate new longs given the underlying structure.
Break and hold below 7251, implying a rejection of Friday’s true gap up, would target structural fills toward Thursday’s breakout single prints at 7208. Acceptance below 7208, indicating a rejection of the multi-day breakout, would signal weakness and open the door to a bearish continuation toward the high volume node (HVN) at 7160, as well as the support area between 7120 and the Weekly Extreme Low at 7090, where buying activity can be expected. This would effectively complete a full traverse of the prior multi-day balance, a crucial area for buyers to defend. Failure to defend it opens the door to filling the poor structure toward the multi-week balance breakout point highlighted on the chart, an inflection point in the bigger picture.
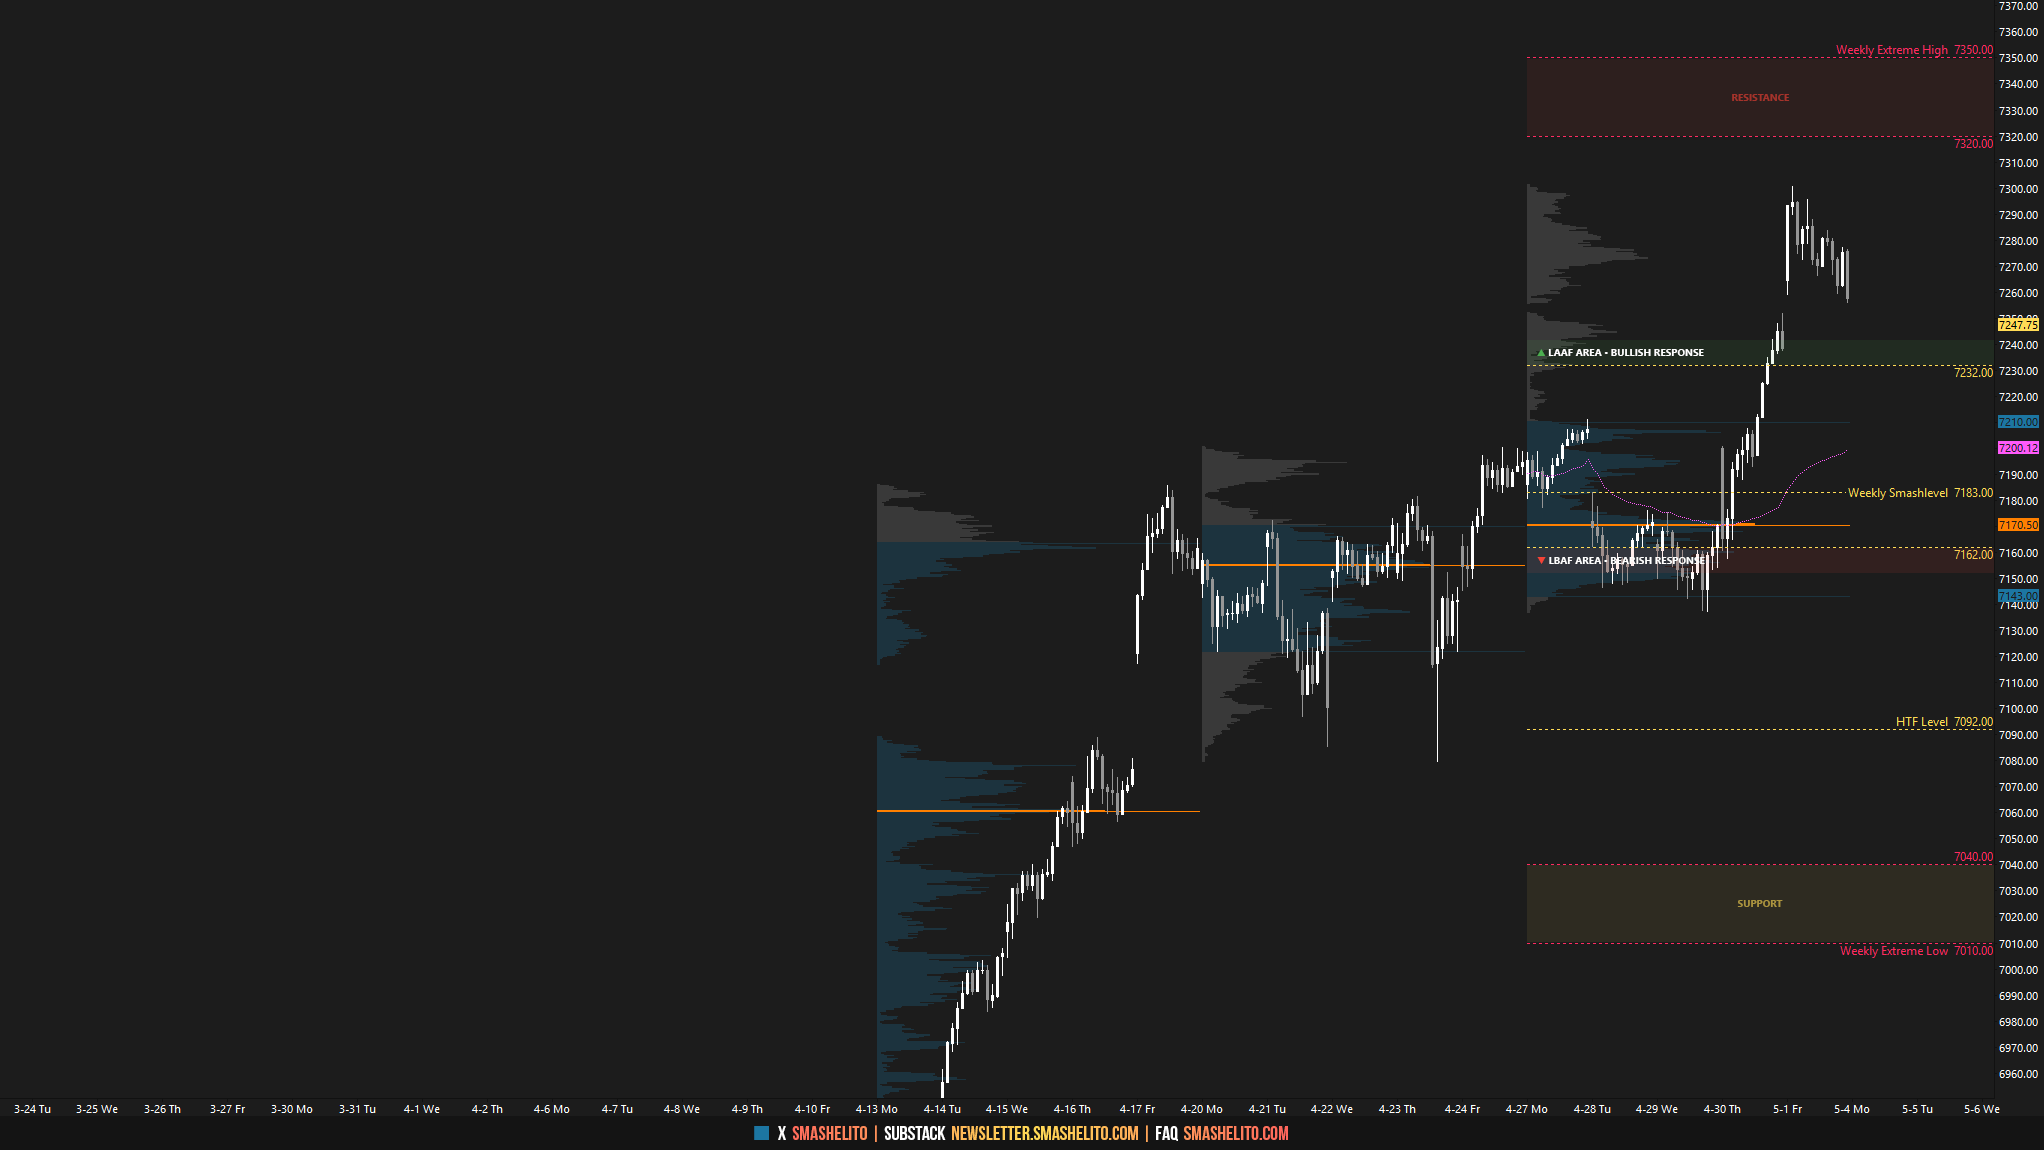
Visual Representation
Key Levels of Interest
In the upcoming week, I will closely observe the behavior around 7251.
Holding above 7251 would target 7296 / 7375 / 7405* / 7445 / 7490
Break and hold below 7251 would target 7208 / 7160 / 7120 / 7090* / 7031
*Weekly Extremes (defined by proprietary models). I exercise caution when initiating trades outside the Weekly Extremes to avoid impulsive decisions at unfavorable locations. Essentially, the Weekly Extremes act as a safeguard against emotionally-driven trades, which is far from ideal for making well-informed decisions.
Daily plan drops tomorrow. Recharge, reset, and let’s get ready to smash the week.
Hi Smash, just wanted to clarify about True Gap from last week’s newsletter. Assuming when you refer to “session,” you mean RTH only—in that case, would Thursday’s RTH high of 7251.75 be considered a True Gap, since Friday’s RTH session opened, traded, and closed above it? Thanks again for your smashing ES newsletters.
Is there any way to share what other HTF levels you have for NQ? Was this from the same friend who provided the 2026 outlook ones for ES that are constantly referenced?