
ES Weekly Plan | May 12-16, 2025
Key Levels & Market Context for the Upcoming Week.

Economic Calendar

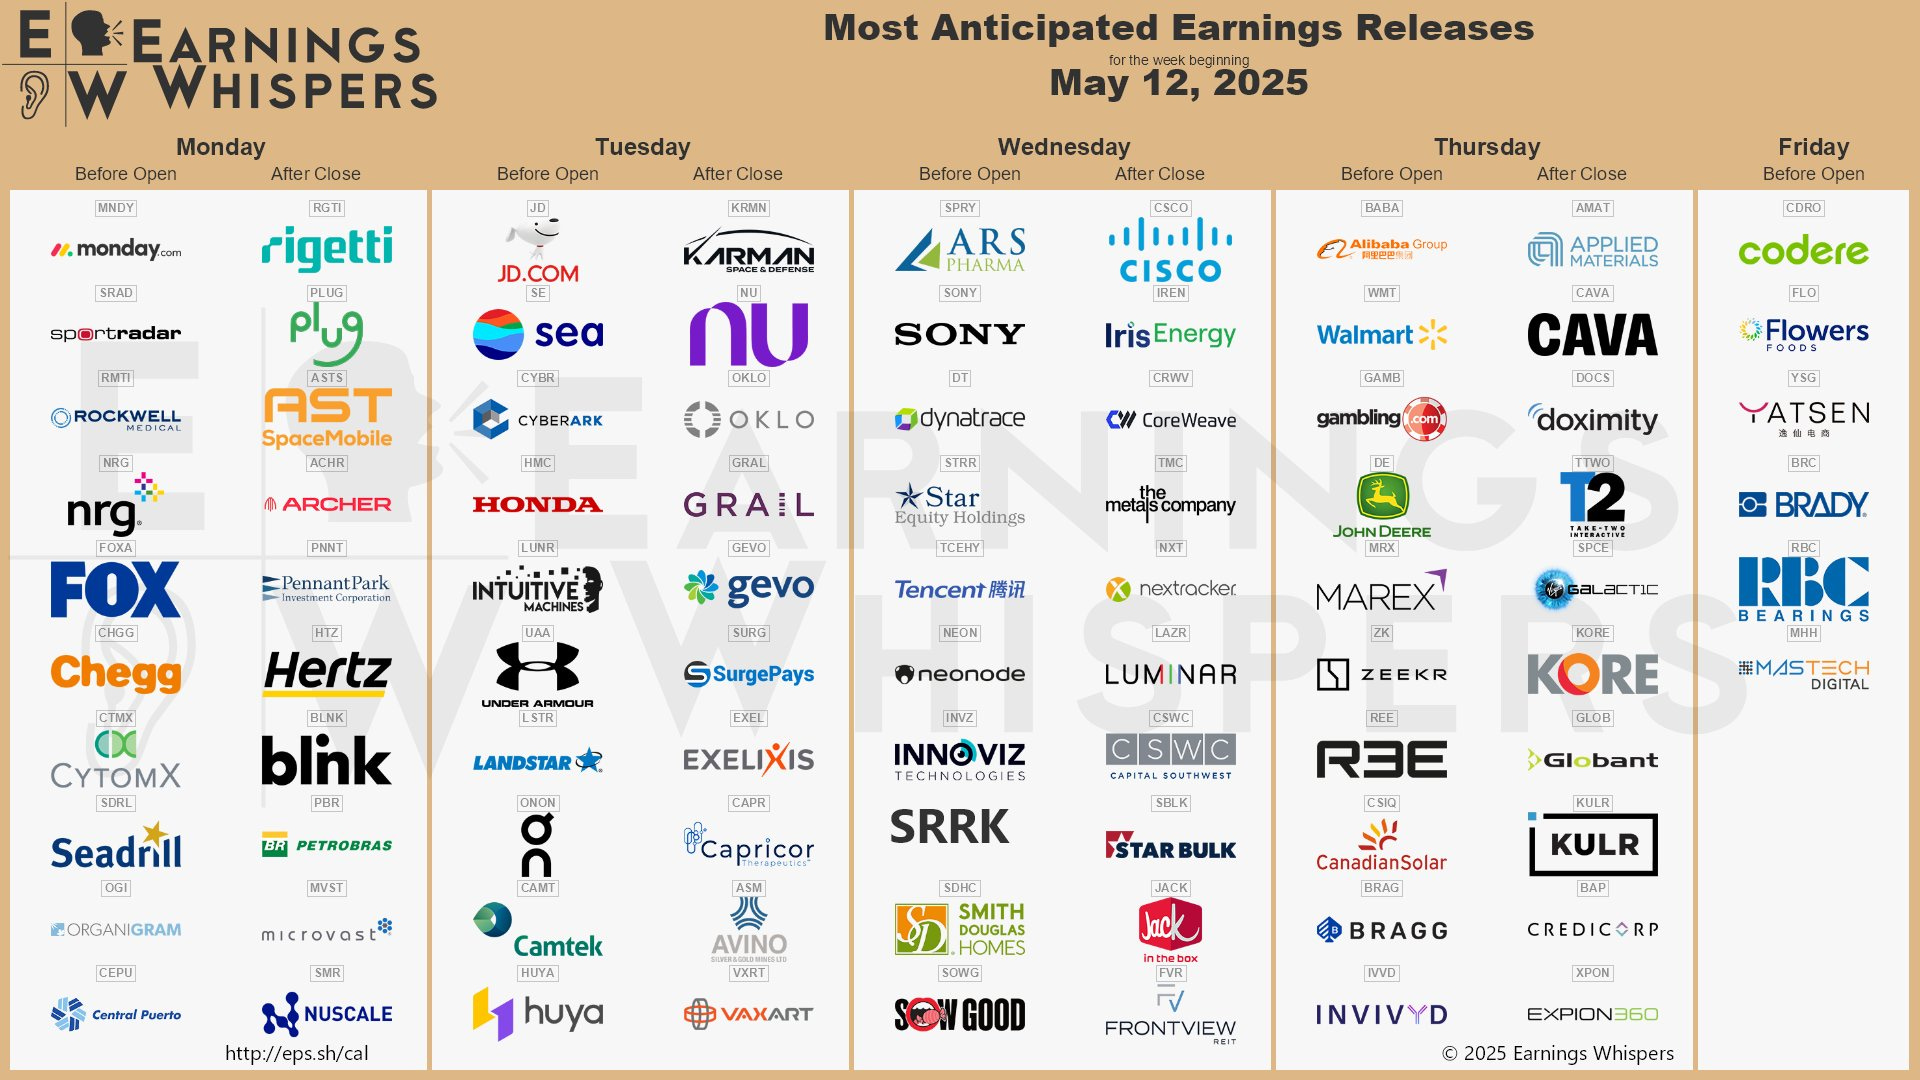
Earnings Calendar
Visual Representation

Market Structure
🟨 DAILY: BALANCE → 7-Day → High: 5741 / Low: 5596
🟩 WEEKLY: OTFU → Ends at: 5596
🟨 MONTHLY: BALANCE → TBD
One-time Framing Down (OTFD): A market condition where each subsequent bar forms a lower high, indicating a strong downward trend. The opposite condition, One-time Framing Up (OTFU), occurs when each subsequent bar forms a higher low, indicating a strong upward trend.
Contextual Analysis
Last week, the market consolidated within the upper distribution from the prior week, accepting higher prices. The upside was capped by the initial upside target (5750), while the downside was supported at the initial downside target (5609). Monday’s session ended the daily one-time framing up by breaching Friday’s low, and since then, responsive two-sided activity has been the main theme. In the prior Weekly Plan, we discussed that simply filling the gap wouldn’t be enough to signal change—only filling the gap and gaining acceptance within the lower distribution of the prior week had the potential to shift short-term control away from buyers.
The gap at 5606.75 was filled on Wednesday, where buyers were waiting. A breakout was attempted on Thursday; however, after sweeping April’s high, the market fell back into range. Friday’s session formed an inside day—our immediate focus going into the new week. Notably, both short-term value (5D VPOC) and medium-term value (20D VPOC) have aligned within the current 7-day balance area (5678), suggesting the market is coiling for a directional move. As always, the longer the consolidation, the more significant the breakout tends to be. This market remains highly headline-driven—stay nimble.
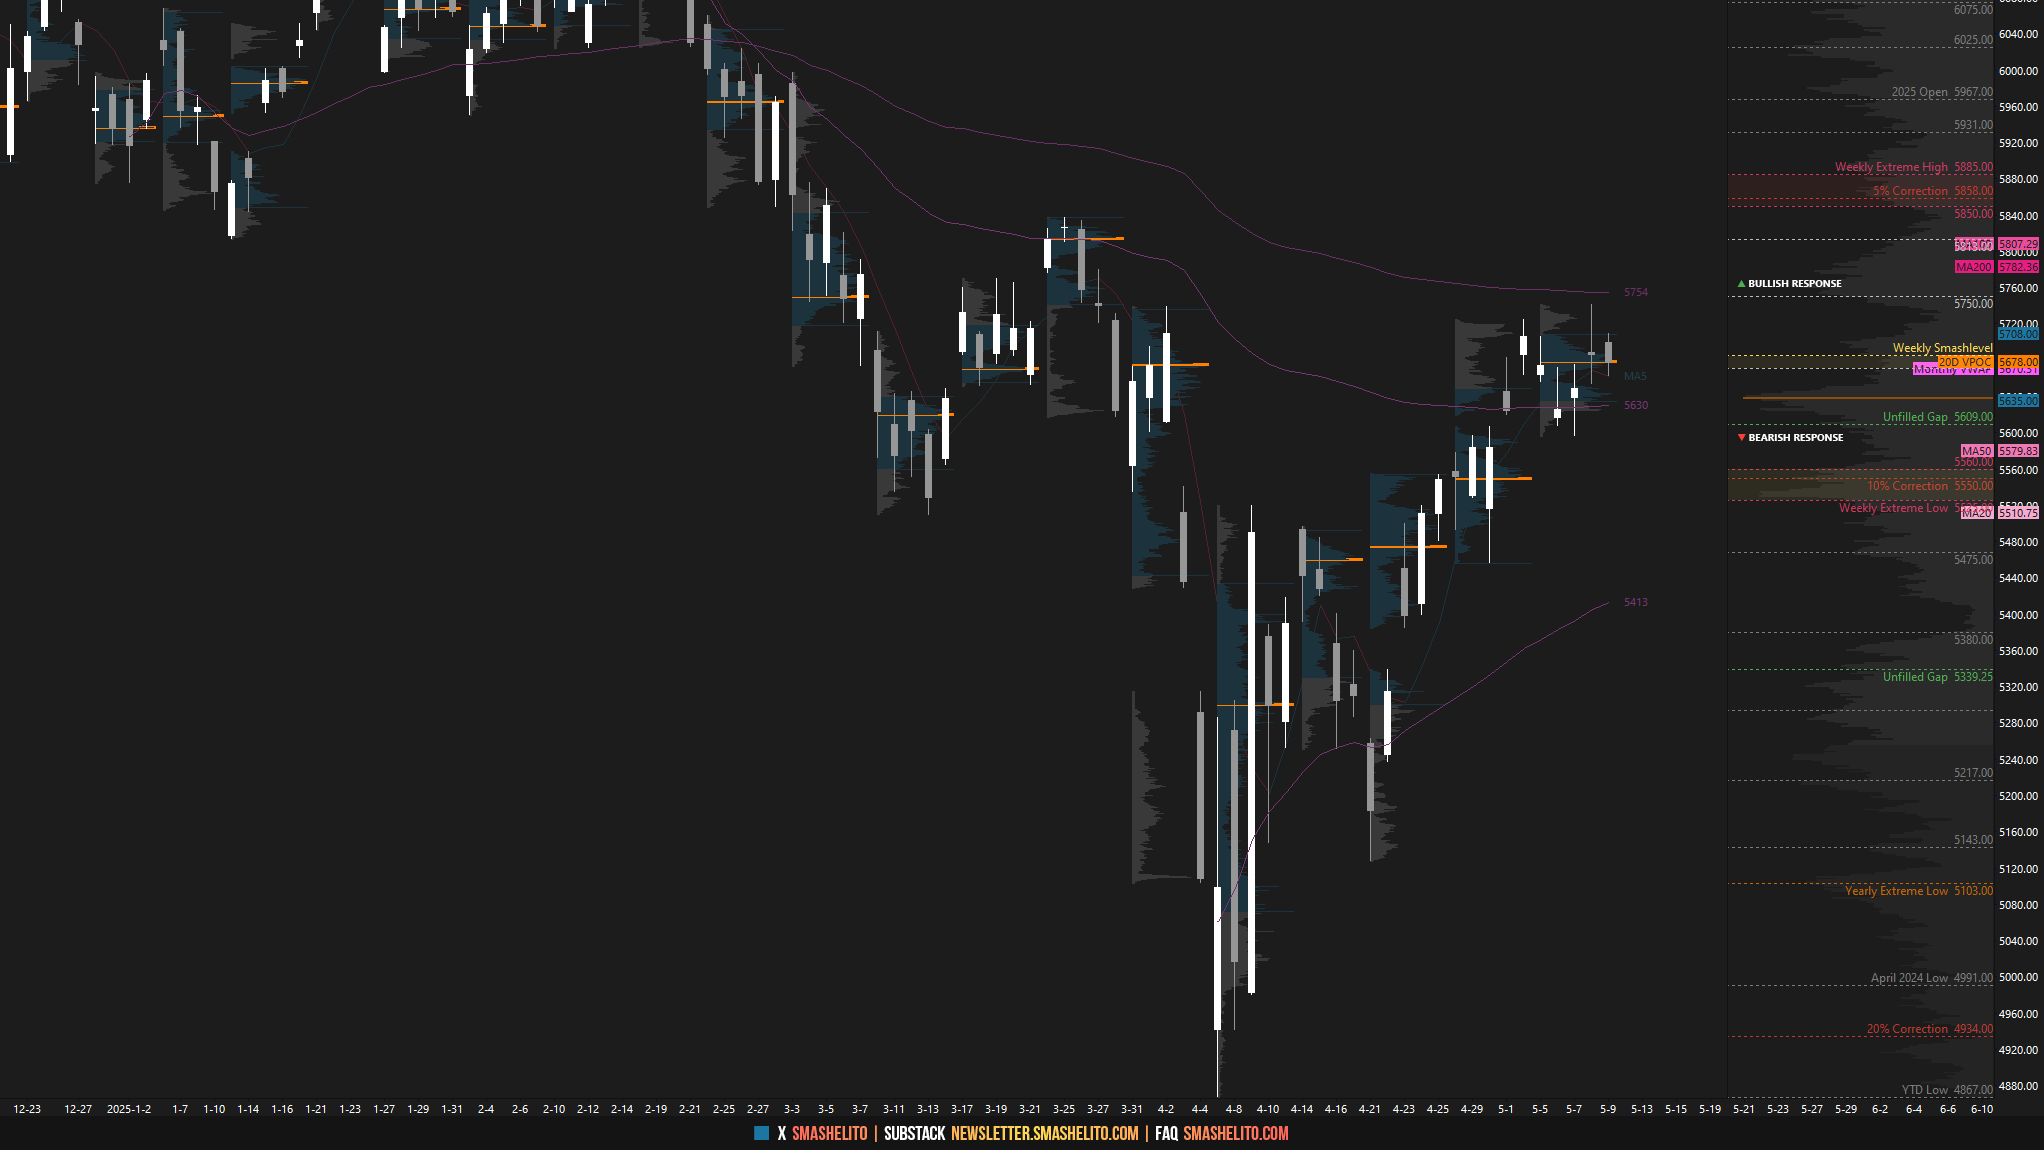
This week, the main focus will be on the current 7-day balance area between 5741 and 5596, where responsive two-sided activity has been taking place since the market returned to a balanced state early last week. The key question now is whether buyers will continue to build acceptance within March’s value area, setting the stage for a breakout attempt and a potential traverse of that value area. Conversely, a weak response would involve a sustained breakdown from balance and acceptance back within April’s value area. The value areas for both March and April are highlighted with yellow dashed lines for reference.
When the market is in balance, we use the balance guidelines as a framework to form trade hypotheses based on how price behaves around that balance area. A balanced market reflects agreement on value, typically showing rotational behavior between clearly defined highs and lows. In this environment, the first guideline is to look for trades that fade moves toward the extremes of the balance, as these are often rejected unless supported by strong participation.
If price breaks out of the balance area and shows signs of acceptance—such as holding above or below the prior extremes—we follow the direction of the break, anticipating that the market is initiating a move to discover a new area of value. However, if the breakout attempt fails and price returns back into the prior range, it often signals a lack of conviction. In that case, the expectation shifts to a move toward the opposite end of the balance. Breakouts that go against the broader market tone—such as upside breaks in bearish environments or downside breaks in bullish ones—tend to have a higher likelihood of failure, as they lack alignment with the prevailing directional bias and underlying sentiment.
These guidelines are not rigid but serve as context-driven cues to assess whether the market is accepting higher or lower prices, or rejecting them in favor of prior value. They provide a structured way to manage risk by offering clear invalidation points and supporting decision-making across both rotational and directional market conditions.
The weekly Smashlevel is 5656—a significant low volume node from last week. Holding above 5656 would target the multi-day balance high at 5741. Acceptance above 5741—a sustained breakout—would signal strength, targeting the resistance area from 5815 to the Weekly Extreme High of 5855, where selling activity can be expected. This would complete a full traverse of March’s value area.
Break and hold below 5656 would target the multi-day balance low at 5596—a crucial level for buyers to defend. Acceptance below 5596—a sustained breakdown and end of the Weekly OTFU—would signal weakness, targeting the support area from 5550 to the Weekly Extreme Low of 5510, where buying activity can be expected. This support coincides with a weekly NVPOC, the 10% correction level, and marks the breakout point from the prior 2-week balance area—a crucial area for buyers to defend.
Levels of Interest
In the upcoming week, I will closely observe the behavior around 5656.
Holding above 5656 would target 5741 / 5815 / 5855* / 5898 / 5931
Break and hold below 5656 would target 5596 / 5550 / 5510* / 5455 / 5385
*Weekly Extremes. I exercise caution when initiating trades outside the Weekly Extremes to avoid making impulsive decisions at unfavorable locations. Essentially, the Weekly Extremes serve as a safeguard against emotionally-driven trades, a state that is less than ideal for making well-informed trading decisions.
As usual, a detailed daily plan will be published tomorrow. In the meantime, enjoy the rest of your weekend!
Great stuff Smash! Thank you!
So funny..... I was JUST thinking about you! - I am studying at the moment trying to see exactly how your levels come out - reviewing old newsletters - thank you Smashie!!