
ES Weekly Plan | May 11-15, 2026
Recap, Market Context & Key Levels for the Week Ahead

Welcome to this week’s plan. Inside, you’ll find a quick review of last week’s price action, key economic events, market structure, context for the week ahead, and the levels I’ll be focusing on. Let’s get prepared.
Contents
Last Week in Review
Economic & Earnings Calendar
Market Structure
Contextual Analysis & Plan
Key Levels of Interest
Last Week in Review
Last week’s plan:

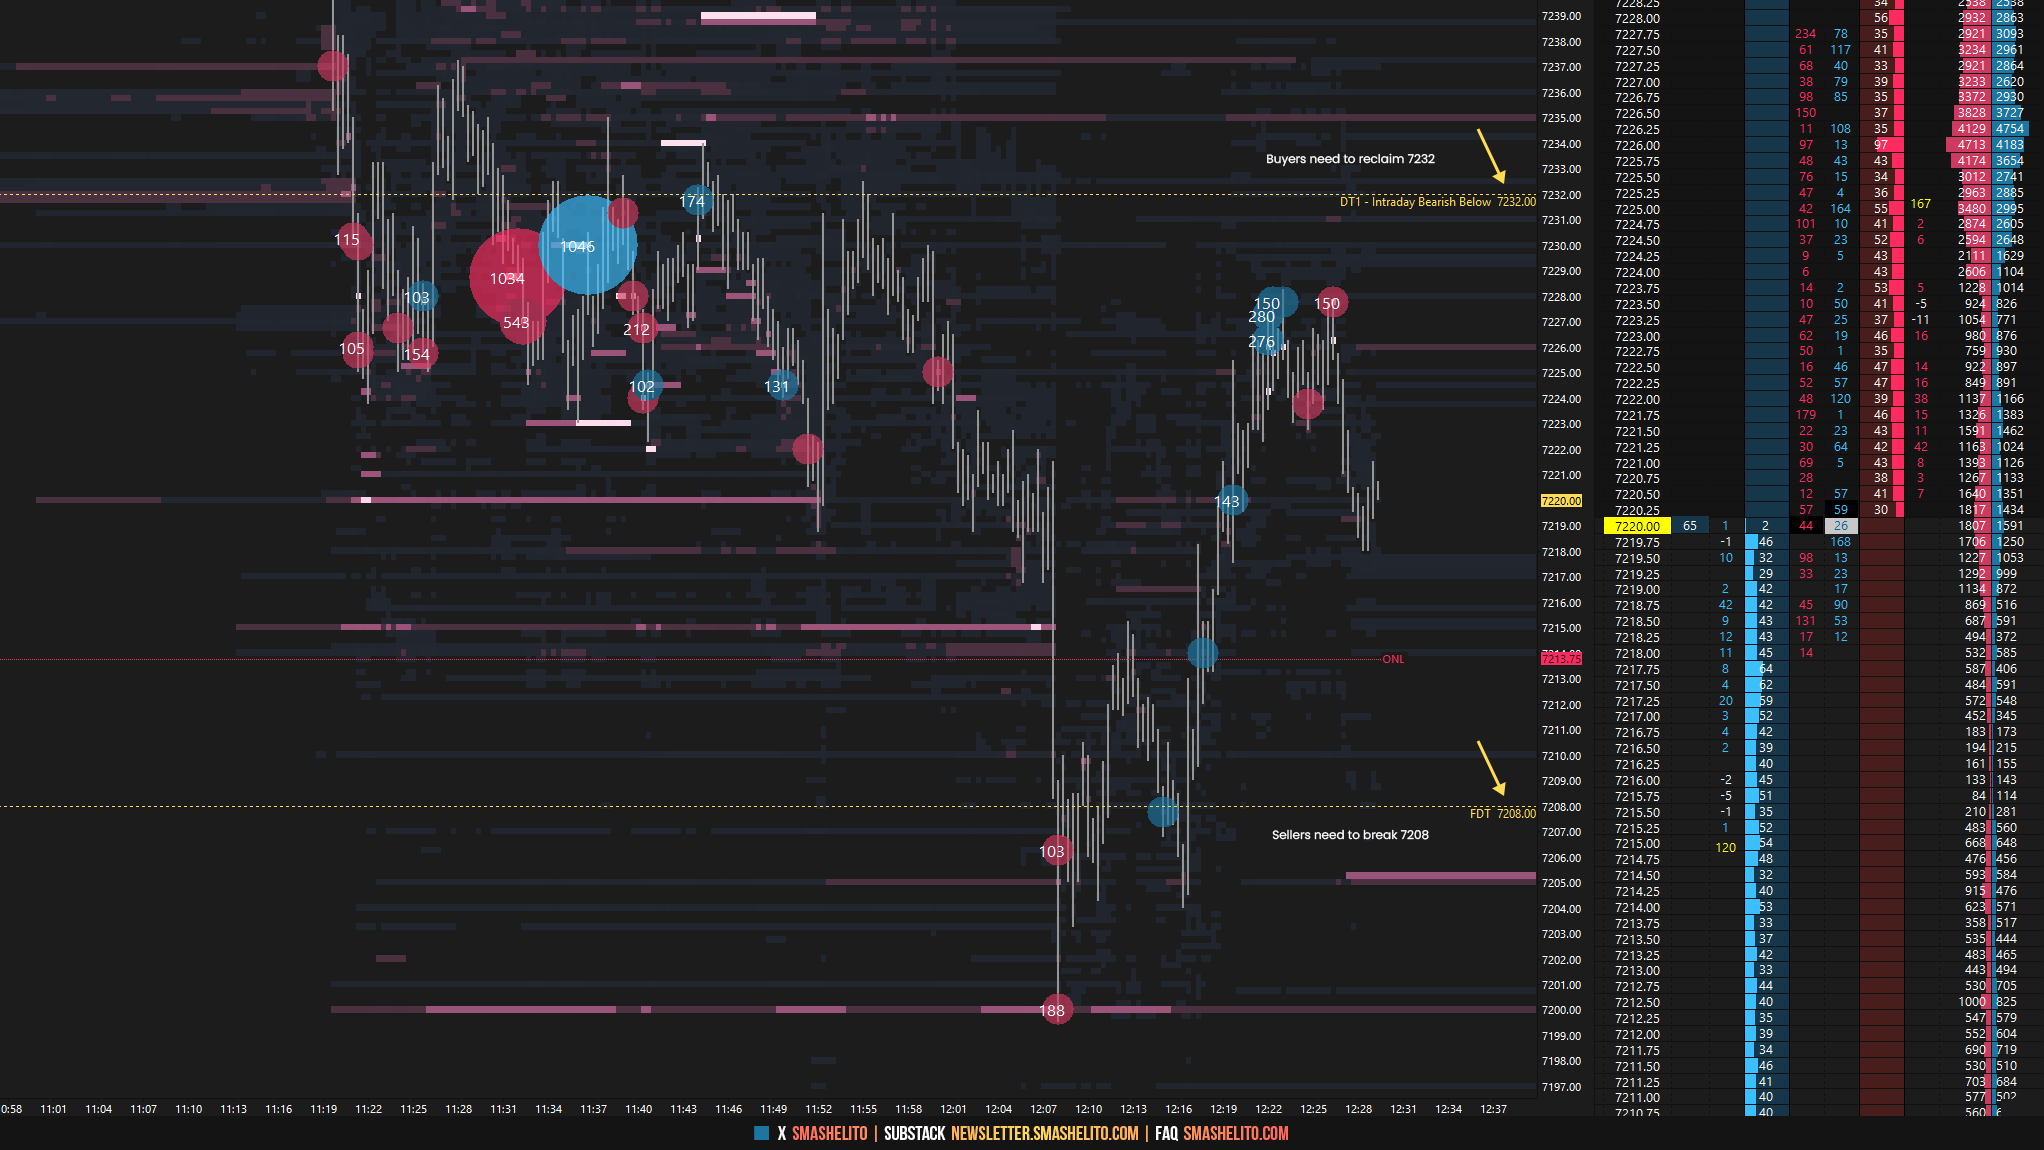
Last week kicked off with weakness on Monday, following the formation of an excess high on Friday, May 1. In the process, the poor structure down toward 7208 was fully cleaned up and the session formed a double distribution trend day.
As discussed, for sellers to shift the tone, they needed not only to negate Friday, May 1’s true gap but also to gain acceptance into the prior multi-day balance area, implying acceptance below the 7208 level. Failure to do so would likely bring in responsive buyers.
A Look Below and Fail (LBAF) at 7208 on Monday marked the low of the week (see Figure 1).
Tuesday’s session completely negated Monday’s trend day, which triggered continuation in line with the prevailing trend. The excess high from Friday, May 1, was revisited in the process.
A key principle is that in an uptrend, the best long setups often emerge after a selling effort fails to shift tone and momentum, typically leading to continuation in the direction of the trend. The same applies in reverse for a downtrend, where the best short setups emerge after a buying effort fails.
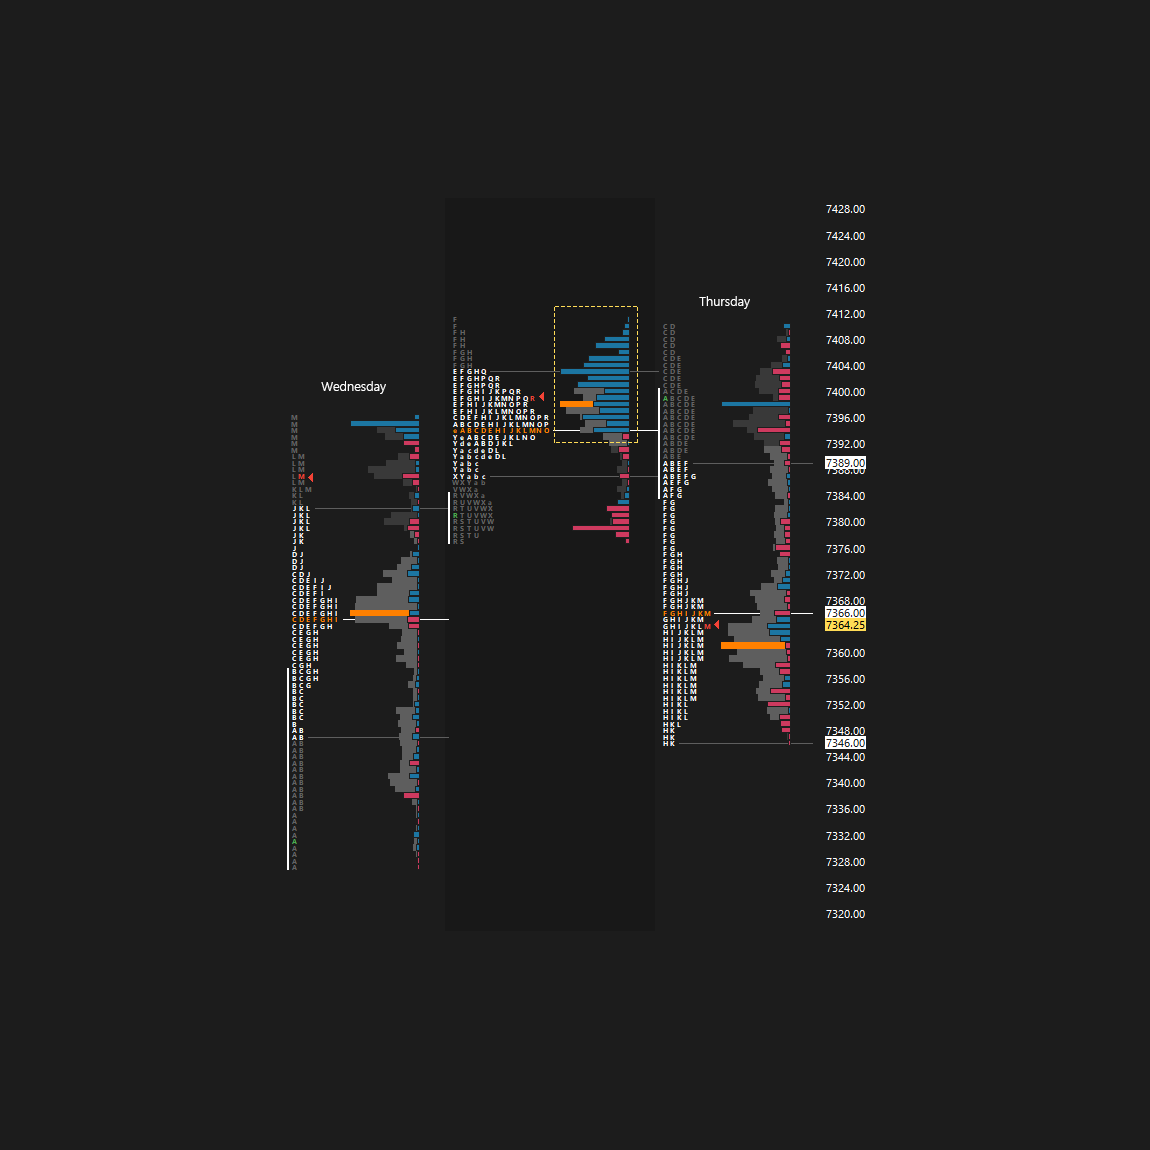
Heading into Wednesday, the daily was in balance following Monday’s session, which ended the daily one-time framing up. However, this consolidation was short-lived, as Wednesday saw a notable true gap higher. The auction came a few handles shy of the Weekly Extreme High at 7405, an area where the risk-reward profile for initiating new longs is unfavorable, especially given it was reached this early in the week.
While Thursday’s session provided a pullback from the 7405 level, following notable absorption overnight (see Figure 2), sellers were ultimately unable to do meaningful damage, failing even to take out the prior day’s low.
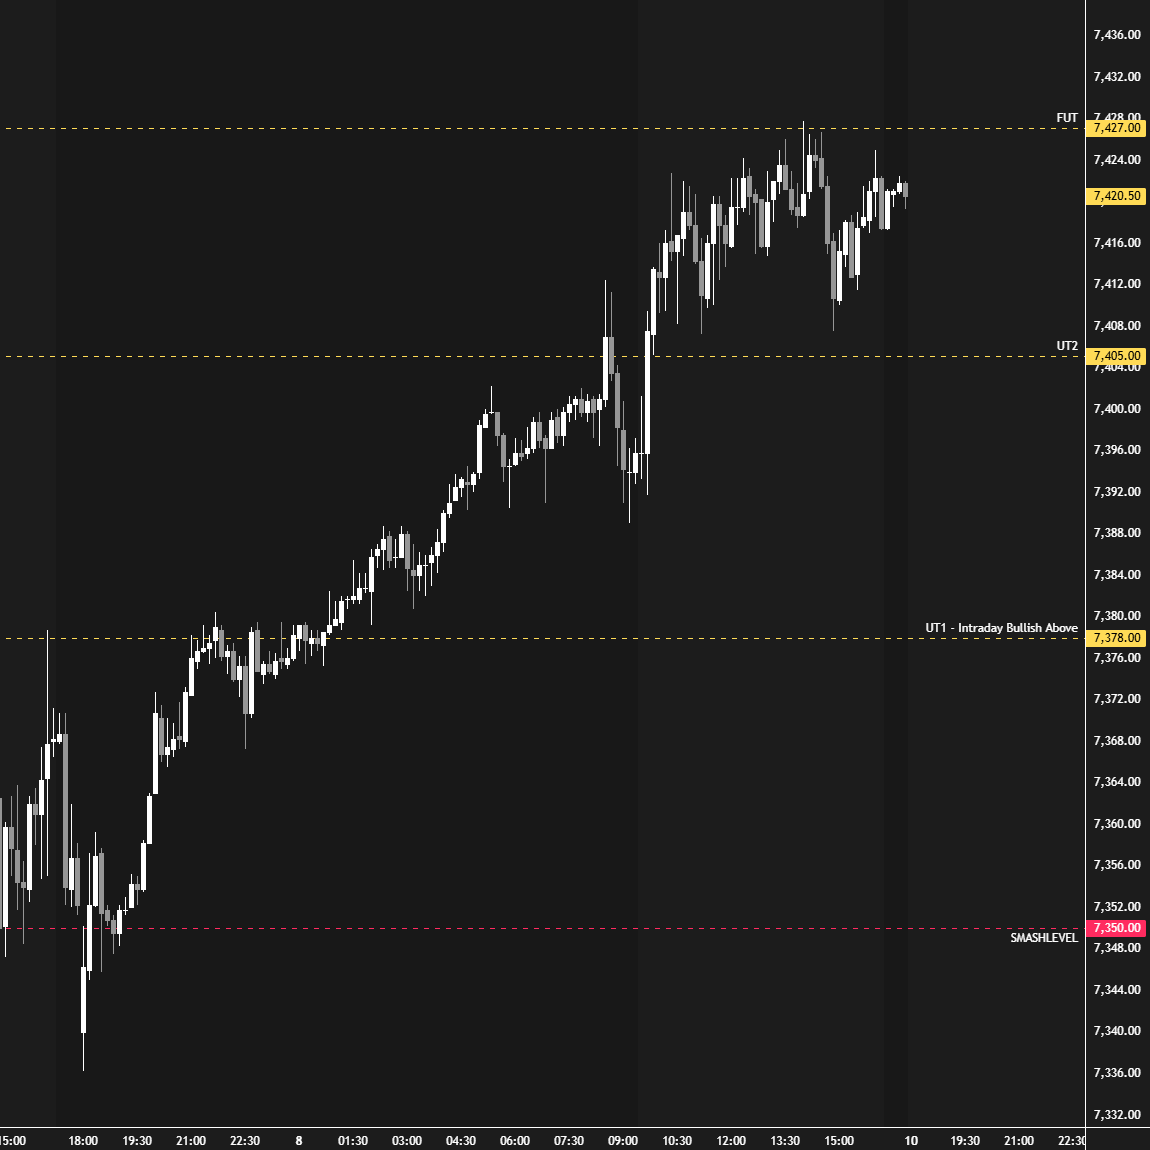
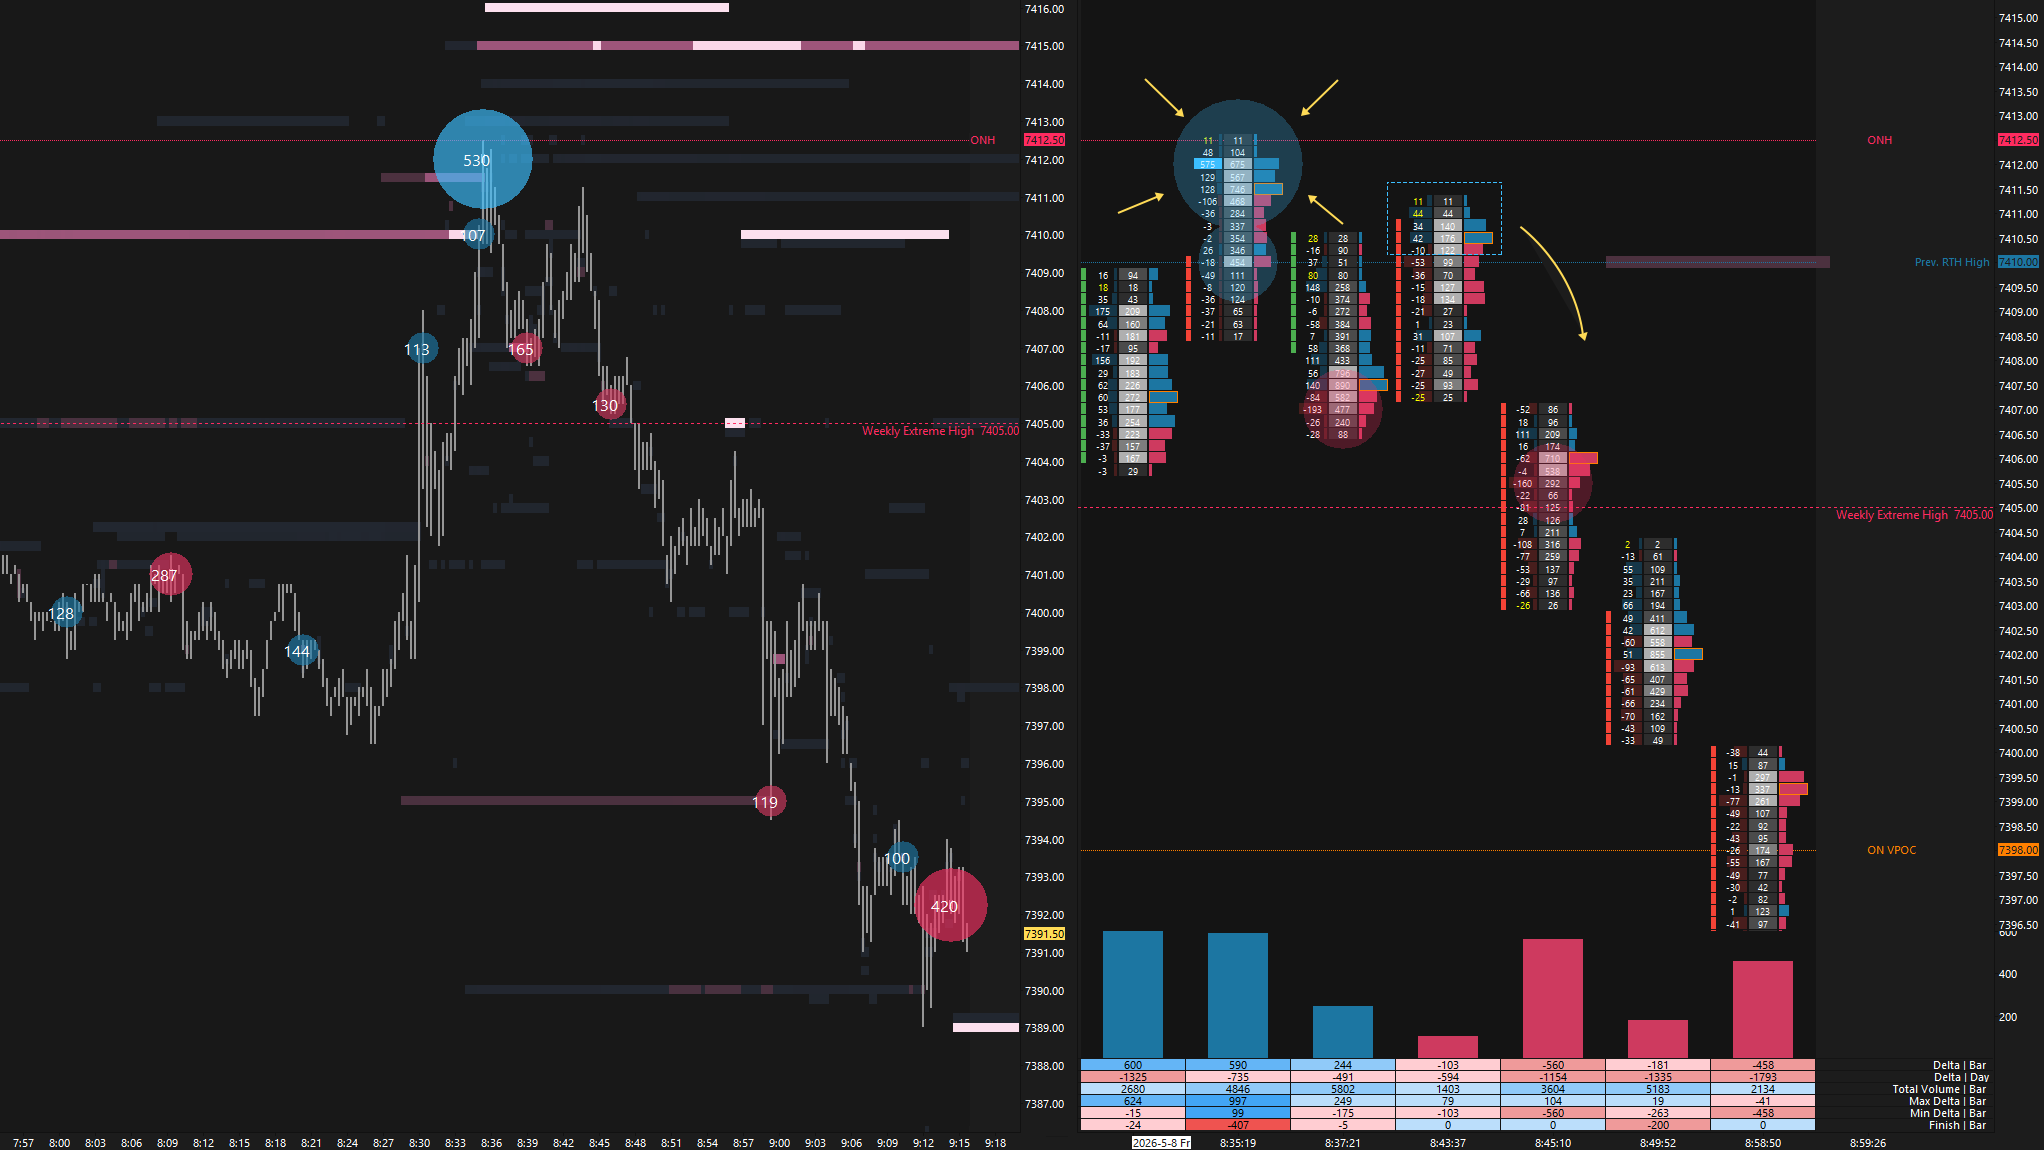
On Friday, a Look Below and Fail (LBAF) at 7350 during the overnight session, the Smashlevel (pivot), triggered a strong continuation higher that cleared all intraday upside targets into 7427 (FUT) and printed a new ATH at 7427.75 (see Figure 3). The Weekly Extreme High at 7405 provided a pullback overnight after a notable trap (see Figure 4), but it was ultimately breached during RTH.
The HTF level for NQ at 27930, outlined last week, held during Monday’s session, from which it dropped 300 handles. However, it was reclaimed on Tuesday, which helped drag ES higher, in line with our discussion last week that acceptance above 27930 could have that effect.
Price exploration higher continues relentlessly. Reminder: markets don’t become “overbought” or “oversold.” I would avoid using those terms. It’s all about whether prices are accepted or rejected. As long as higher prices are being accepted, the market can continue to move higher. Note where the weekly VPOC finished, value continues to follow price.
Last Week’s Levels in Review
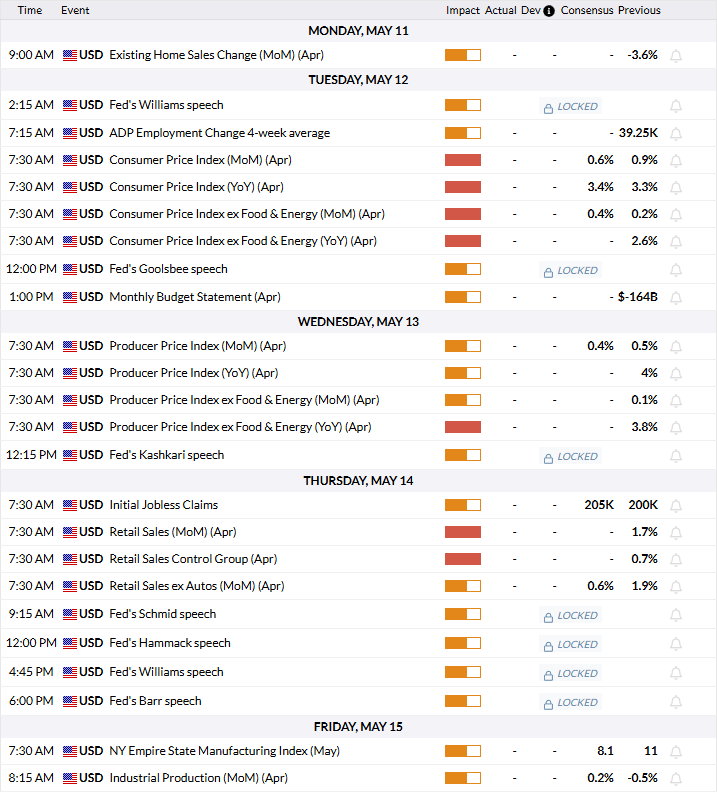
Economic & Earnings Calendar
Central Standard Time
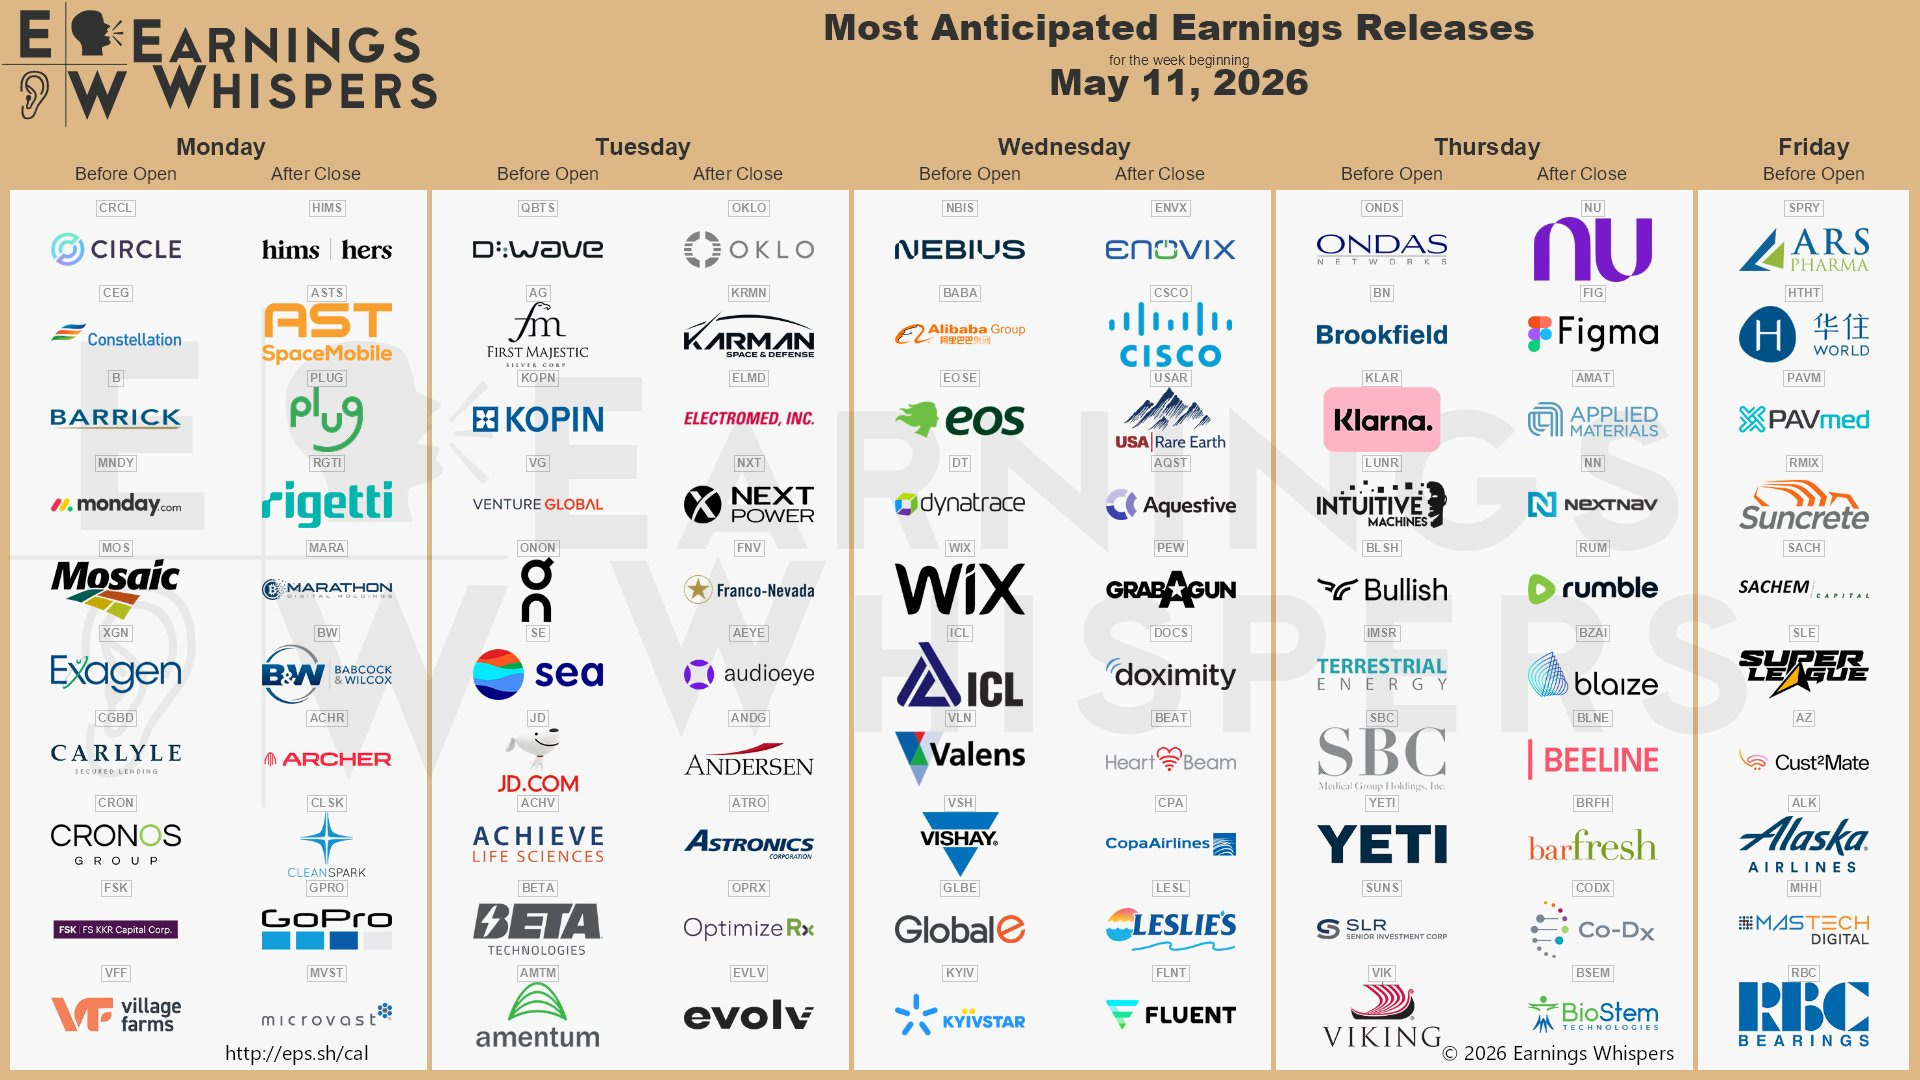
Earnings Whispers
Market Structure
🟩 Daily: OTFU → Ends at: 7391.75
🟩 Weekly: OTFU → Ends at: 7199.50
🟩 Monthly: OTFU → Ends at: 6514.25
Balance: A market condition where price consolidates within a defined range, reflecting indecision as the market awaits more market-generated information. We apply balance guidelines—favoring fade trades at range extremes (highs/lows) and preparing for breakout setups if balance resolves.
One-Time Framing Up (OTFU): A market condition where each subsequent bar forms a higher low, signaling a strong upward trend.
One-Time Framing Down (OTFD): A market condition where each subsequent bar forms a lower high, signaling a strong downward trend.
Contextual Analysis & Plan
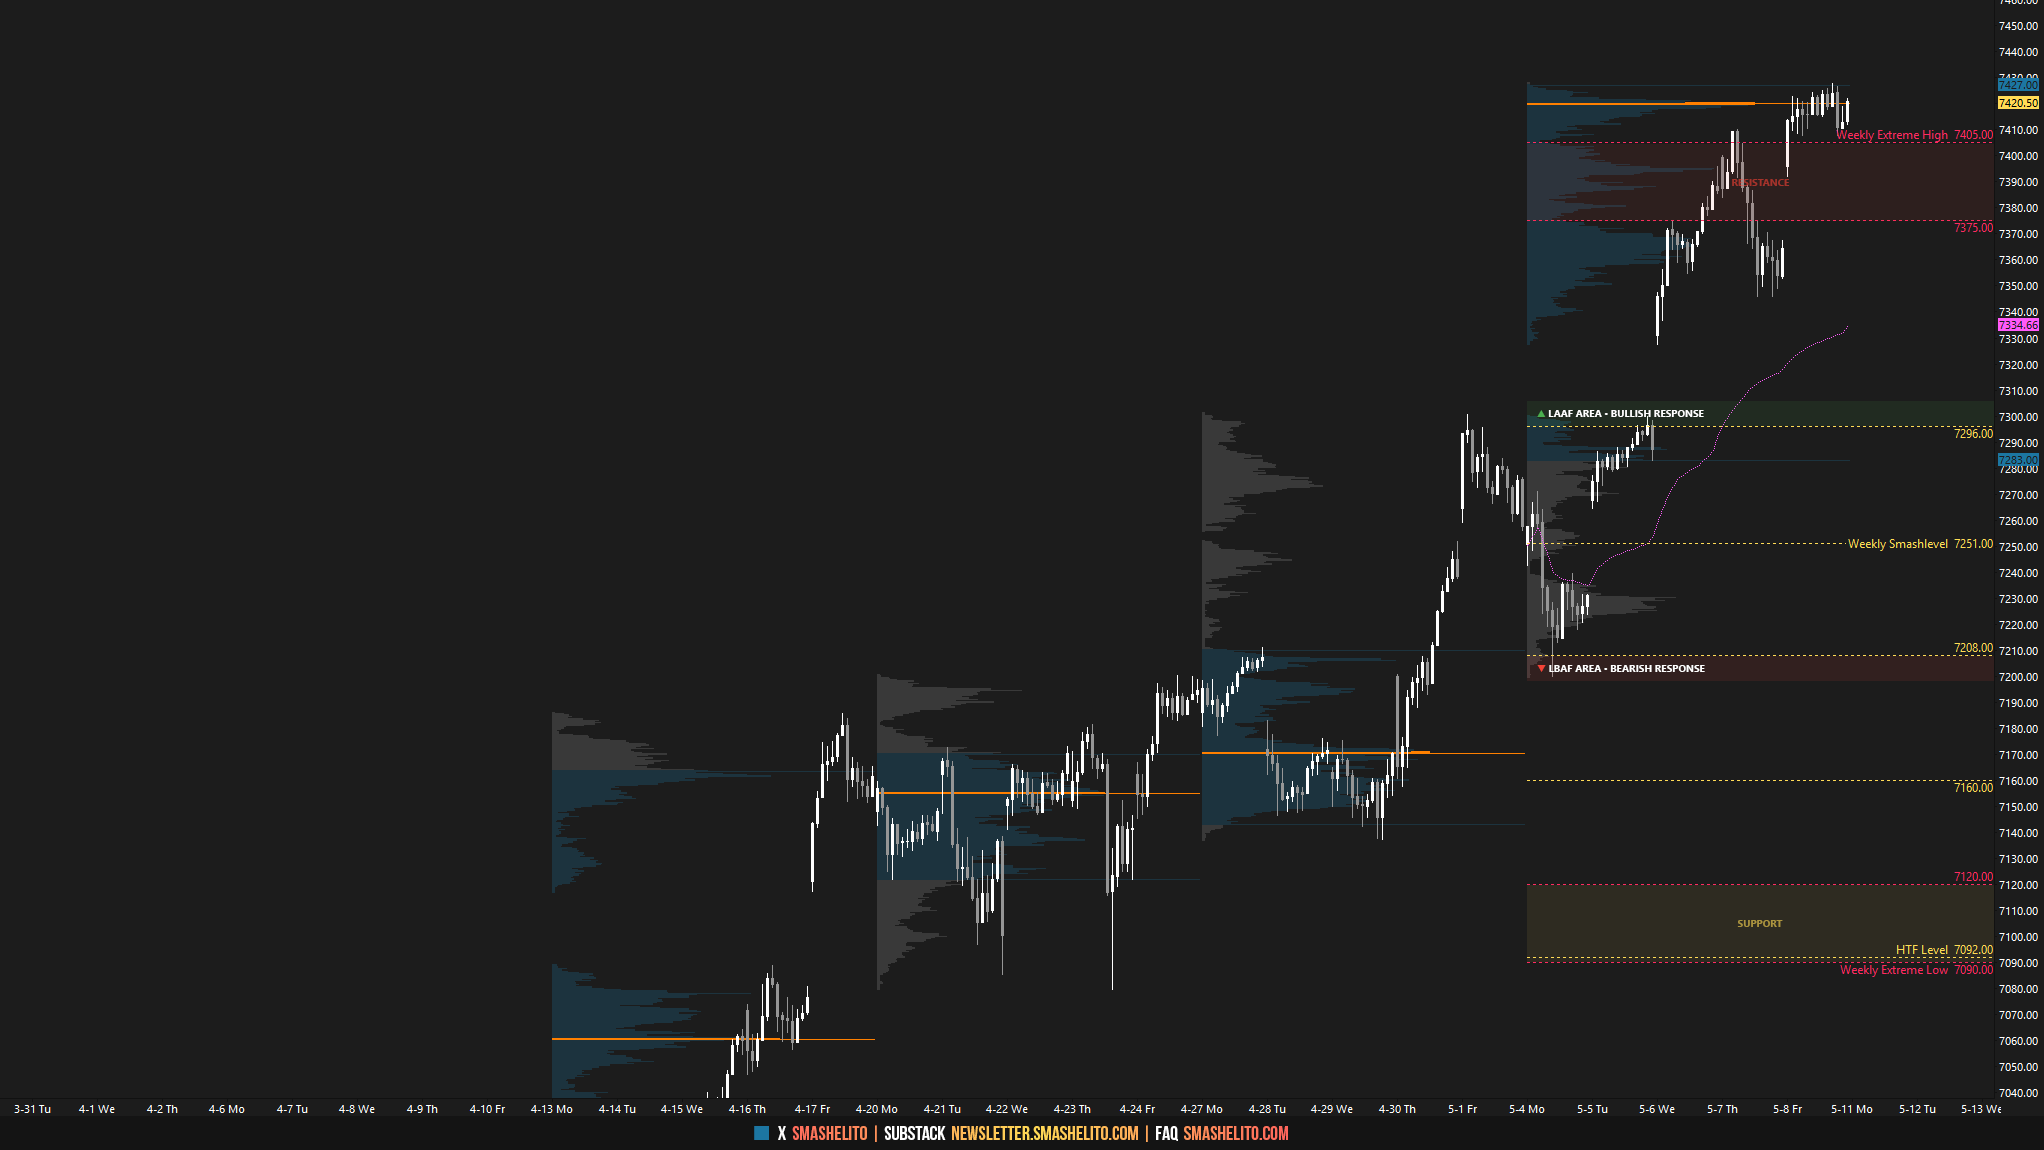
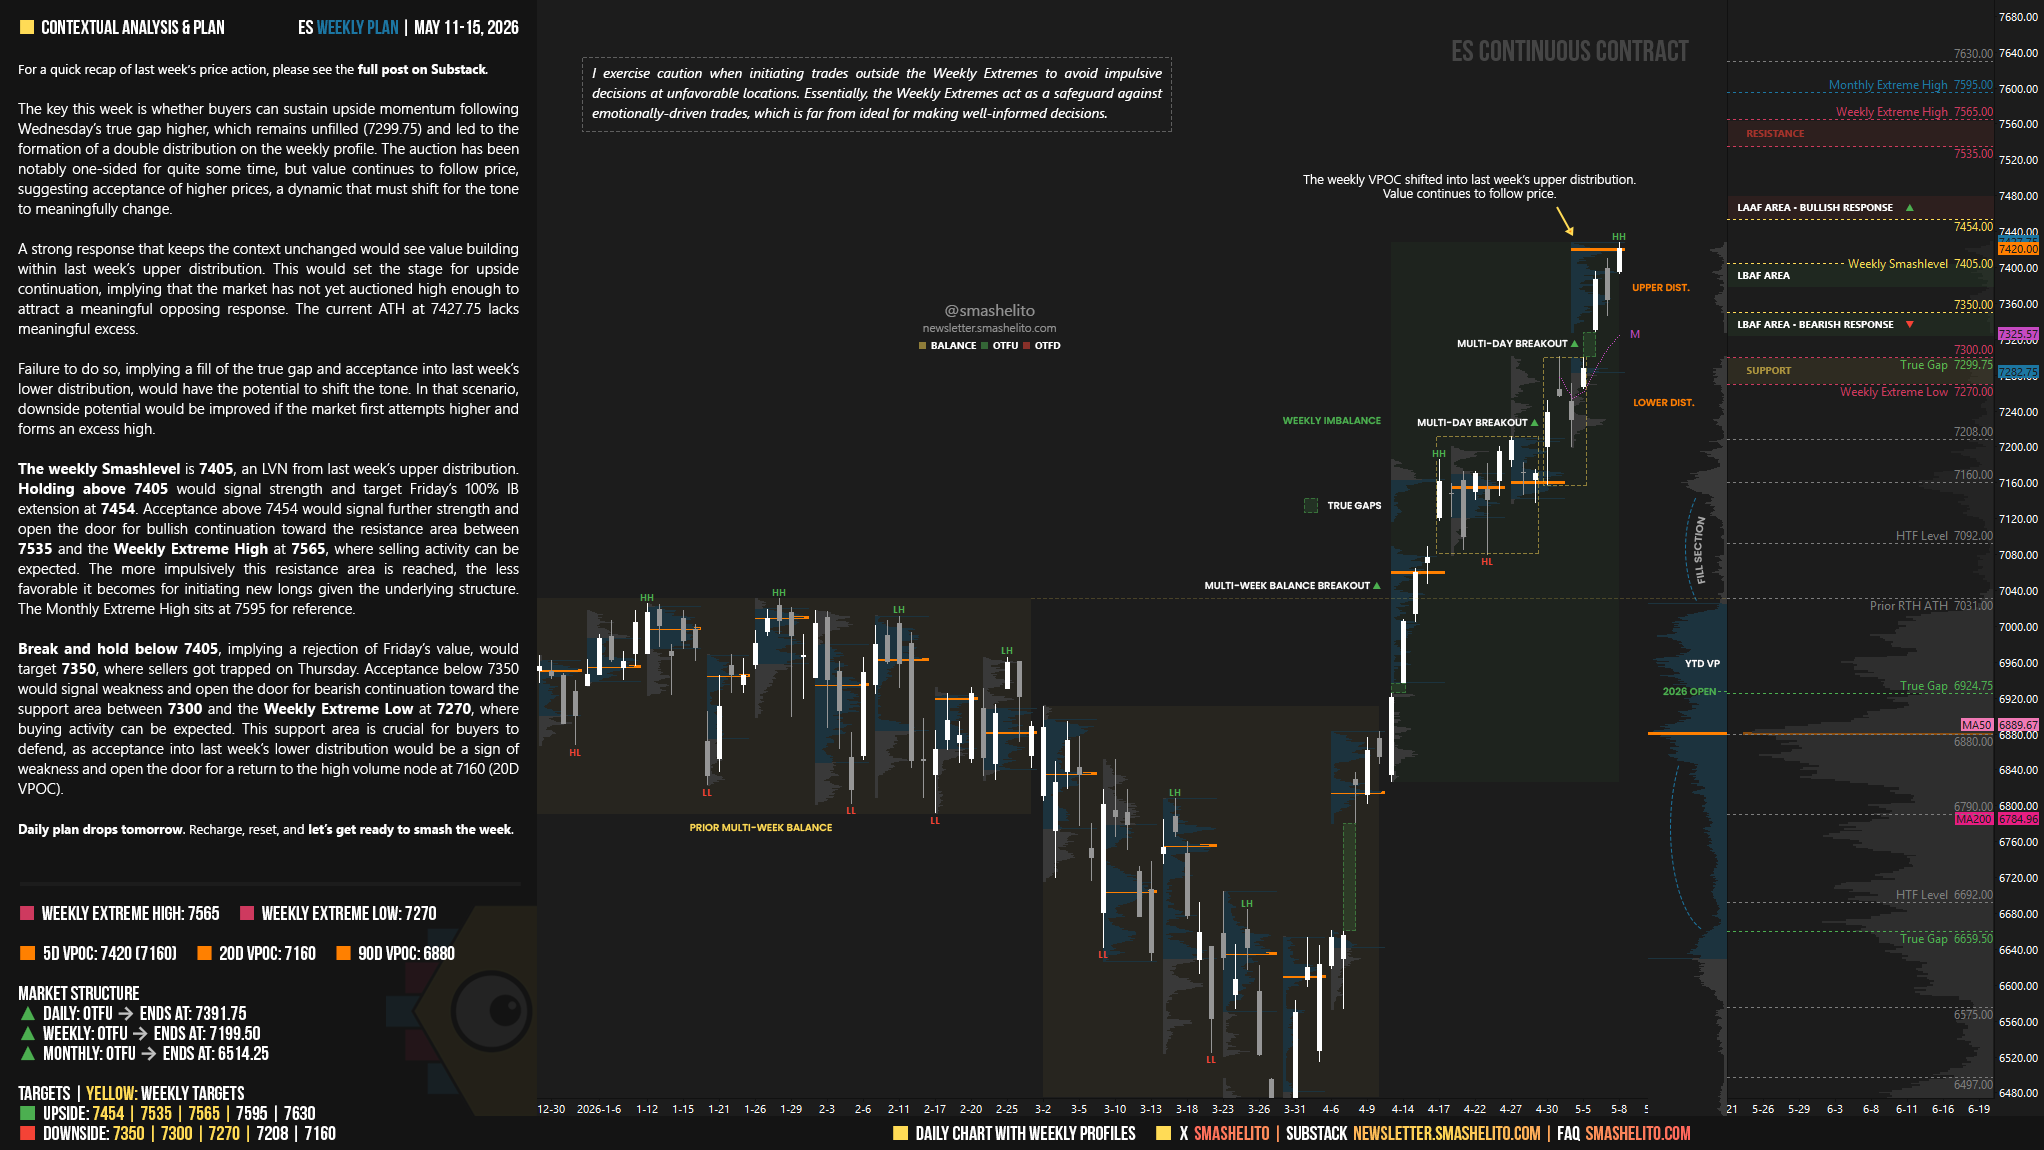
The key this week is whether buyers can sustain upside momentum following Wednesday’s true gap higher, which remains unfilled (7299.75) and led to the formation of a double distribution on the weekly profile. The auction has been notably one-sided for quite some time, but value continues to follow price, suggesting acceptance of higher prices, a dynamic that must shift for the tone to meaningfully change.
A strong response that keeps the context unchanged would see value building within last week’s upper distribution. This would set the stage for upside continuation, implying that the market has not yet auctioned high enough to attract a meaningful opposing response. The current ATH at 7427.75 lacks meaningful excess.
Failure to do so, implying a fill of the true gap and acceptance into last week’s lower distribution, would have the potential to shift the tone. In that scenario, downside potential would be improved if the market first attempts higher and forms an excess high.
The weekly Smashlevel is 7405, an LVN from last week’s upper distribution. Holding above 7405 would signal strength and target Friday’s 100% IB extension at 7454. Acceptance above 7454 would signal further strength and open the door for bullish continuation toward the resistance area between 7535 and the Weekly Extreme High at 7565, where selling activity can be expected. The more impulsively this resistance area is reached, the less favorable it becomes for initiating new longs given the underlying structure. The Monthly Extreme High sits at 7595 for reference.
Break and hold below 7405, implying a rejection of Friday’s value, would target 7350, where sellers got trapped on Thursday. Acceptance below 7350 would signal weakness and open the door for bearish continuation toward the support area between 7300 and the Weekly Extreme Low at 7270, where buying activity can be expected. This support area is crucial for buyers to defend, as acceptance into last week’s lower distribution would be a sign of weakness and open the door for a return to the high volume node at 7160 (20D VPOC).
Visual Representation
Key Levels of Interest
In the upcoming week, I will closely observe the behavior around 7405.
Holding above 7405 would target 7454 / 7535 / 7565* / 7595 / 7630
Break and hold below 7405 would target 7350 / 7300 / 7270* / 7208 / 7160
*Weekly Extremes (defined by proprietary models). I exercise caution when initiating trades outside the Weekly Extremes to avoid impulsive decisions at unfavorable locations. Essentially, the Weekly Extremes act as a safeguard against emotionally-driven trades, which is far from ideal for making well-informed decisions.
Daily plan drops tomorrow. Recharge, reset, and let’s get ready to smash the week.
Professional insightful great structured you do a great job thank you It really helps.
Thank you for these detailed plans, I really appreciate the work behind each one of them, have a great week.