ES Weekly Plan | March 24-28, 2025
Key Levels & Market Context for the Upcoming Week.
Economic Calendar
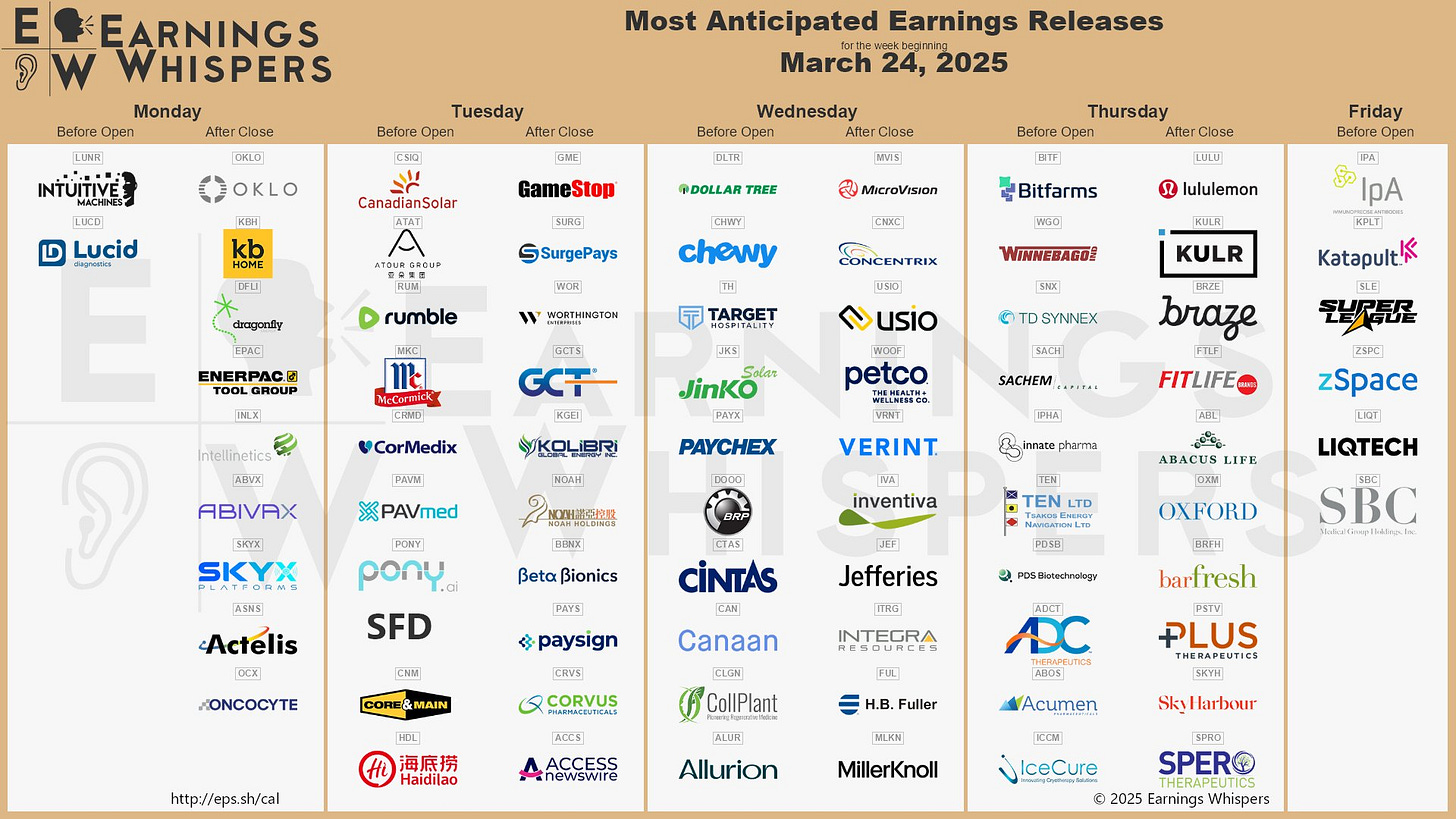
Earnings Calendar
Visual Representation
Market Structure
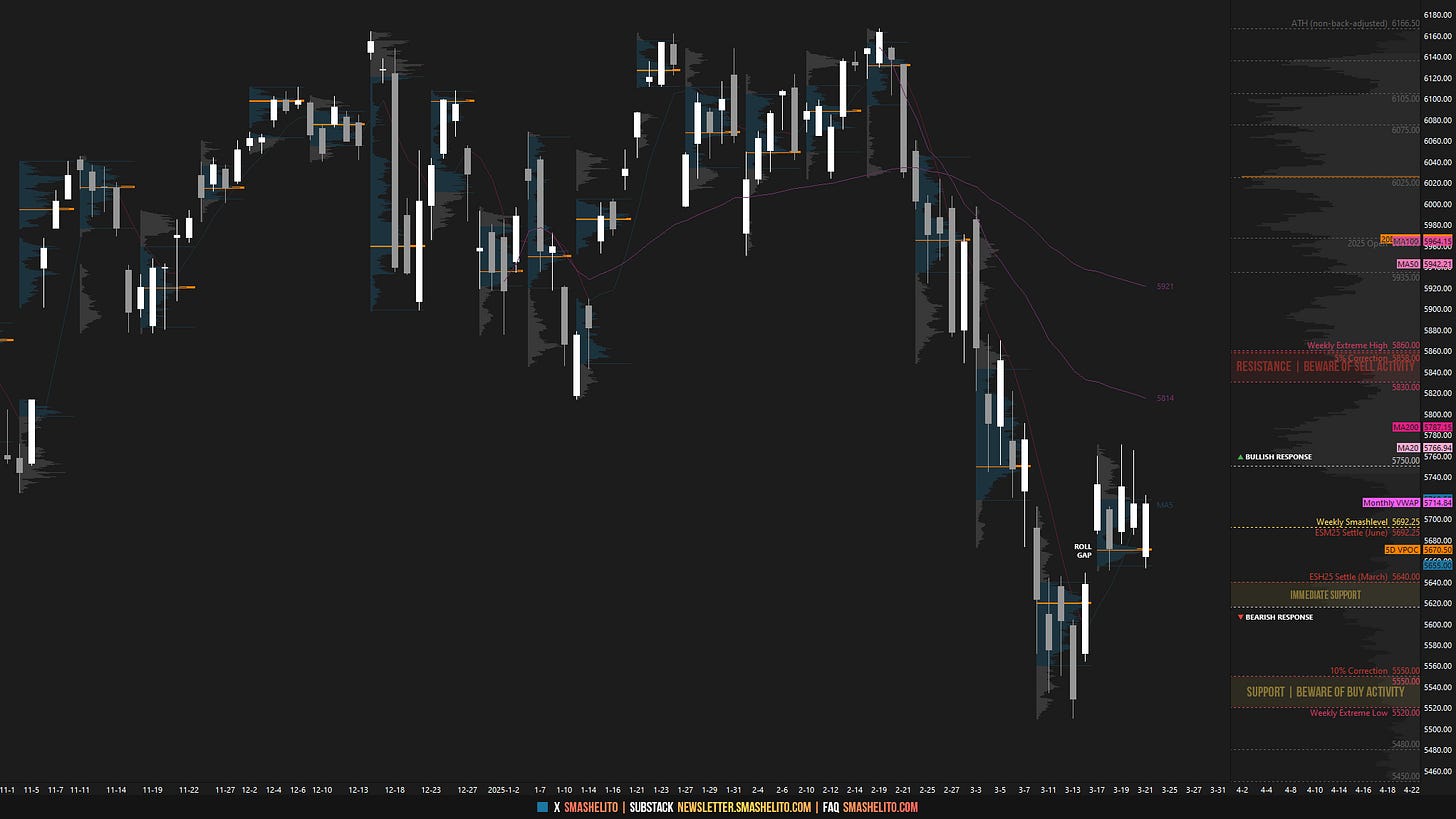
🟨 DAILY: BALANCE | 5D | 5770.50-5650.75
🟨 WEEKLY: BALANCE | 2W | 5770.50-5509.25
🟨 MONTHLY: BALANCE | TBD
FYI: The one-time framing and balance concept becomes temporarily skewed during contract rollover due to the roll gap. I don’t back-adjust my charts.
Contract Rollover
Last week, I switched to the ESM25 (June) contract. My charts are not back-adjusted, meaning historical prices remain unchanged, which can lead to differences when compared to back-adjusted charts. This choice comes down to personal preference—neither method is inherently better, as each has its own strengths and weaknesses. For short-term traders, the impact is minimal since we navigate the market day-to-day, and my weekly targets remain the same regardless of the method used.
Contextual Analysis
During the previous week, the focus was on navigating the market cautiously, given key economic events, contract rollover, and options expiration (OPEX). This approach aligned with the price action, which featured tricky two-sided activity. For the first time in weeks, sellers struggled to gain downside traction, resulting in a weak low on Friday. However, the upside was capped by the initial weekly target at 5750. The market is now in a short-term balance, and a break from this range will determine its next direction. Balance guidelines apply.

For this week, the main focus will be on the current 5-day balance area between 5770 and 5650, where responsive two-sided activity has emerged after several weeks of sustained downside pressure. The key question now is whether a short-term bottom has formed following a 10% correction from the all-time high, or if last week's activity simply provided sellers with a chance to reload at higher prices. When the market is in balance, we apply the balance guidelines as a framework: trade in the direction of a breakout from the balance area and monitor for continuation or a lack of it. A failed breakout with no follow-through often sets up favorable trade opportunities in the opposite direction.
The weekly Smashlevel is 5725, representing a low volume node (LVN). Break and hold above 5725 would target the previous week’s high at 5770. Acceptance above 5770 signals strength, targeting the resistance area from 5835 to the Weekly Extreme High of 5865, where selling activity can be expected.
Holding below 5725 would target the previous week’s value support at 5655. Acceptance below 5655 signals weakness, targeting the support area from 5580 to the Weekly Extreme Low of 5550, where buying activity can be expected. Generally, acceptance back within the value from two weeks ago is considered a bearish development, putting last week's buyers—who bet the bottom was in—in a tricky spot.
As usual, a detailed daily plan will be published tomorrow. In the meantime, enjoy the rest of your weekend!
Levels of Interest
In the upcoming week, I will closely observe the behavior around 5725.
Break and hold above 5725 would target 5770 / 5835 / 5865* / 5935 / 5967
Holding below 5725 would target 5655 / 5580 / 5550* / 5520 / 5480
*Weekly Extremes. I exercise caution when initiating trades outside the Weekly Extremes to avoid making impulsive decisions at unfavorable locations. Essentially, the Weekly Extremes serve as a safeguard against emotionally-driven trades, a state that is less than ideal for making well-informed trading decisions.


Great analasys! Thanks Smash.
Thanks Smash!