ES Weekly Plan | March 17-21, 2025
Key Levels & Market Context for the Upcoming Week.
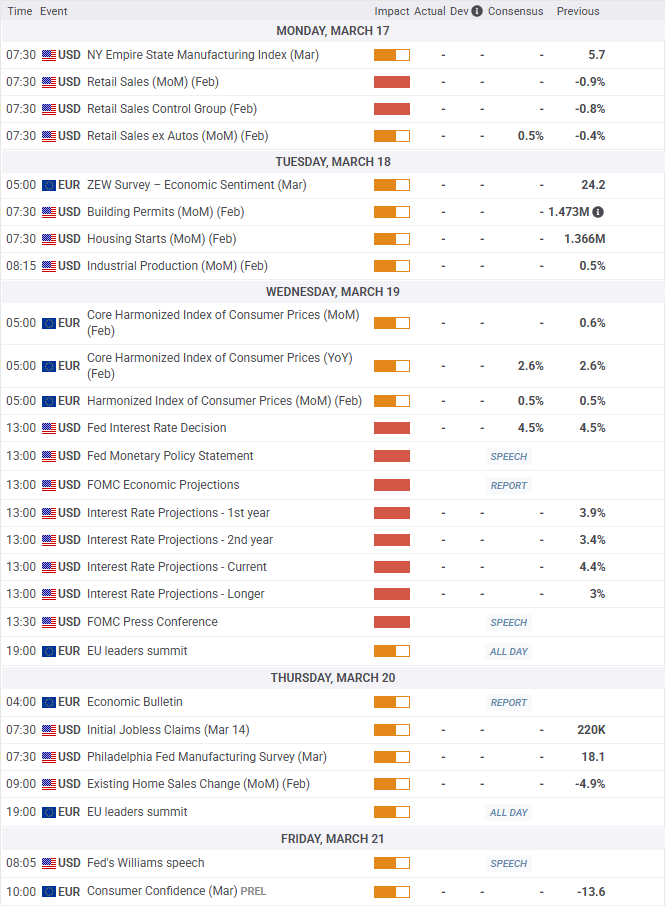
Economic Calendar
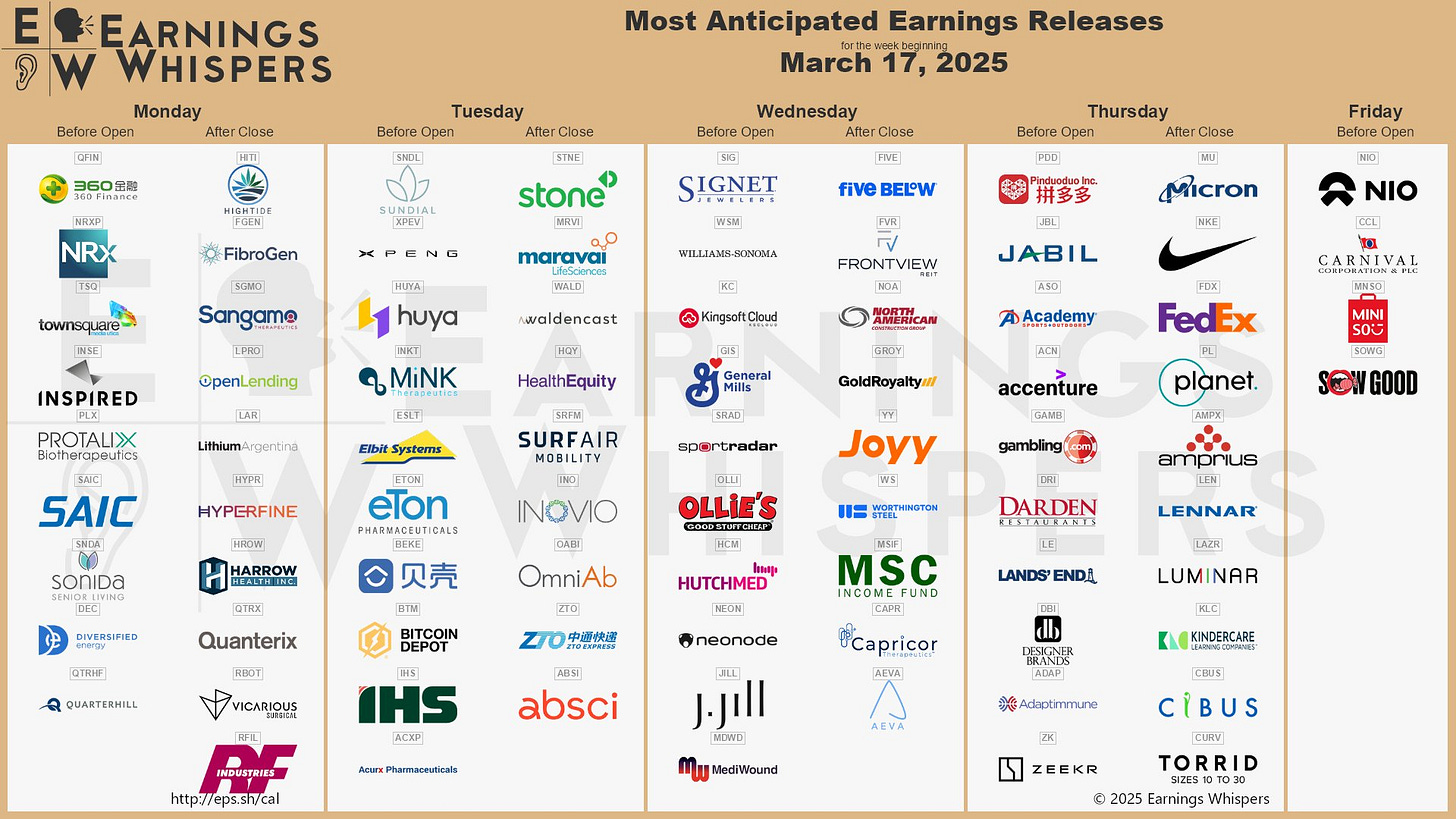
Earnings Calendar
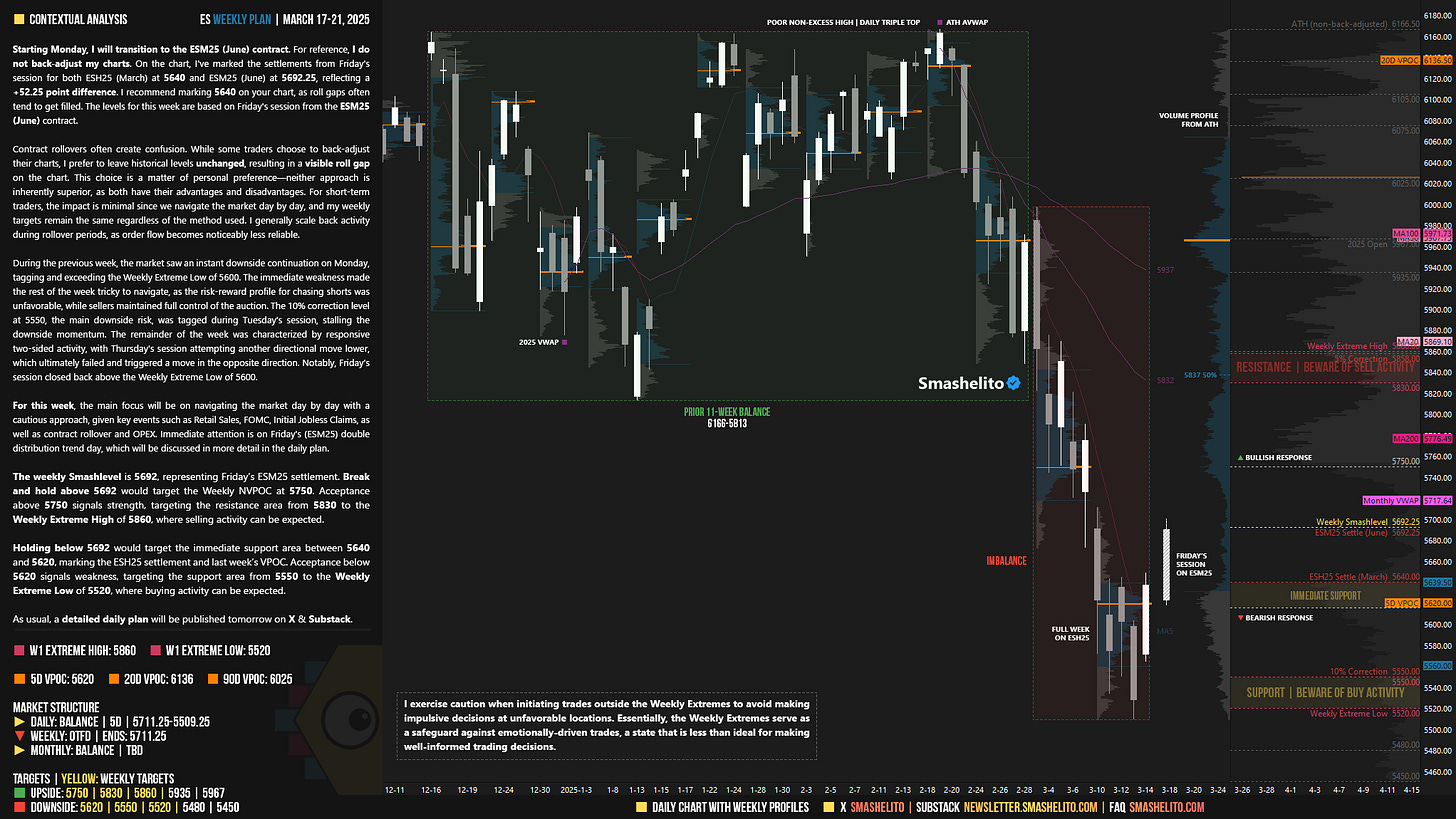
Visual Representation
Market Structure
🟨 DAILY: BALANCE | 5D | 5711.25-5509.25
🟥 WEEKLY: OTFD | Ends: 5711.25
🟨 MONTHLY: BALANCE | TBD
FYI: The one-time framing and balance concept becomes temporarily skewed during contract rollover due to the roll gap. I don’t back-adjust my charts.
Contract Rollover
Starting Monday, I will transition to the ESM25 (June) contract. For reference, I do not back-adjust my charts. On the chart, I've marked the settlements from Friday's session for both ESH25 (March) at 5640 and ESM25 (June) at 5692.25, reflecting a +52.25 point difference. I recommend marking 5640 on your chart, as roll gaps often tend to get filled. The levels for this week are based on Friday's session from the ESM25 (June) contract.
Contract rollovers often create confusion. While some traders choose to back-adjust their charts, I prefer to leave historical levels unchanged, resulting in a visible roll gap on the chart. This choice is a matter of personal preference—neither approach is inherently superior, as both have their advantages and disadvantages. For short-term traders, the impact is minimal since we navigate the market day by day, and my weekly targets remain the same regardless of the method used. I generally scale back activity during rollover periods, as order flow becomes noticeably less reliable.
Contextual Analysis
During the previous week, the market saw an instant downside continuation on Monday, tagging and exceeding the Weekly Extreme Low of 5600. The immediate weakness made the rest of the week tricky to navigate, as the risk-reward profile for chasing shorts was unfavorable, while sellers maintained full control of the auction. The 10% correction level at 5550, the main downside risk, was tagged during Tuesday's session, stalling the downside momentum. The remainder of the week was characterized by responsive two-sided activity, with Thursday's session attempting another directional move lower, which ultimately failed and triggered a move in the opposite direction. Notably, Friday’s session closed back above the Weekly Extreme Low of 5600.

For this week, the main focus will be on navigating the market day by day with a cautious approach, given key events such as Retail Sales, FOMC, Initial Jobless Claims, as well as contract rollover and OPEX. Immediate attention is on Friday's (ESM25) double distribution trend day, which will be discussed in more detail in the daily plan.
The weekly Smashlevel is 5692, representing Friday’s ESM25 settlement. Break and hold above 5692 would target the Weekly NVPOC at 5750. Acceptance above 5750 signals strength, targeting the resistance area from 5830 to the Weekly Extreme High of 5860, where selling activity can be expected.
Holding below 5692 would target the immediate support area between 5640 and 5620, marking the ESH25 settlement and last week’s VPOC. Acceptance below 5620 signals weakness, targeting the support area from 5550 to the Weekly Extreme Low of 5520, where buying activity can be expected.
As usual, a detailed daily plan will be published tomorrow. In the meantime, enjoy the rest of your weekend!
Levels of Interest
In the upcoming week, I will closely observe the behavior around 5692.
Break and hold above 5692 would target 5750 / 5830 / 5860* / 5935 / 5967
Holding below 5692 would target 5620 / 5550 / 5520* / 5480 / 5450
*Weekly Extremes. I exercise caution when initiating trades outside the Weekly Extremes to avoid making impulsive decisions at unfavorable locations. Essentially, the Weekly Extremes serve as a safeguard against emotionally-driven trades, a state that is less than ideal for making well-informed trading decisions.


Thank you Smash! Rollover sucks!
Gracias! 😊