
ES Weekly Plan | March 2-6, 2026
Recap, Market Context & Key Levels for the Week Ahead

Welcome to this week’s plan. Inside, you’ll find a quick review of last week’s price action, key economic events, market structure, context for the week ahead, and the levels I’ll be focusing on. Let’s get prepared.
Contents
Last Week in Review
Economic & Earnings Calendar
Market Structure
Contextual Analysis & Plan
Key Levels of Interest
Last Week in Review
Last week’s plan:

Last week, the market kicked off on Monday with a liquidation break after failing to hold above 6927, the 2026 opening price. Going into Tuesday’s session, the key question was whether sellers could trigger a downside continuation, or if the lack of follow-through would instead lead to a cleanup of the poor structure left behind on Monday. Tuesday’s session looked below Monday’s low and failed, triggering a sharp counter-move that ultimately cleaned up Monday’s poor structure.
Change took place on Wednesday, as the auction attempted to move price away from an area of value established over the past sessions following a true gap up. In the process, the poor structure from the February 12 trend day was cleaned up, with the market testing the breakdown single prints at 6960. This was clearly a significant level, and it was marked as the weekly Smashlevel. The focus then shifted to how effectively the auction could accept and build value above 6960, which would signal a strong market response.
Wednesday’s attempt to shift the tone by moving away from short-term value failed decisively on Thursday, with sellers active at the 6960 level. Wednesday’s true gap was effectively filled in the process, as the market returned to the established value area. The session formed a double distribution trend day, with one set of single prints notably aligned with the 6927 level.
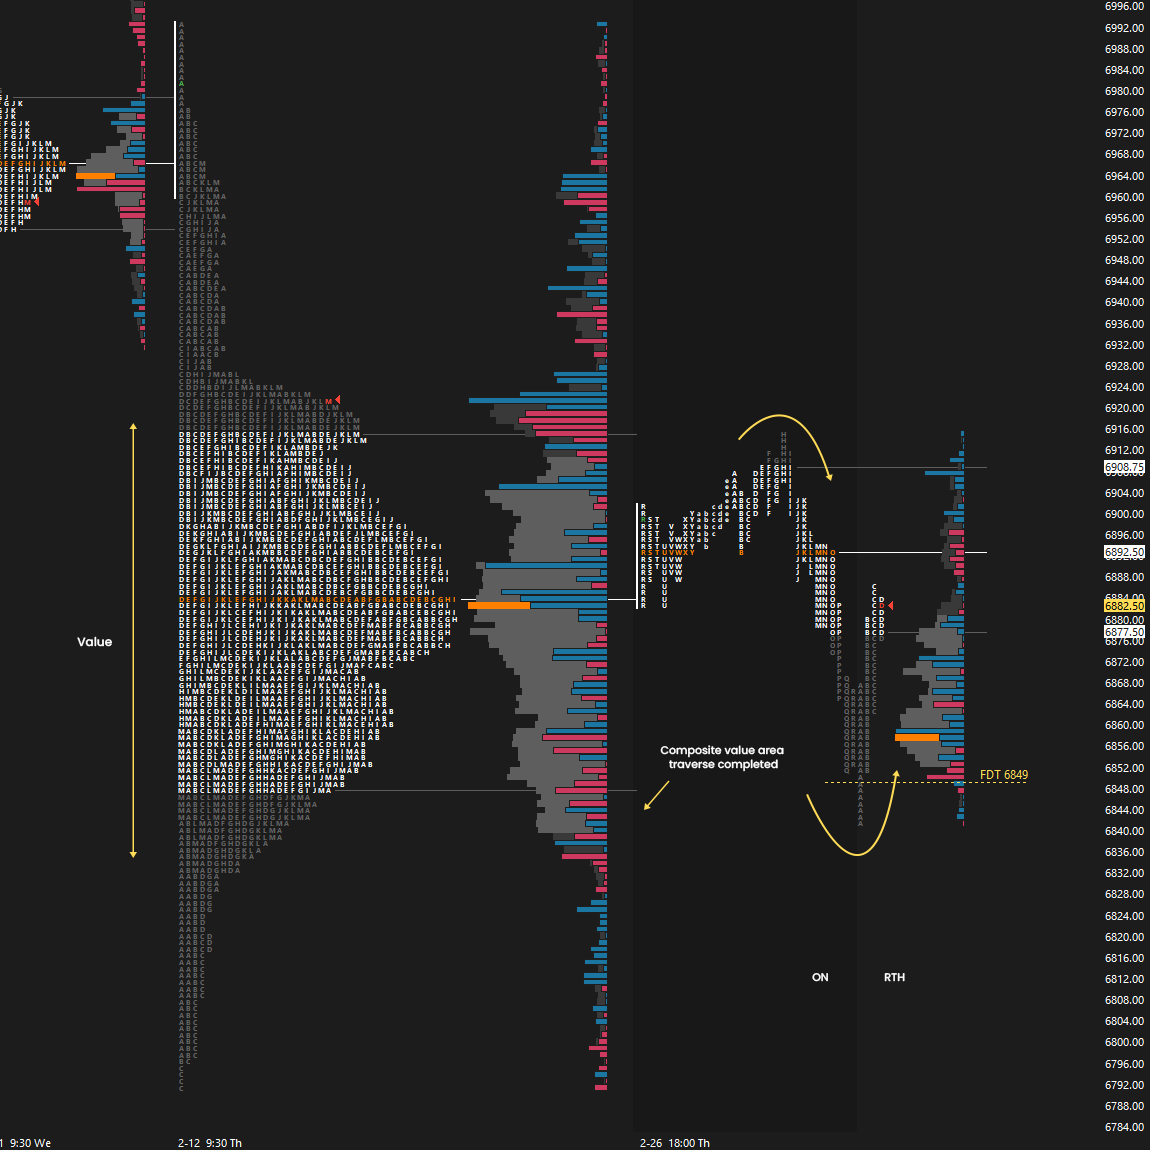
In Friday’s plan, we discussed that if buyers could not quickly reclaim the 6927 level and essentially negate Thursday’s trend day, the odds would increase that the value area from the composite profile created by merging the recent sessions would be traversed. A full traverse was achieved, with the market tagging Fridays’s Final Downside Target at 6849, from which it then rallied roughly 40 handles (see Figure 1). Contextual awareness and trade location is king.
Last Week’s Levels in Review
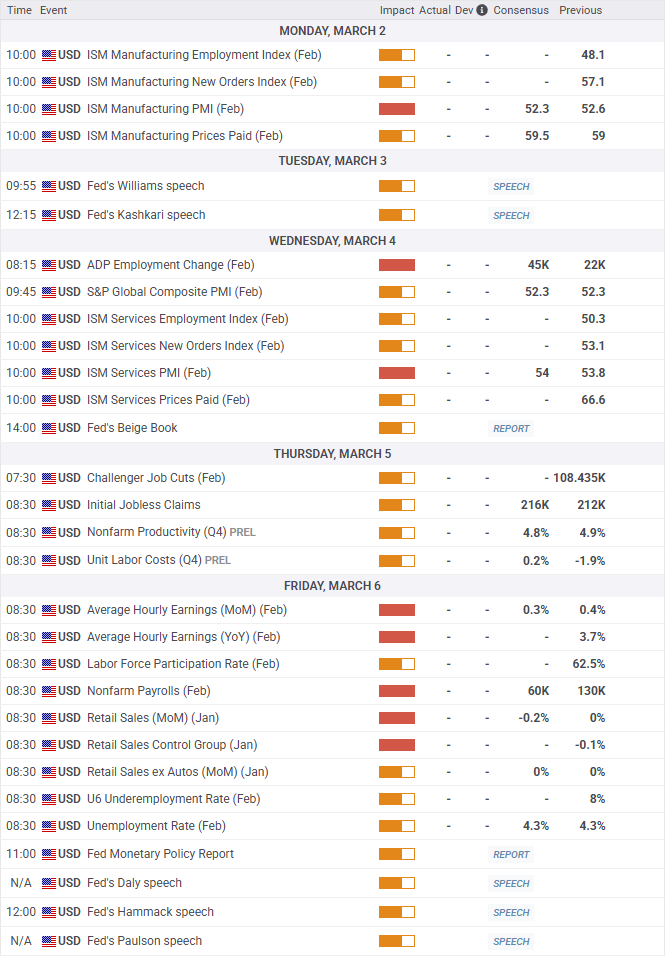
Economic & Earnings Calendar
Central Standard Time
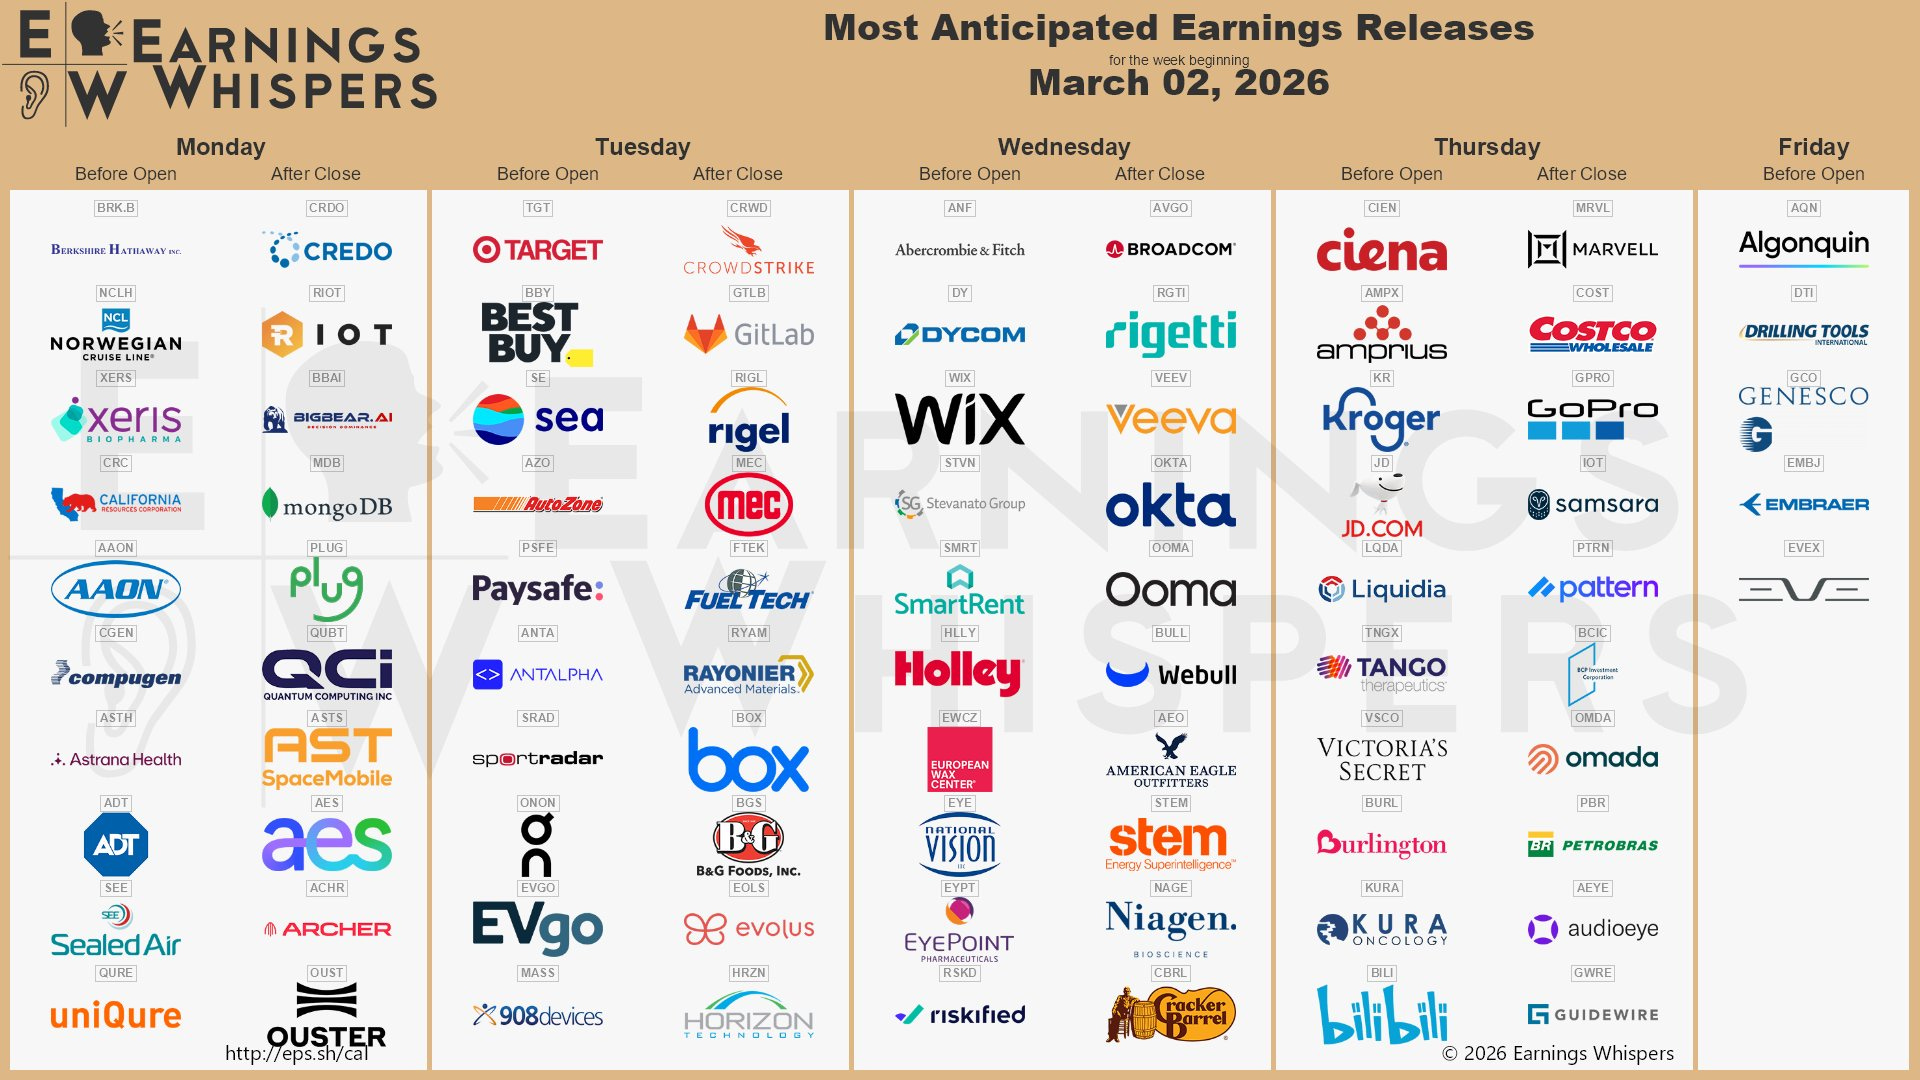
Earnings Whispers
Market Structure
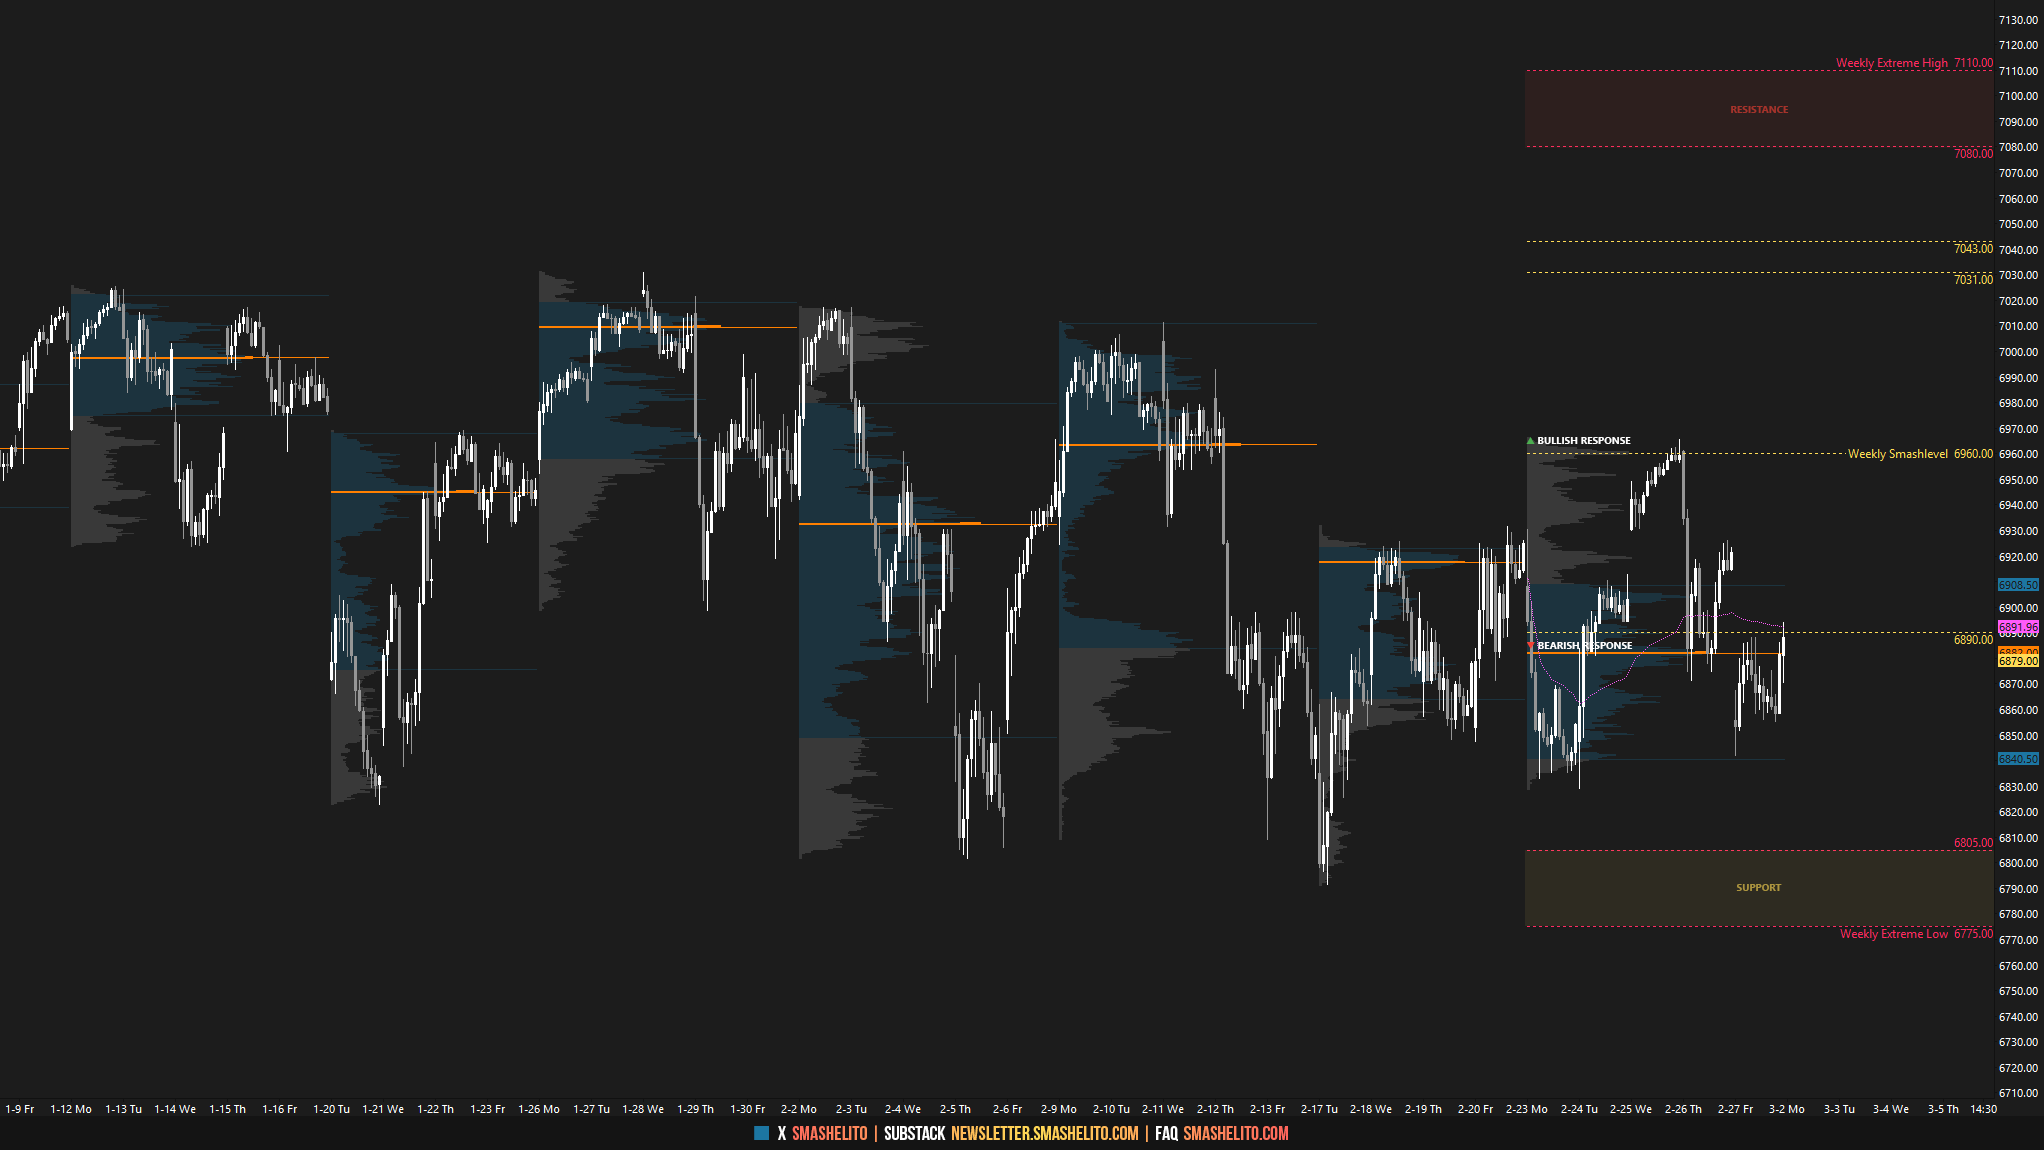
🟨 Daily: BALANCE → 8-day → High: 6965.75 / Low: 6828.50
🟨 Weekly: BALANCE → 10-week → High: 7031 / Low: 6791
🟨 Monthly: BALANCE → 3-month → High: 7031 / Low: 6775.50
Balance: A market condition where price consolidates within a defined range, reflecting indecision as the market awaits more market-generated information. We apply balance guidelines—favoring fade trades at range extremes (highs/lows) and preparing for breakout setups if balance resolves.
One-Time Framing Up (OTFU): A market condition where each subsequent bar forms a higher low, signaling a strong upward trend.
One-Time Framing Down (OTFD): A market condition where each subsequent bar forms a lower high, signaling a strong downward trend.
Contextual Analysis & Plan
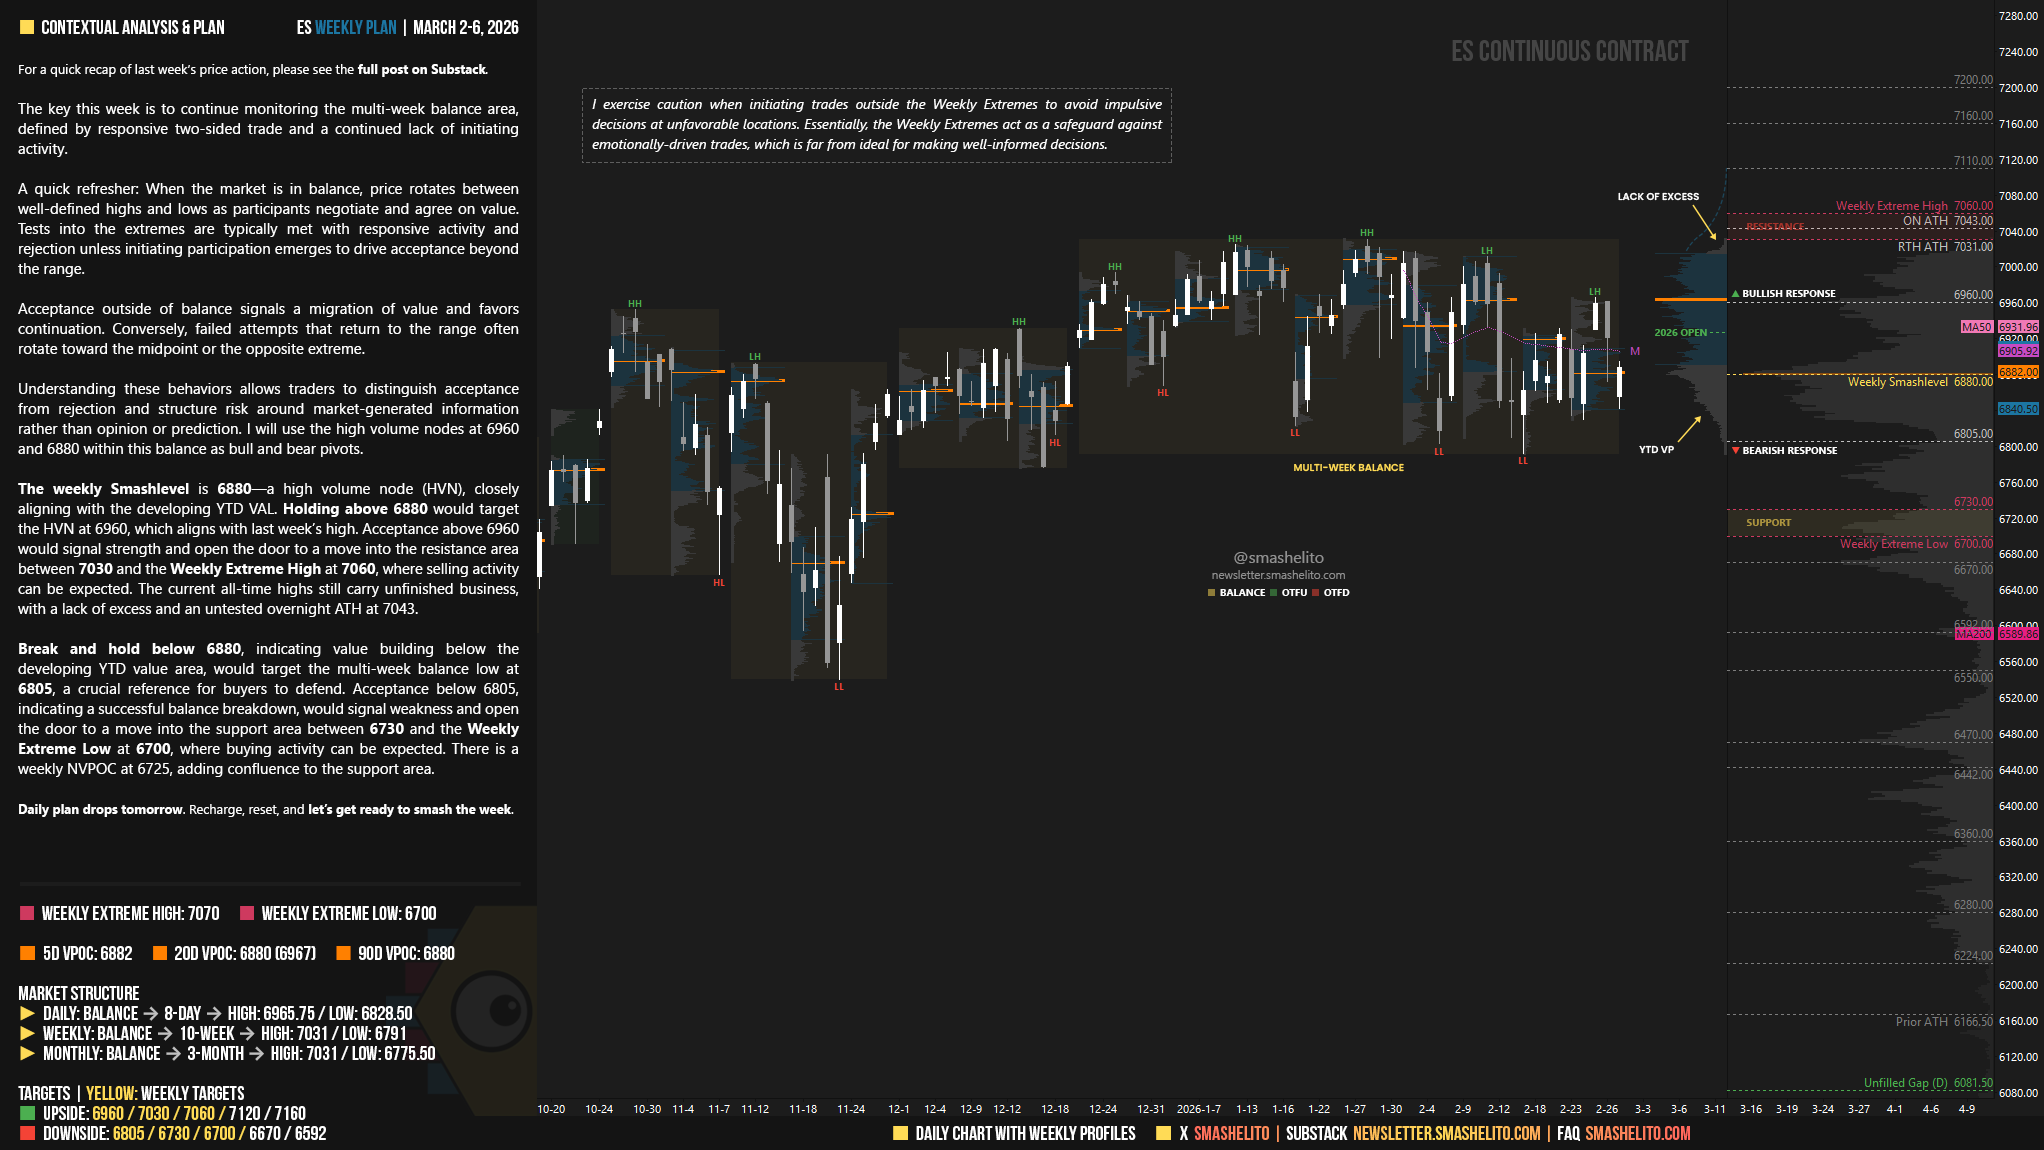
The key this week is to continue monitoring the multi-week balance area, defined by responsive two-sided trade and a continued lack of initiating activity.
A quick refresher: When the market is in balance, price rotates between well-defined highs and lows as participants negotiate and agree on value. Tests into the extremes are typically met with responsive activity and rejection unless initiating participation emerges to drive acceptance beyond the range.
Acceptance outside of balance signals a migration of value and favors continuation. Conversely, failed attempts that return to the range often rotate toward the midpoint or the opposite extreme.
Understanding these behaviors allows traders to distinguish acceptance from rejection and structure risk around market-generated information rather than opinion or prediction. I will use the high volume nodes at 6960 and 6880 within this balance as bull and bear pivots.
The weekly Smashlevel is 6880—a high volume node (HVN), closely aligning with the developing YTD VAL. Holding above 6880 would target the HVN at 6960, which aligns with last week’s high. Acceptance above 6960 would signal strength and open the door to a move into the resistance area between 7030 and the Weekly Extreme High at 7060, where selling activity can be expected. The current all-time highs still carry unfinished business, with a lack of excess and an untested overnight ATH at 7043.
Break and hold below 6880, indicating value building below the developing YTD value area, would target the multi-week balance low at 6805, a crucial reference for buyers to defend. Acceptance below 6805, indicating a successful balance breakdown, would signal weakness and open the door to a move into the support area between 6730 and the Weekly Extreme Low at 6700, where buying activity can be expected. There is a weekly NVPOC at 6725, adding confluence to the support area.
Key Levels of Interest
In the upcoming week, I will closely observe the behavior around 6880.
Holding above 6880 would target 6960 / 7030 / 7060* / 7120 / 7160
Break and hold below 6880 would target 6805 / 6730 / 6700* / 6670 / 6592
*Weekly Extremes (defined by proprietary models). I exercise caution when initiating trades outside the Weekly Extremes to avoid impulsive decisions at unfavorable locations. Essentially, the Weekly Extremes act as a safeguard against emotionally-driven trades, which is far from ideal for making well-informed decisions.
Daily plan drops tomorrow. Recharge, reset, and let’s get ready to smash the week.
Thanks Smash! Let's see if war headlines can get us moving.
Thanks Smash! Just noted, you wrote 7960 as first upside target - typo?