ES Weekly Plan | Mar 31 - Apr 4, 2025
Key Levels & Market Context for the Upcoming Week.
Economic Calendar
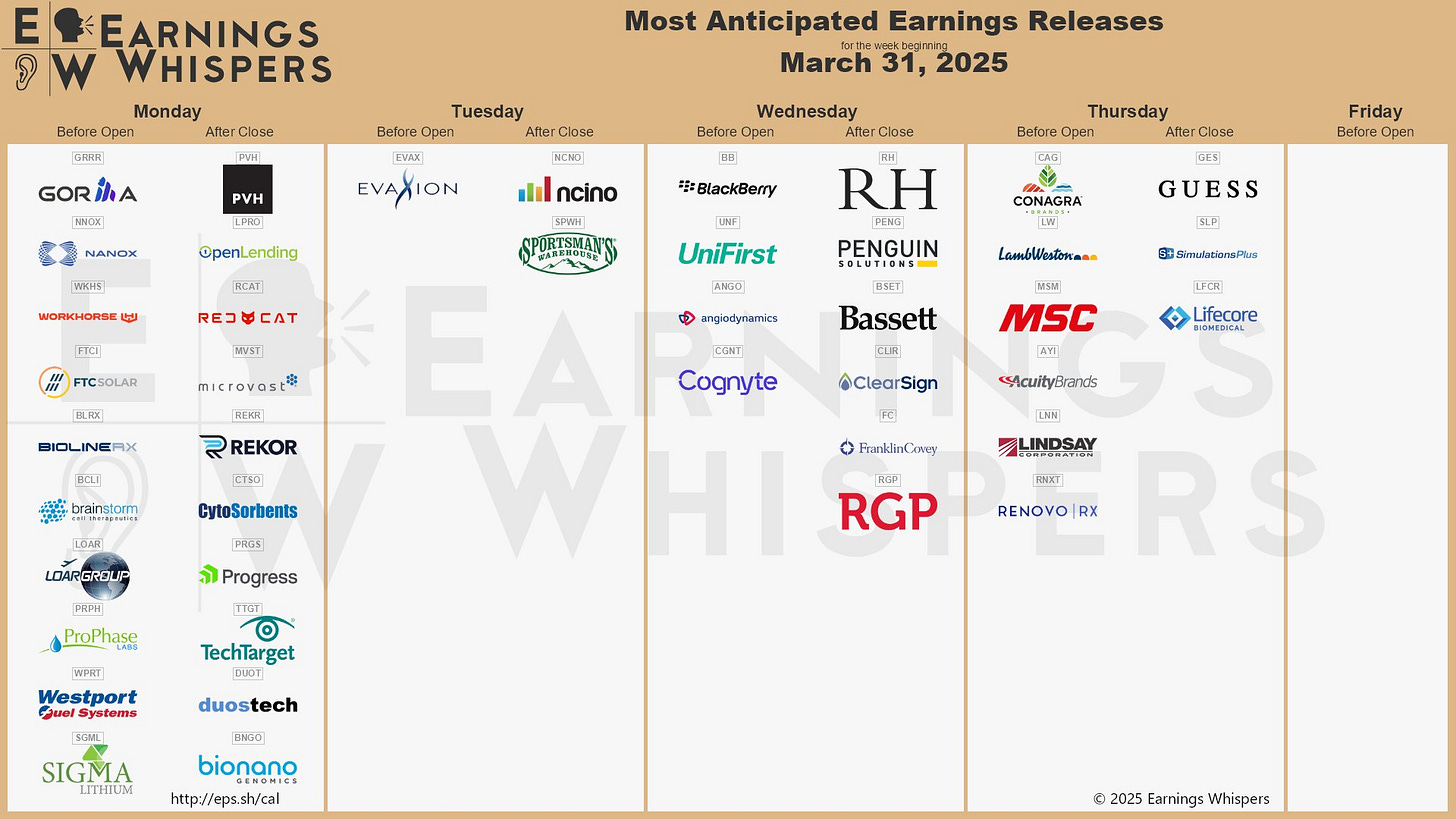
Earnings Calendar
Visual Representation
Market Structure
🟥 DAILY: OTFD | Ends: 5731.25
🟨 WEEKLY: BALANCE | 2W | 5837.25-5617.25
🟥 MONTHLY: OTFD | Ends: 5997
FYI: The one-time framing and balance concept becomes temporarily skewed during contract rollover due to the roll gap. I don’t back-adjust my charts.
Contextual Analysis
The previous week highlighted how powerful the balance guidelines are. Our main focus was on the 5-day balance area. The market experienced a breakout early in the week, leading to a test of the ATH VWAP and the weekly resistance area between 5835 and 5865, where the upside momentum stalled. Change took place on Wednesday, as sellers erased both Monday’s and Tuesday’s gains, closing back within the balance area, signaling that the breakout was in serious trouble. Thursday’s session continued to build value within the balance area, increasing the risk of testing the opposite side of the range, a common target area after a failed breakout. This was achieved on Friday, as the market formed a triple distribution trend day, ultimately resulting in an outside week down. The ESH25 roll gap at 5640 was filled in the process.

For this week, the main focus will be on whether sellers can sustain downside momentum following Friday’s triple distribution trend day, which ultimately established an outside week to the downside after traversing and breaking the previous week’s range. A weak market would sustain downside pressure by remaining below the 5662 level, keeping the inventory from the past two weeks trapped and opening the door for a revisit of the March 13th low. Failure to do so would set the stage for structural fills of Friday’s poor structure, which is clearly visible on last week’s volume profile. Sellers remain in short-term control, and only acceptance back within last week’s value area has the potential to shift that dynamic.
The weekly Smashlevel is 5662, representing Friday’s initial balance low (IBL), aligning with the lower end of the prior week. Break and hold above 5662 would target technical fills of Friday’s poor structure toward 5706. Acceptance above 5706 signals strength, targeting the resistance area from 5760 to the Weekly Extreme High of 5790, where selling activity can be expected. For any potential shift in the bigger picture, buyers would need to break and hold above the Weekly Extreme High, ideally confirmed by a weekly close above it.
Holding below 5662 would target Friday’s low at 5617. Break and hold below 5617 would target the 10% correction level at 5550. Acceptance below 5550 signals weakness, targeting the support area from 5480 to the Weekly Extreme Low of 5450, where buying activity can be expected. Additionally, there is an unfilled gap at 5396.75.
As usual, a detailed daily plan will be published tomorrow. In the meantime, enjoy the rest of your weekend!
Levels of Interest
In the upcoming week, I will closely observe the behavior around 5662.
Break and hold above 5662 would target 5706 / 5760 / 5790* / 5835 / 5865
Holding below 5662 would target 5617 / 5550 / 5480 / 5450 / 5410
*Weekly Extremes. I exercise caution when initiating trades outside the Weekly Extremes to avoid making impulsive decisions at unfavorable locations. Essentially, the Weekly Extremes serve as a safeguard against emotionally-driven trades, a state that is less than ideal for making well-informed trading decisions.


Thanks Smash have a good day!
Fantastic synopsis! Thx Smash!