
ES Weekly Plan | June 9-13, 2025
Recap, Market Context & Key Levels for the Week Ahead
Last Week’s Recap: June 2-6, 2025
Heading into last week, the main focus was the 3-week balance area between 5988 and 5780, where responsive two-sided activity had unfolded since the market gapped higher on May 12th. As previously discussed, consolidation at higher prices following a directional move is generally considered bullish until proven otherwise. Immediate attention was on the prior week’s inside week—a mini balance within the broader 3-week range. Monday’s session opened with early weakness, attracting responsive buyers at the lower end of the inside week. While the session ultimately developed into a double distribution trend day up, the entire range remained contained within the inside week.
Change took place on Tuesday, as the market established another double distribution trend day, breaking out of the inside week. This quickly led to a test of the 3-week balance high at 5988—a pivotal level throughout the week and one that will remain of interest going forward. Wednesday’s session was relatively uneventful, with the market consolidating within Tuesday’s upper distribution—a bullish indication in the context of Tuesday’s trend day.
Heading into Thursday’s session, the key question was whether the market would initiate a decisive breakout from the 3-week balance—having consolidated at its upper extreme—or if a liquidation break was needed first to shake out weak longs, trap some late sellers unaware of who was controlling the auction, and provide an opportunity for stronger buyers to step in. We got the early weakness, which attracted responsive buyers, and a breakout attempt was subsequently initiated. However, the market ultimately failed to sustain a continuation higher, resulting in weakness during the afternoon session, and the session closed back within the inside week range.
On Friday, the focus shifted to whether sellers could capitalize on the opportunity and maintain downside pressure within the inside week range, potentially targeting the opposite side of the balance. This scenario was quickly rejected, leading to the first daily close above the 3-week balance high at 5988.

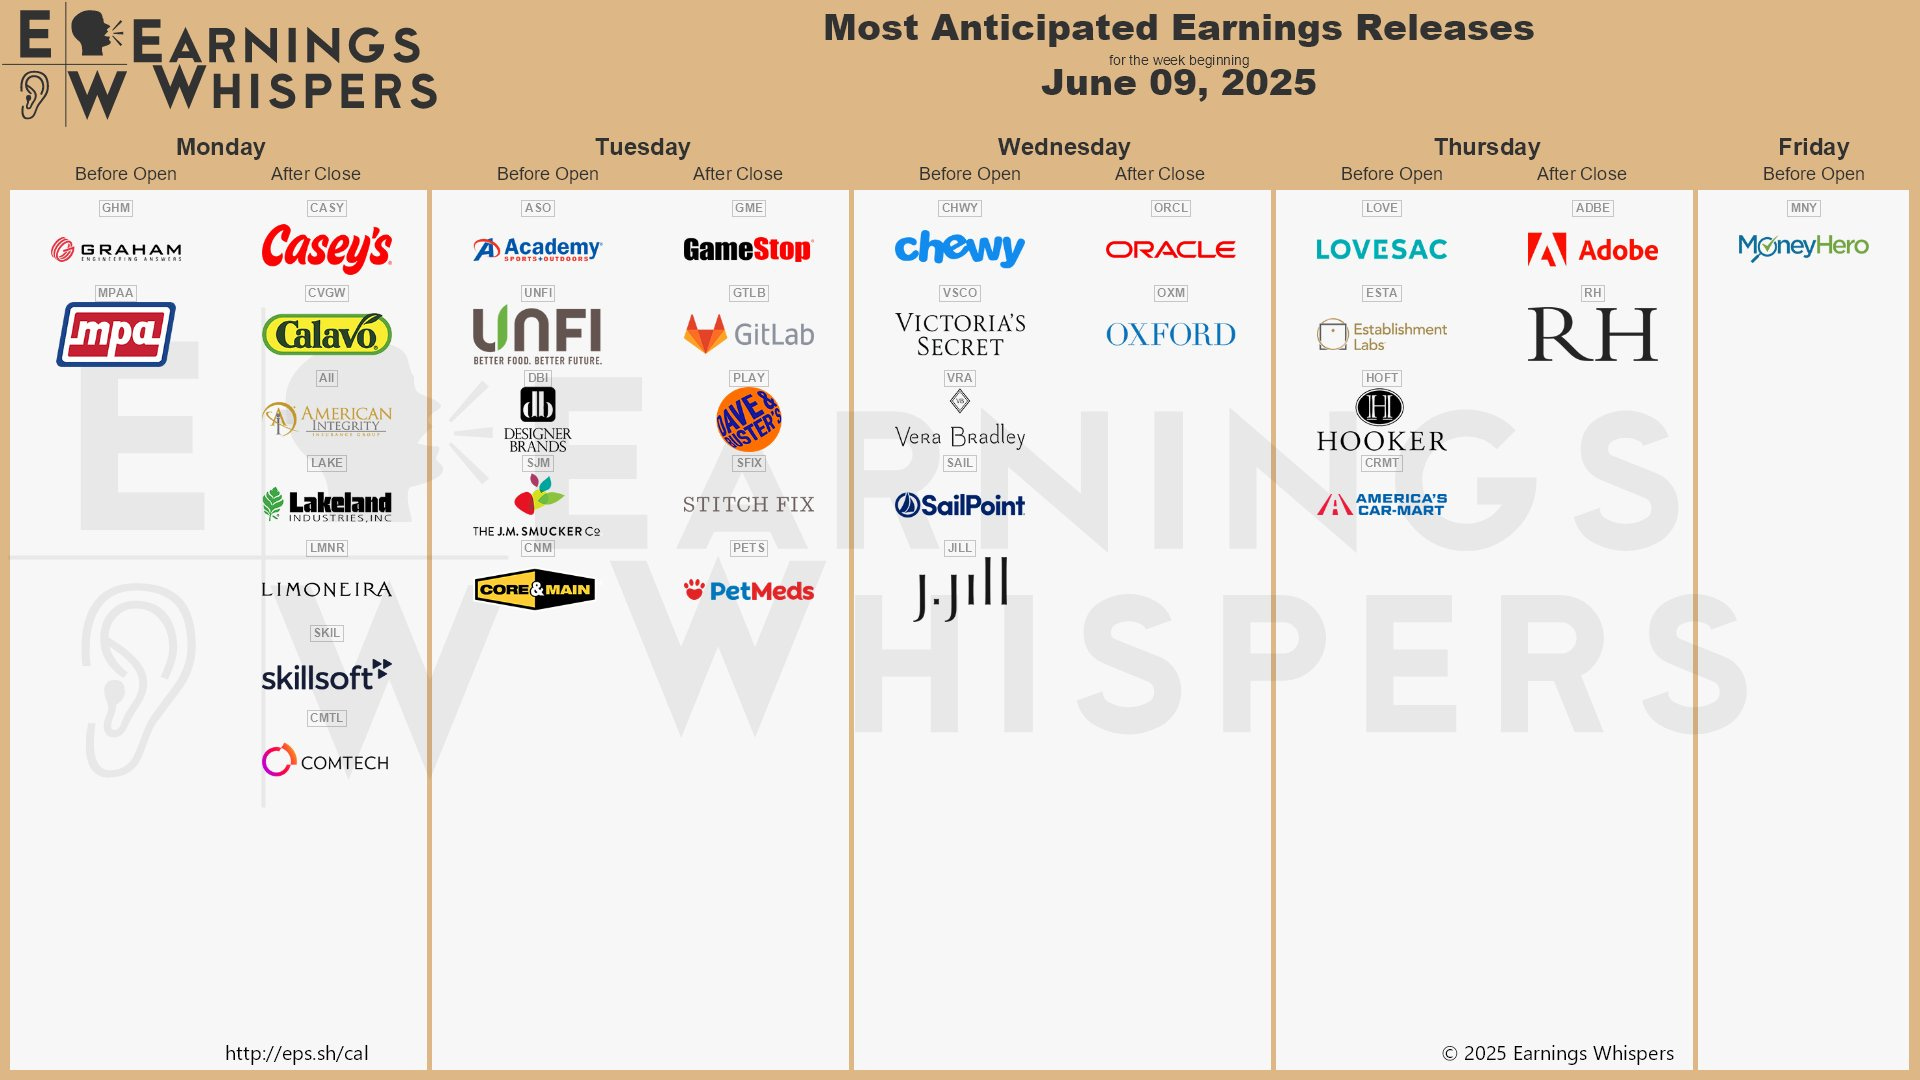
Economic & Earnings Calendar

Market Structure
🟩 Daily: OTFU → Ends at: 5984.50
🟩 Weekly: OTFU → Ends at: 5870.50
🟩 Monthly: OTFU
Balance: A market condition where price consolidates within a defined range, reflecting indecision as the market awaits more market-generated information. We apply balance guidelines—favoring fade trades at range extremes (highs/lows) and preparing for breakout setups if balance resolves.
One-Time Framing Up (OTFU): A market condition where each subsequent bar forms a higher low, signaling a strong upward trend.
One-Time Framing Down (OTFD): A market condition where each subsequent bar forms a lower high, signaling a strong downward trend.
Contextual Analysis & Plan
This week, the main focus is on the prior 3-week balance high at 5988, which the market finally closed above on Friday after struggling to do so during both Wednesday’s and Thursday’s sessions. While this marks a potential breakout, the move has lacked strong conviction so far, making it crucial to monitor for continuation in the short term. A strong market should show little interest in returning to the prior weekly balance area—signaling acceptance and increasing the odds of a move toward the all-time high at 6166.50, completing a full traverse of the prior multi-week balance range.
If the breakout fails, the high volume node at 5916 is likely to act as a downside magnet. As is typical with failed breakouts, the opposite end of the range becomes the next likely target. CPI data is scheduled for release on Wednesday, followed by PPI on Thursday.
The weekly Smashlevel is 5988—the prior 3-week‘s balance high. Holding above 5988 signals strength, with 6050 as the next upside target. Acceptance above 6050 would indicate further strength, opening the door for a move into the resistance area between 6135 and the Weekly Extreme High of 6170, where selling activity can be expected. This resistance area aligns with the non-back-adjusted all-time high (ATH) at 6166.50, which features a poor non-excess high in the form of a triple top on the daily chart.
Break and hold below 5988 would put the 3-week balance breakout into question, targeting the high volume node (HVN) at 5916. Acceptance below 5916 would signal weakness, opening the door for a move into the support area between 5875 and the Weekly Extreme Low of 5840, where buying activity can be expected. This support area aligns with last week’s low (5870), the inside week low (5856), and the unfilled weekly gap at 5843.75—a crucial area for buyers to defend. Failure to hold above it would open the door for a test of the 3-week balance low at 5780 and could eventually bring the unfilled weekly (5741) and daily (5710) gaps into play.

Levels of Interest
In the upcoming week, I will closely observe the behavior around 5988.
Holding above 5988 would target 6050 / 6135 / 6170* / 6225 / 6260
Break and hold below 5988 would target 5916 / 5875 / 5840* / 5780 / 5741
*Weekly Extremes. I exercise caution when initiating trades outside the Weekly Extremes to avoid making impulsive decisions at unfavorable locations. Essentially, the Weekly Extremes serve as a safeguard against emotionally-driven trades, a state that is less than ideal for making well-informed trading decisions.
Daily plan drops tomorrow. Recharge, reset, and let’s get ready to smash the week.
Thanks Smashelitoo!
Thank you