
ES Weekly Plan | June 2-6, 2025
Recap, Market Context & Key Levels for the Week Ahead
Last Week’s Recap: May 26–30, 2025
The key question heading into last week was whether sellers could follow through on the downside after attempting to push prices away from value on Friday the 23rd, which ended the weekly one-time framing up in the process. In the previous Weekly Plan, we noted that stronger sellers were not present during that Friday’s session — but if they managed to establish value below that week’s value area low (VAL: 5860), they could maintain downside pressure in the short term.
Monday’s session kicked off with a true gap higher, helped by tariff pause headlines, immediately rejecting sellers’ attempt to explore lower prices. Trading activity for the rest of the week remained confined within the prior week’s value area during regular trading hours, resulting in an inside week and marking three consecutive weeks with unchanged value.
The most notable sequence of the week unfolded Wednesday pre-market, following another round of tariff headlines, when the market attempted a breakout from the 2-week balance area. This breakout attempt was met with responsive selling and ultimately failed after the market failed to hold above the Weekly Extreme High at 5988.
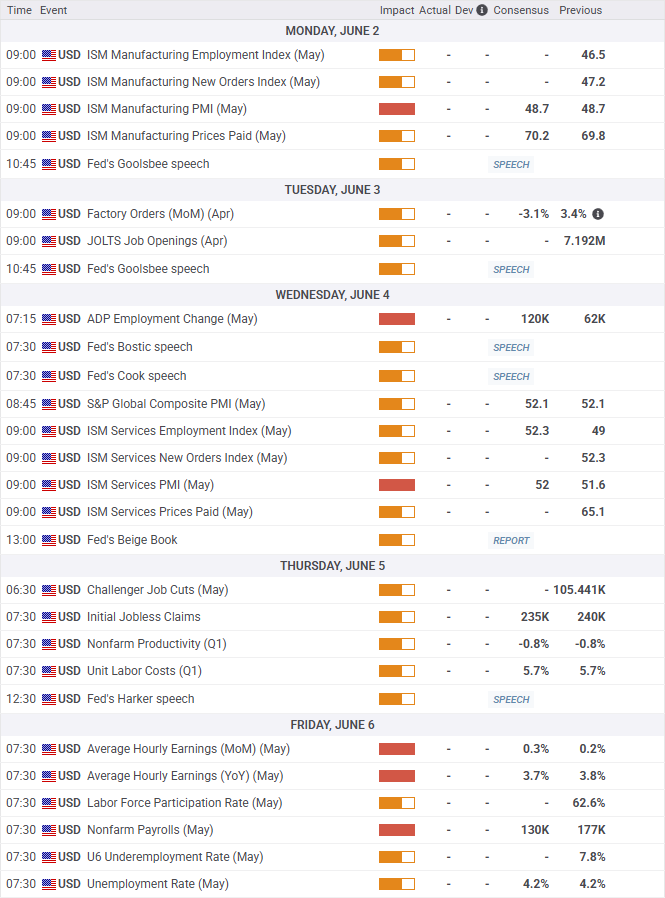
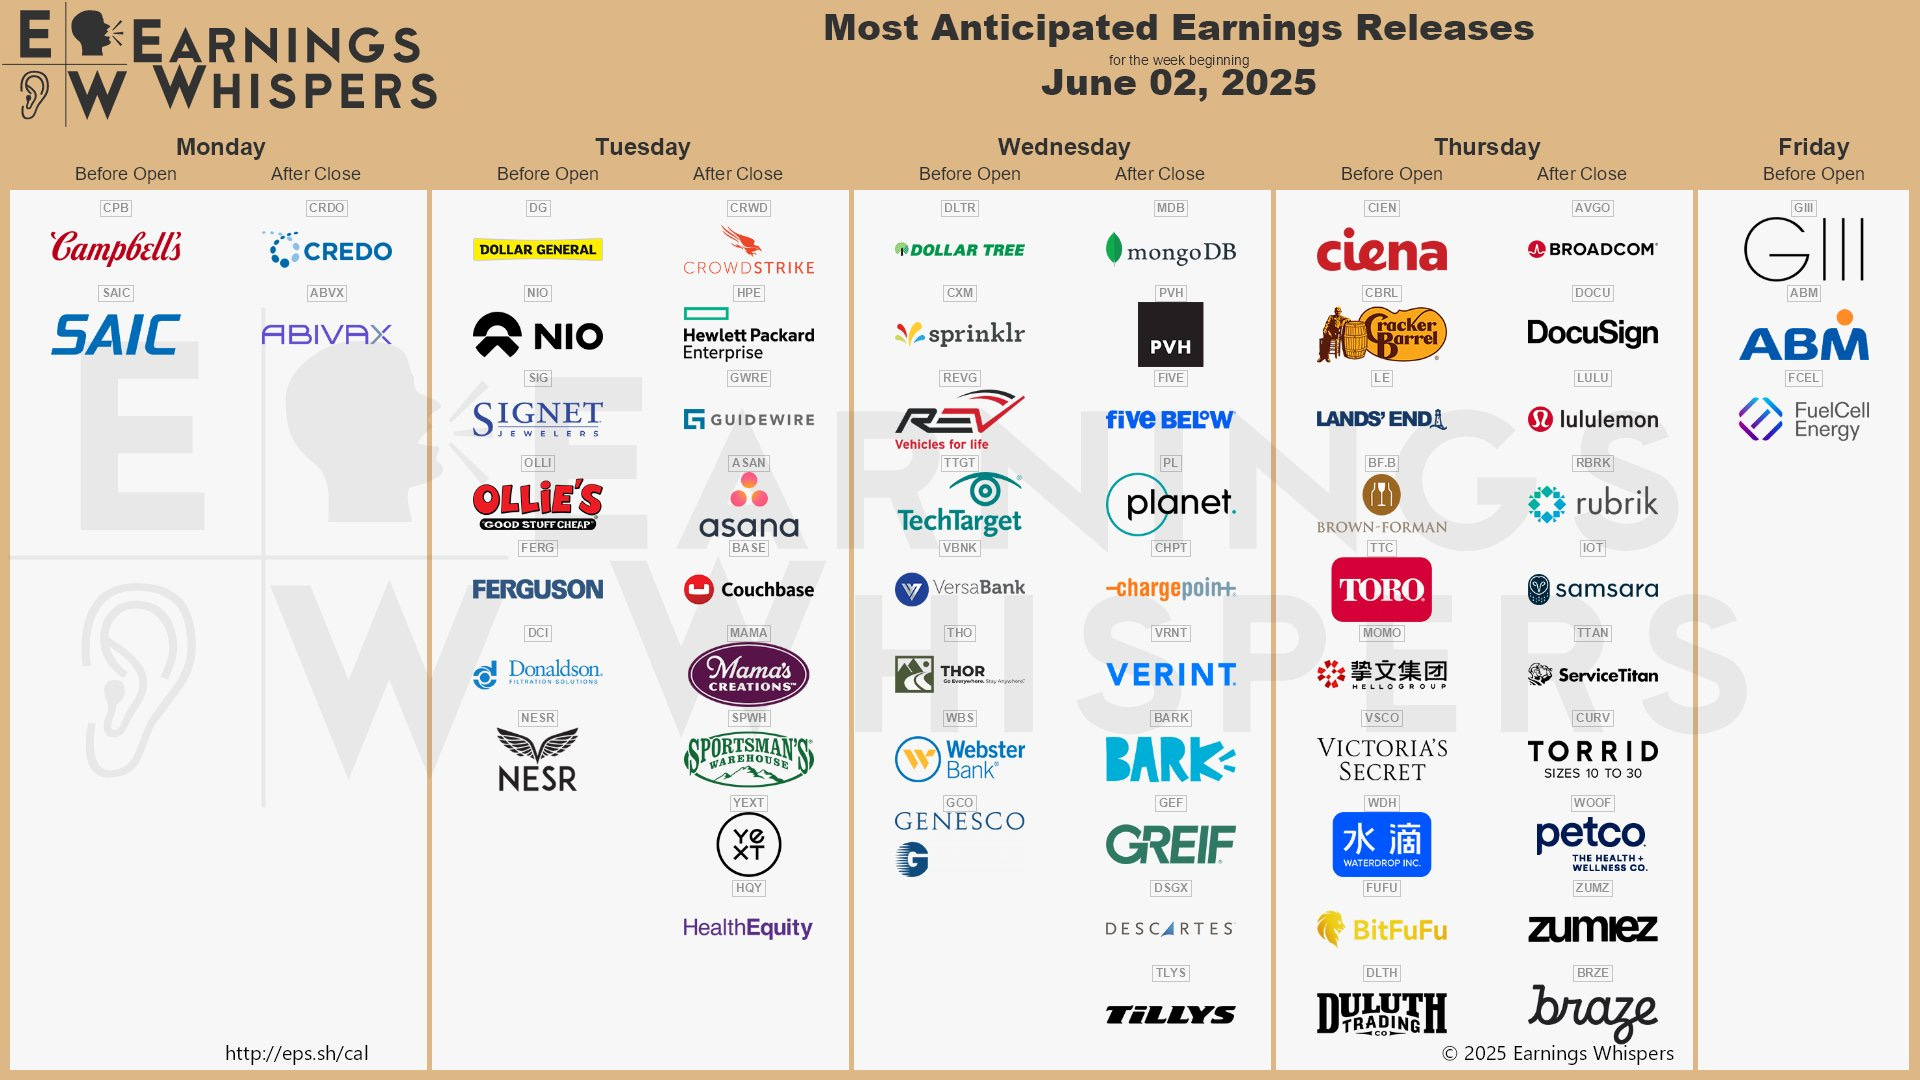
Economic & Earnings Calendar
Market Structure
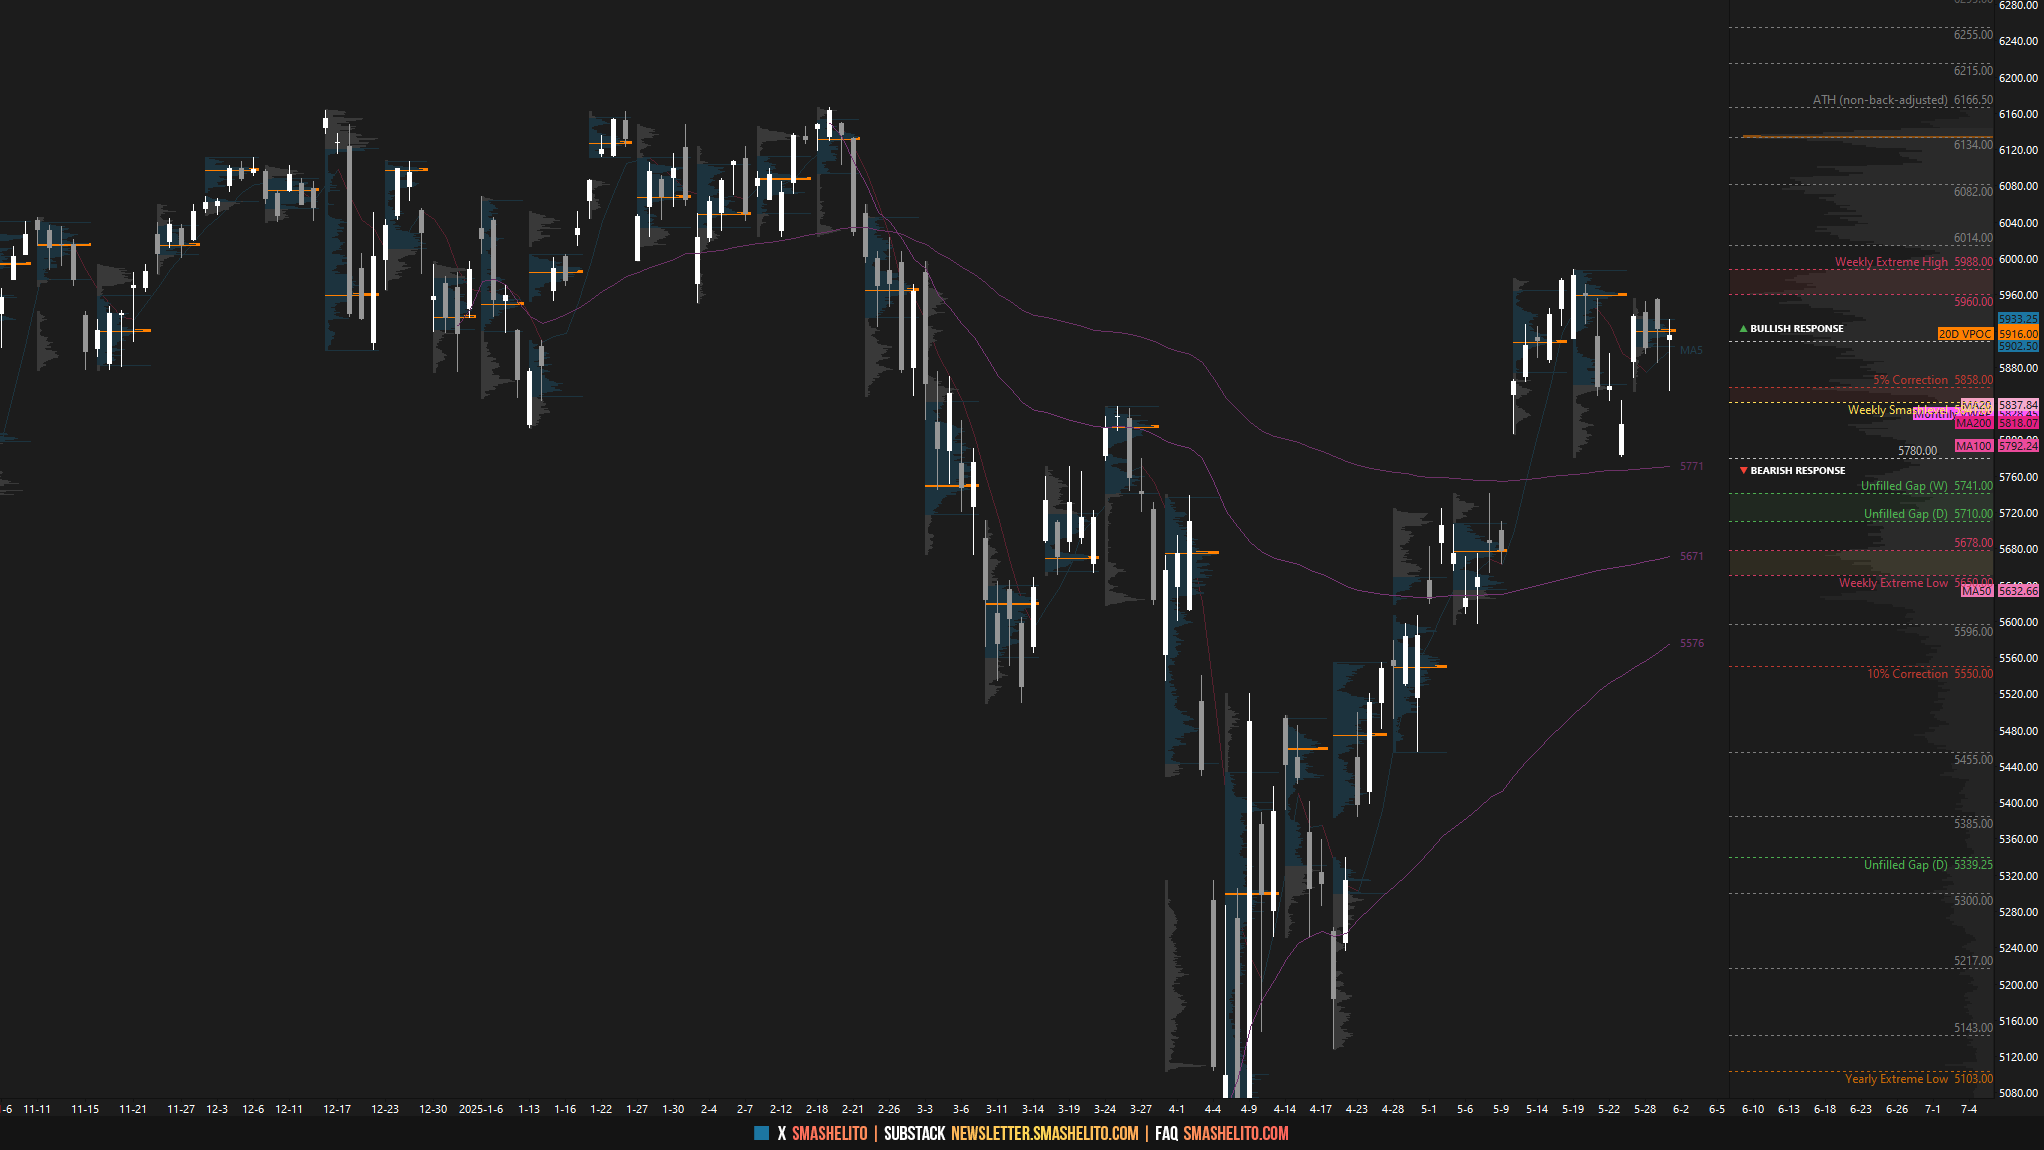
🟨 Daily: BALANCE → 4-Day → High: 5956.25 / L: 5853.25
🟨 Weekly: BALANCE → 2-Week → High: 5987.50 / L: 5780.50
🟨 Monthly: BALANCE → 3-Month → High: 5997 / L: 4867
Balance: A market condition where price consolidates within a defined range, reflecting indecision as the market awaits more market-generated information. We apply balance guidelines—favoring fade trades at range extremes (highs/lows) and preparing for breakout setups if balance resolves.
One-Time Framing Up (OTFU): A market condition where each subsequent bar forms a higher low, signaling a strong upward trend.
One-Time Framing Down (OTFD): A market condition where each subsequent bar forms a lower high, signaling a strong downward trend.
Contextual Analysis & Plan
This week, the main focus is on the current 3-week balance area between 5988 and 5780, where responsive two-sided activity has unfolded since the market gapped higher on May 12th. That weekly gap at 5741 remains unfilled. Immediate attention is on last week’s inside week—a mini balance within the broader range. The key principle remains: the longer the consolidation, the more significant the eventual breakout tends to be. Within the context of the recent rally, a market consolidating at higher prices and showing little interest in corrective activity is considered bullish—until proven otherwise. A sustained breakdown from this balance, including a gap fill at 5741 and acceptance back within the prior balance area from early May, is the only scenario that introduces the potential for change—opening the door to further weakness.
When the market is in balance, we use the balance guidelines as a framework to form trade hypotheses based on how price behaves around that balance area. A balanced market reflects agreement on value, typically showing rotational behavior between clearly defined highs and lows. In this environment, the first guideline is to look for trades that fade moves toward the extremes of the balance, as these are often rejected unless supported by strong participation.
If price breaks out of the balance area and shows signs of acceptance—such as holding above or below the prior extremes—we follow the direction of the break, anticipating that the market is initiating a move to discover a new area of value. However, if the breakout attempt fails and price returns back into the prior range, it often signals a lack of conviction. In that case, the expectation shifts to a move toward the opposite end of the balance. Breakouts that go against the broader market tone—such as upside breaks in bearish environments or downside breaks in bullish ones—tend to have a higher likelihood of failure, as they lack alignment with the prevailing directional bias and underlying sentiment.
These guidelines are not rigid but serve as context-driven cues to assess whether the market is accepting higher or lower prices, or rejecting them in favor of prior value. They provide a structured way to manage risk by offering clear invalidation points and supporting decision-making across both rotational and directional market conditions.
The weekly Smashlevel is 5955—the upper end of last week’s inside week. Break and hold above 5955 would target the 3-week balance high at 5988. Acceptance above 5988 would signal strength, opening the door for a move into the resistance area between 6045 and the Weekly Extreme High of 6085, where selling activity can be expected. This resistance area aligns with the poor structure left behind during the multi-distribution trend day on February 21st.
Holding below 5955 would target the unfilled daily gap at 5843.75. Acceptance below 5843.75 would signal weakness, targeting the support area between the 3-week balance low at 5780 and the Weekly Extreme Low of 5740, where buying activity can be expected. This support area aligns with the unfilled weekly gap at 5741—a crucial level for buyers to defend, as acceptance back within the prior balance area from early May would trap three weeks’ worth of inventory and open the door to a deeper correction.

Levels of Interest
In the upcoming week, I will closely observe the behavior around 5955.
Break and hold above 5955 would target 5988 / 6045 / 6085* / 6134 / 6166
Holding below 5955 would target 5843 / 5780 / 5740* / 5710 / 5650
*Weekly Extremes. I exercise caution when initiating trades outside the Weekly Extremes to avoid making impulsive decisions at unfavorable locations. Essentially, the Weekly Extremes serve as a safeguard against emotionally-driven trades, a state that is less than ideal for making well-informed trading decisions.
Daily plan drops tomorrow. Recharge, reset, and let’s get ready to smash the week.
Thanks Smash!
Thank you very much!