
ES Weekly Plan | July 6-10, 2026
Recap, Market Context & Key Levels for the Week Ahead

Welcome to this week’s plan. Inside, you’ll find a quick review of last week’s price action, key economic events, market structure, context for the week ahead, and the levels I’ll be focusing on. Let’s get prepared.
Contents
Last Week in Review
Economic & Earnings Calendar
Market Structure
Contextual Analysis & Plan
Key Levels of Interest
Last Week in Review
Last week’s plan:

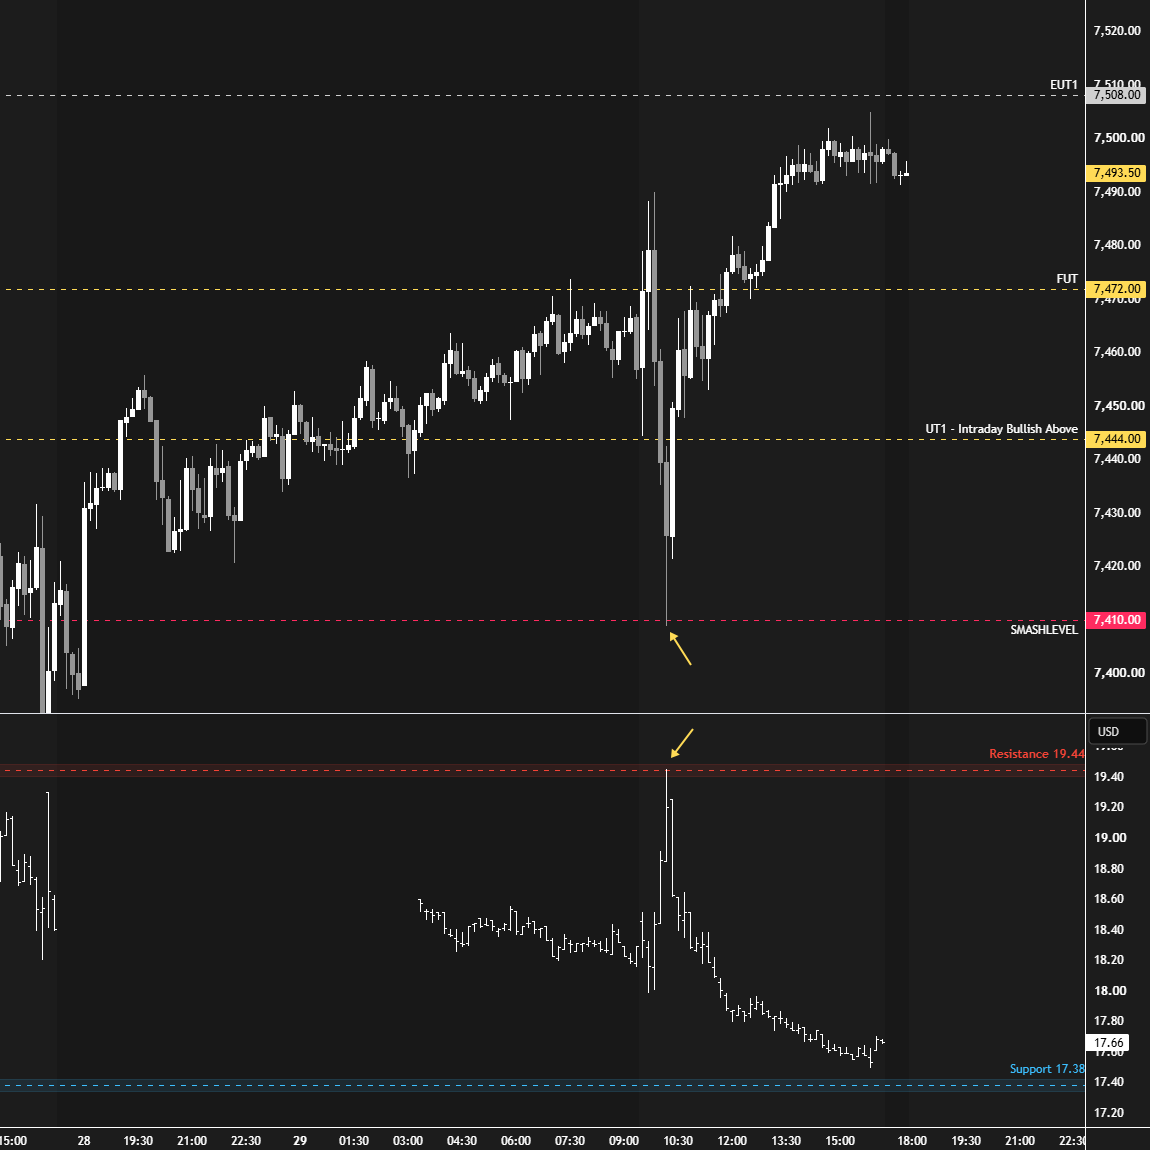
Last week kicked off with a rally off the key level at 7410, effectively rejecting the closing weakness from the prior week. This ultimately marked the low of the week.
It was interesting to observe how well the VIX levels performed throughout the week, as published in each daily plan. Note the confluence with VIX resistance during Monday’s session, when buyers defended the 7410 level (see Figure 1).
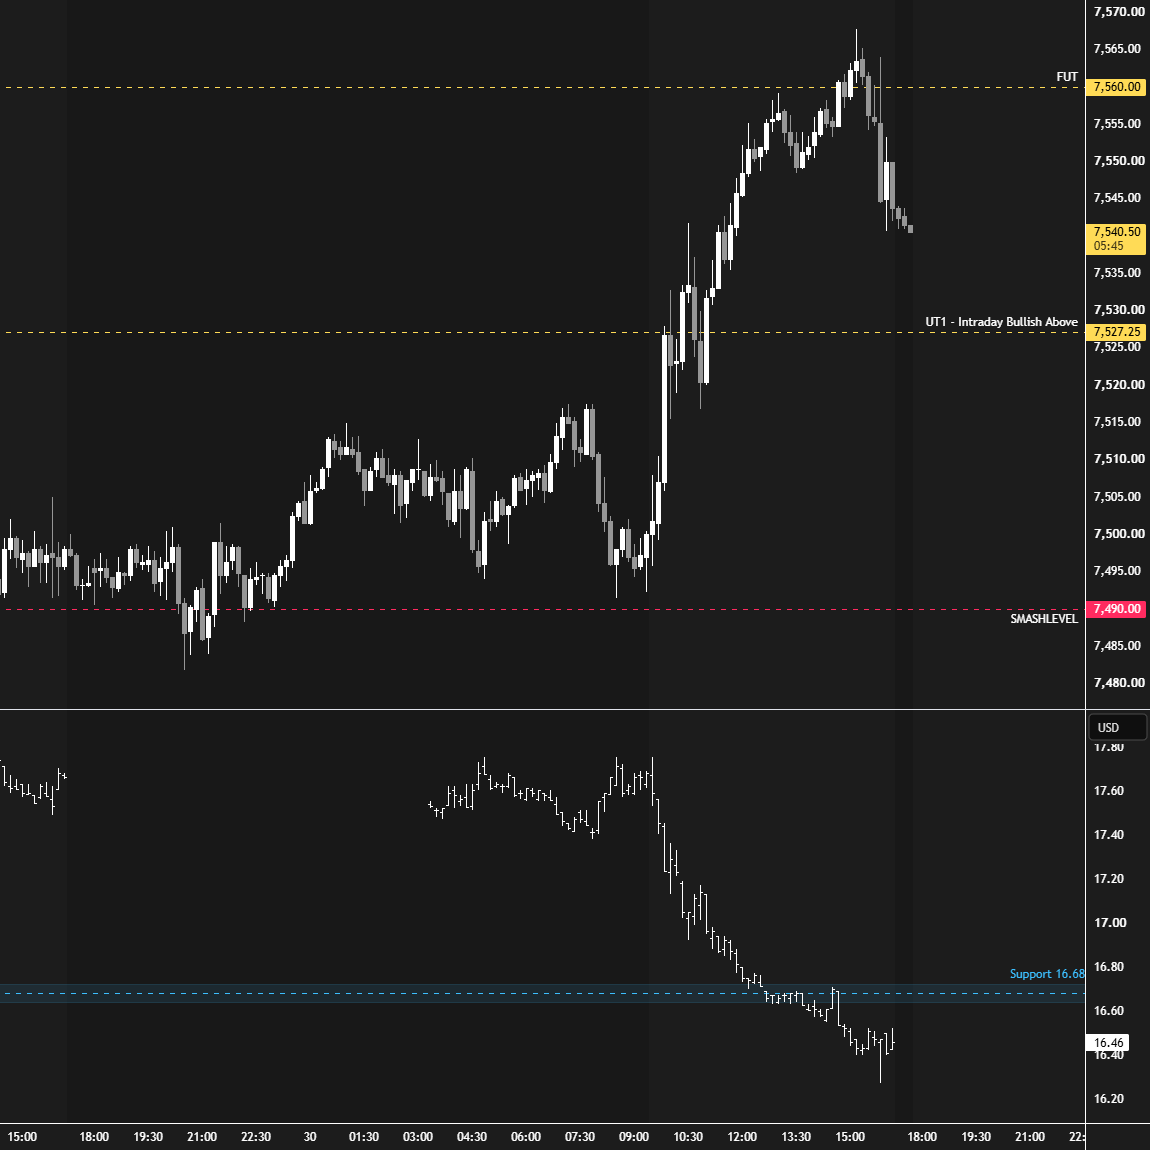
Change took place on Tuesday as buyers built on Monday’s momentum and initiated a breakout from the multi-day balance area.
The Smashlevel for Tuesday was 7490, which was defended by buyers and resulted in a move toward the final upside target at 7560 (FUT) (see Figure 2).
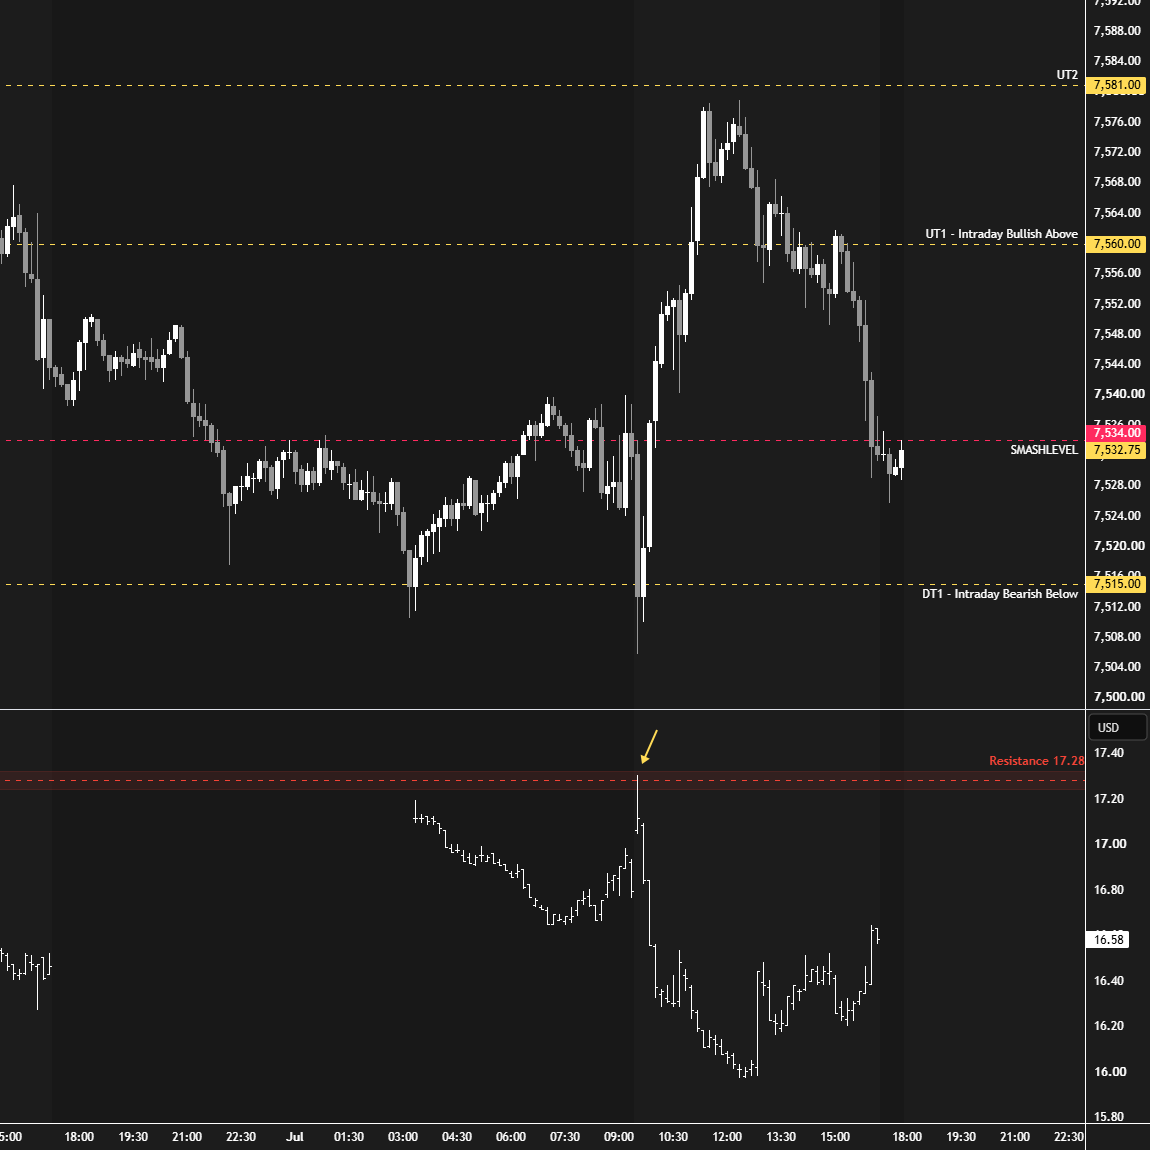
On Wednesday, the VIX resistance level marked the low of the day (see Figure 3), while the VIX support level marked the high of the day on Thursday (see Figure 4).
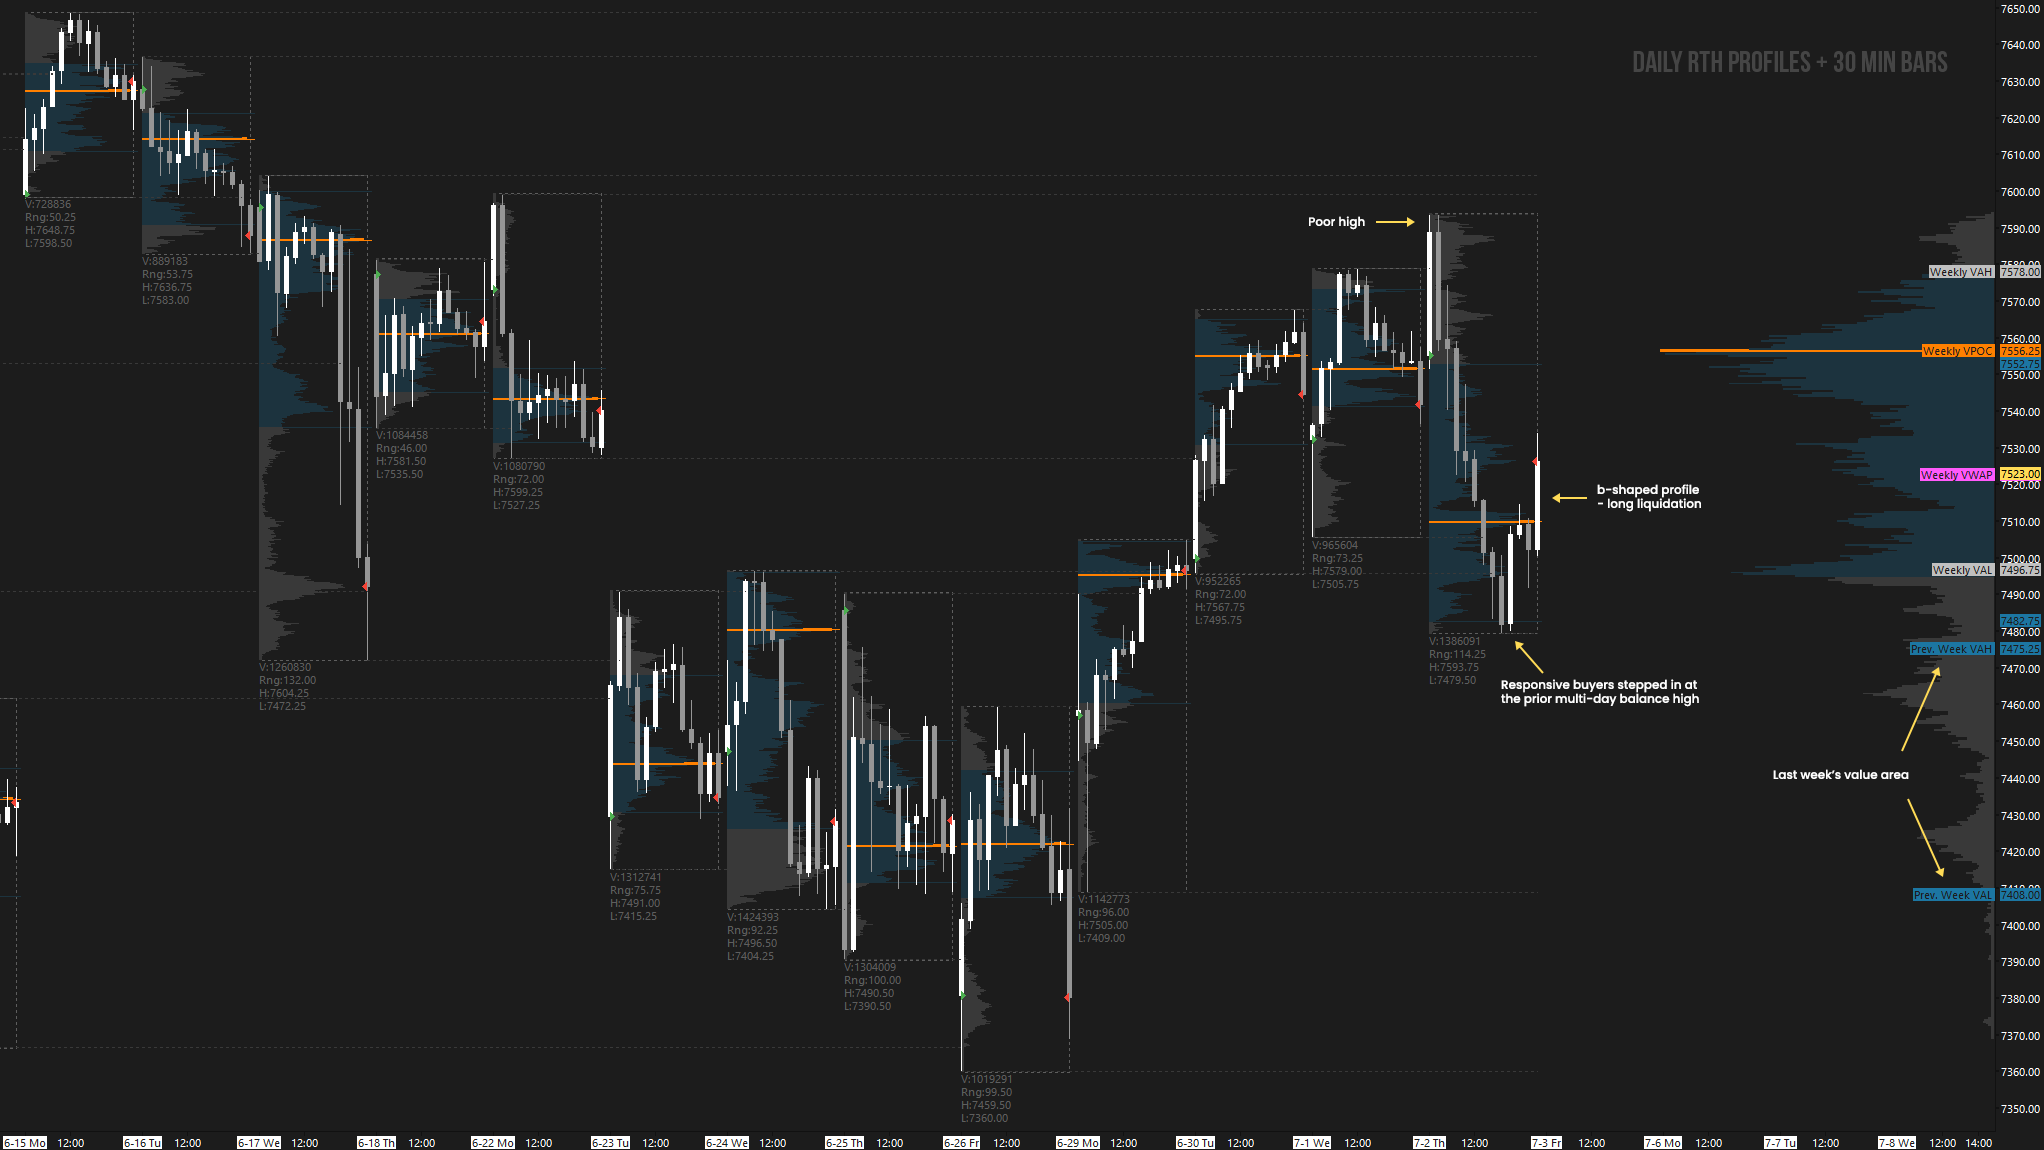
The auction has ultimately developed into a 3-day balance area after Tuesday’s breakout, and the key in the short term will be to monitor whether buyers can continue to build value above the prior multi-day balance area.
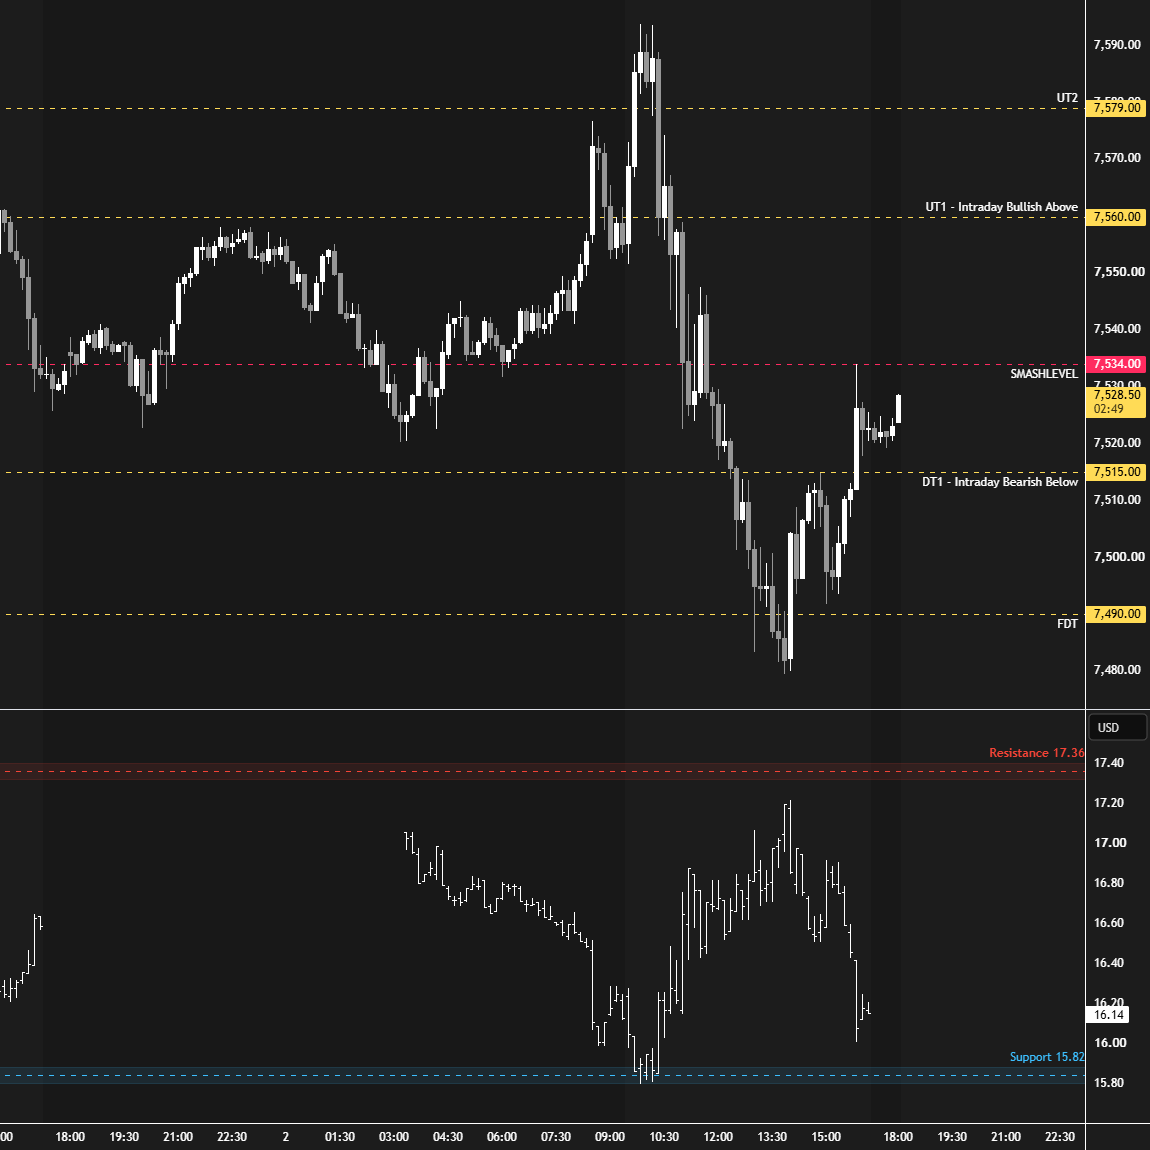
Note Thursday’s b-shaped profile, indicative of long liquidation (see Figure 5). Responsive buyers stepped in at the upper end of the prior multi-day balance, suggesting that despite a weak session, stronger sellers were not present.
Also, note last week’s VPOC at 7556 and last week’s VAL at 7497, which also aligns with a HVN. The auction could remain choppy within the 7497–7556 range, while acceptance outside this range may lead to more directional trade.
Last Week’s Levels in Review
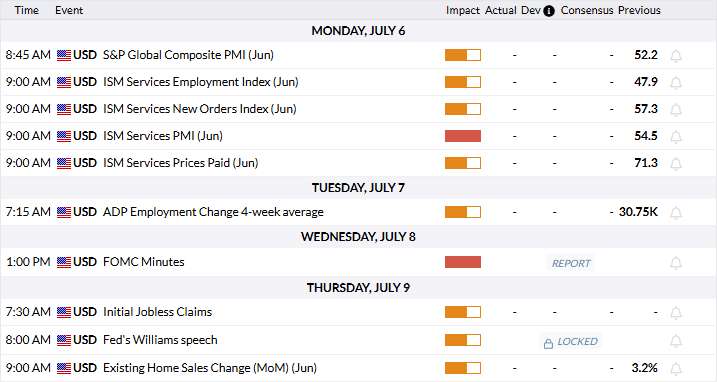
Economic & Earnings Calendar
Central Standard Time
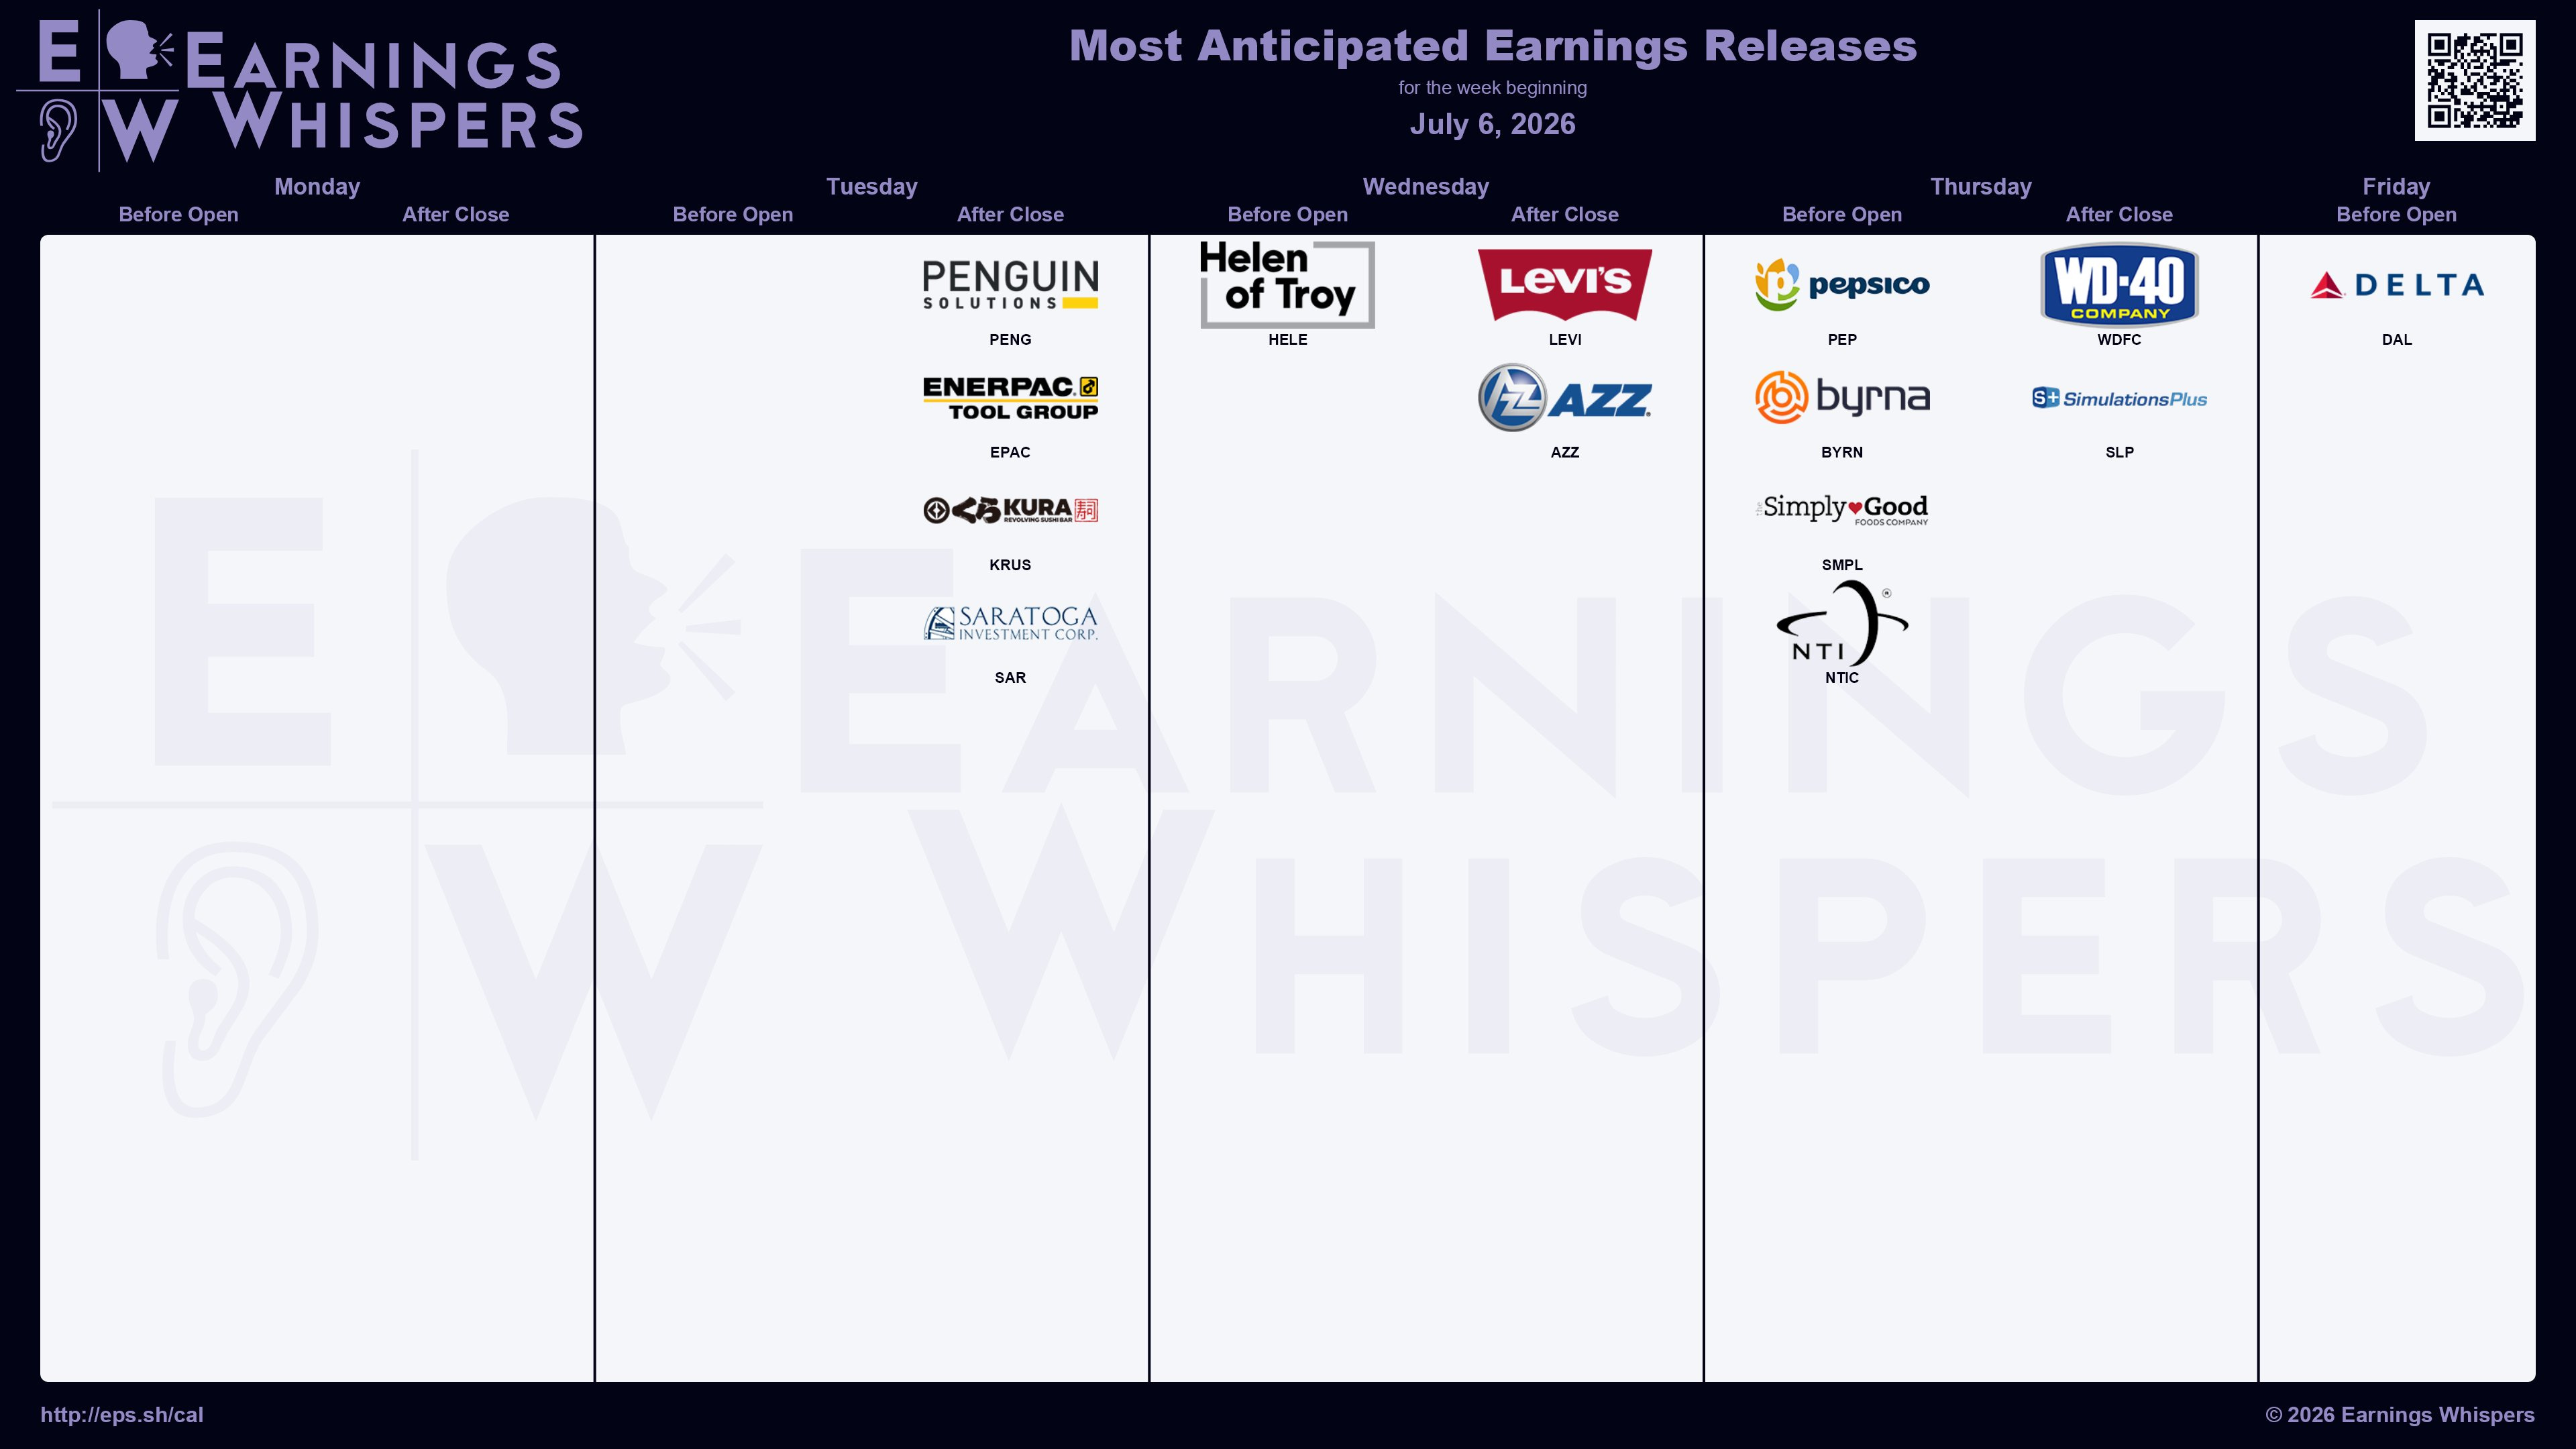
Earnings Whispers
Market Structure
🟨 Daily: BALANCE → 3-day → High: 7593.75 / Low: 7479.50
🟨 Weekly: BALANCE → 8-week → High: 7648.75 / Low: 7247.25
🟩 Monthly: OTFU → Ends at: 7247.25
Balance: A market condition where price consolidates within a defined range, reflecting indecision as the market awaits more market-generated information. We apply balance guidelines, favoring fade trades at range extremes (highs/lows) and preparing for breakout setups if balance resolves.
One-Time Framing Up (OTFU): A market condition where each subsequent bar forms a higher low, signaling a strong upward trend.
One-Time Framing Down (OTFD): A market condition where each subsequent bar forms a lower high, signaling a strong downward trend.
Contextual Analysis & Plan
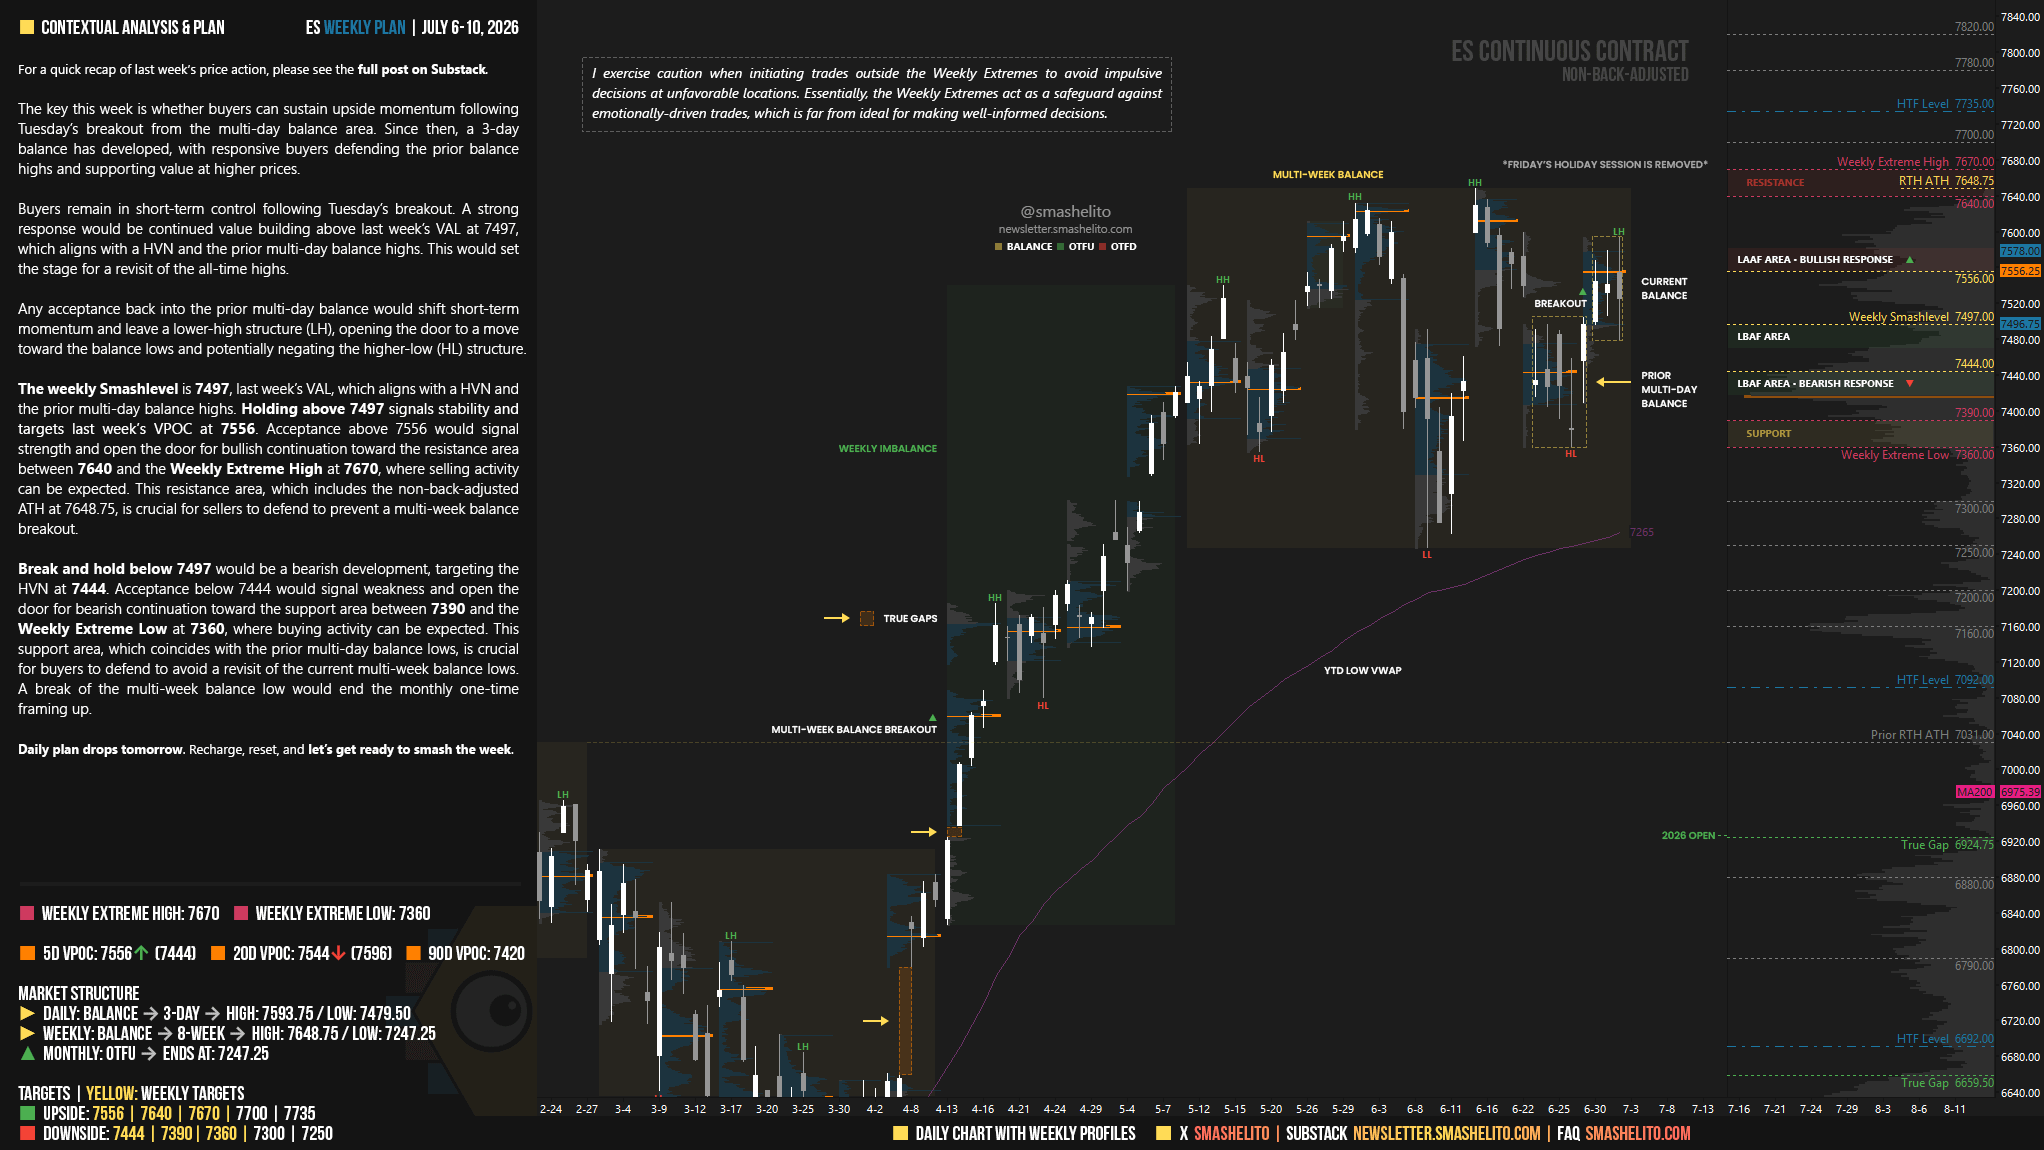
The key this week is whether buyers can sustain upside momentum following Tuesday’s breakout from the multi-day balance area. Since then, a 3-day balance has developed, with responsive buyers defending the prior balance highs and supporting value at higher prices.
Buyers remain in short-term control following Tuesday’s breakout. A strong response would be continued value building above last week’s VAL at 7497, which aligns with a HVN and the prior multi-day balance highs. This would set the stage for a revisit of the all-time highs.
Any acceptance back into the prior multi-day balance would shift short-term momentum and leave a lower-high structure (LH), opening the door to a move toward the balance lows and potentially negating the higher-low (HL) structure.
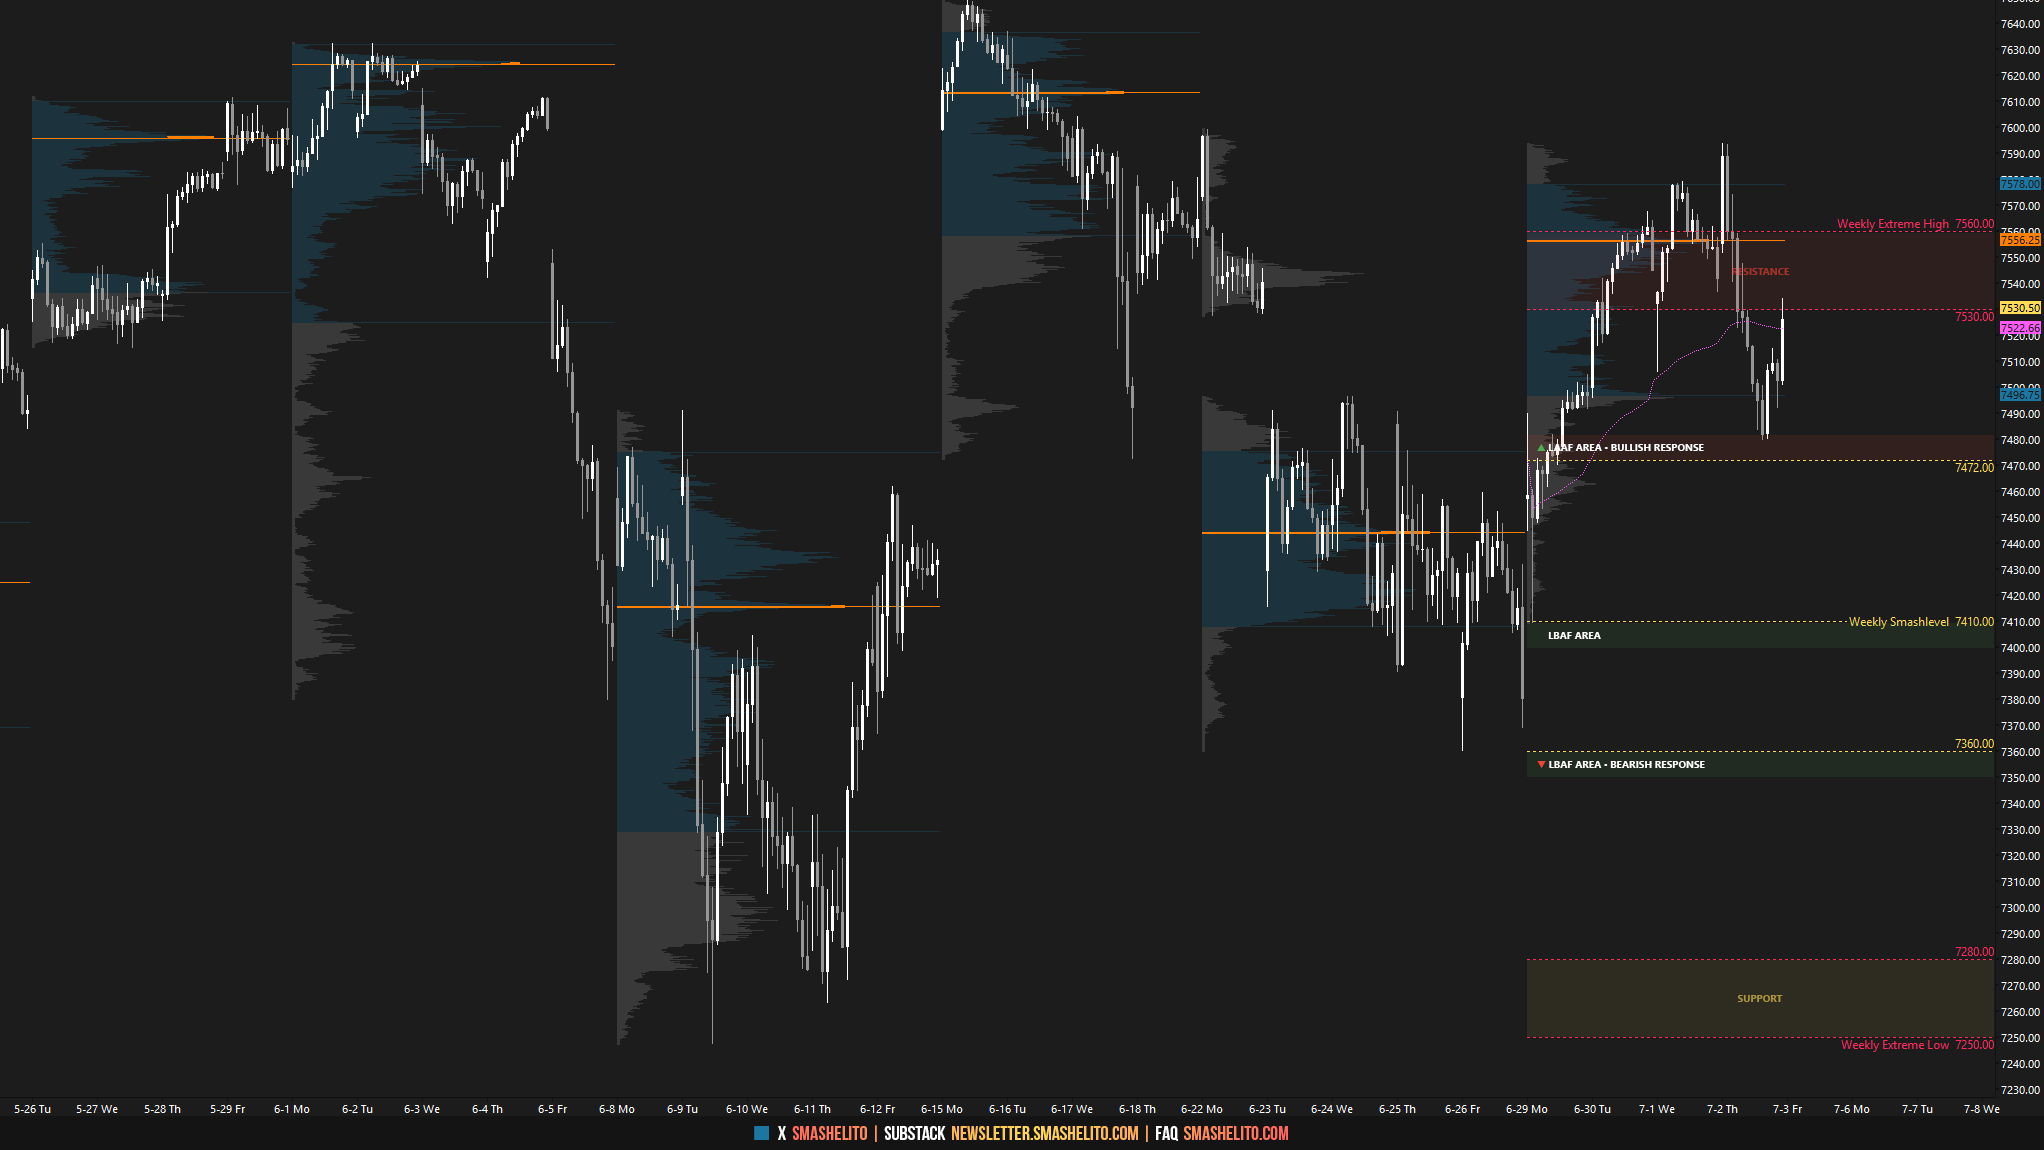
The weekly Smashlevel is 7497, last week’s VAL, which aligns with a HVN and the prior multi-day balance highs. Holding above 7497 signals stability and targets last week’s VPOC at 7556. Acceptance above 7556 would signal strength and open the door for bullish continuation toward the resistance area between 7640 and the Weekly Extreme High at 7670, where selling activity can be expected.
This resistance area, which includes the non-back-adjusted ATH at 7648.75, is crucial for sellers to defend to prevent a multi-week balance breakout.
Break and hold below 7497 would be a bearish development, targeting the HVN at 7444. Acceptance below 7444 would signal weakness and open the door for bearish continuation toward the support area between 7390 and the Weekly Extreme Low at 7360, where buying activity can be expected.
This support area, which coincides with the prior multi-day balance lows, is crucial for buyers to defend to avoid a revisit of the current multi-week balance lows. A break of the multi-week balance low would end the monthly one-time framing up.
Visual Representation
Key Levels of Interest
In the upcoming week, I will closely observe the behavior around 7497.
Holding above 7497 would target 7556 / 7640 / 7670* / 7700 / 7735
Break and hold below 7497 would target 7444 / 7390 / 7360* / 7300 / 7250
*Weekly Extremes (defined by proprietary models). I exercise caution when initiating trades outside the Weekly Extremes to avoid impulsive decisions at unfavorable locations. Essentially, the Weekly Extremes act as a safeguard against emotionally-driven trades, which is far from ideal for making well-informed decisions.
Daily plan drops tomorrow. Recharge, reset, and let’s get ready to smash the week.
Than you Smash!
Thank you
Grateful for your hard work on a holiday weekend
Recharge