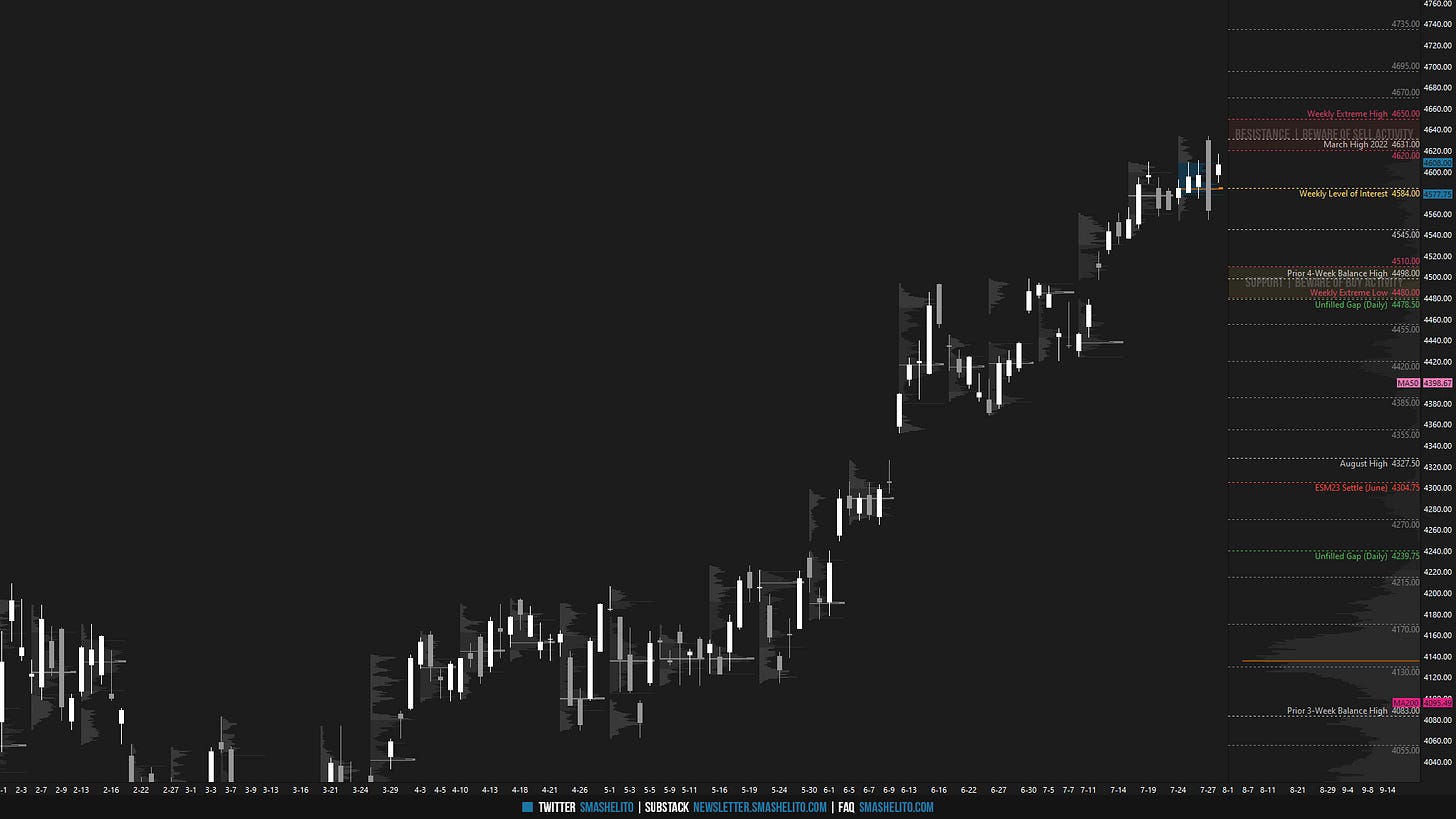
ES Weekly Plan | July 31 - August 4, 2023
Below are my expectations for the week ahead.
🟨 Daily: BALANCE | 5D | H: 4633.50 L: 4553.75
🟩 Weekly: OTFU | Ends: 4553.75
🟩 Monthly: OTFU | Ends: 4178
Weekly Extreme High: 4690
Weekly Extreme Low: 4525
As usual, a detailed daily plan will be published tomorrow.
During the previous week, the market traded within the prior week’s range for the first three days, essentially establishing a poor high on the daily chart, characterized by three daily highs positioned closely together. On Thursday, the session was very emotional following a true gap to the upside, which buyers failed to maintain, leaving an excess high (16 ticks). Sell activity was observed within the weekly resistance area, highlighted in the previous plan, resulting in a multi-distribution trend day down, during which several daily lows were breached in the process. On Friday, the poor structure was cleaned up, as sellers once again faced challenges in gaining downside traction. However, the buyers were unable to establish acceptance within Thursday's upper distribution, which means the excess high remains intact, at least for now.

For this week, the main focus will be on the value area high from the previous week, located at 4609, which coincides with the high from two weeks ago. Taking Thursday's excess high into consideration, the buyers are looking to quickly reclaim the 4609 level to challenge and negate the excess. Meanwhile, sellers are equally committed to defending the same level, as they effectively did during Friday's PM session. The market continues to establish value at higher prices following the breakout from the 4-week balance area, as observed on the 7-week volume profile that I have included. This serves as a bullish indication in context of the recent directional upward move.
The weekly level of interest is 4609, representing both the value area high from the previous week and also the high from two weeks ago. Break and hold above 4609 would target the 5DB high at 4634. Break and hold above 4634 would shift the daily to one time framing up, and target the resistance area from 4660 to the Weekly Extreme High of 4690, where selling activity can be expected. Additionally, take note of the 100% range extension from the prior 4-week balance at 4645.
Holding below 4609 would target 4584, which represents both the short- and medium-term value, which have a tendency to act as a magnet in the absence of initiative activity. Break and hold below 4584 would target the support area from 4555 to the Weekly Extreme Low of 4525, where buying activity can be expected. 4555 (4553.75) is the 5DB low, and a break of this level would shift the daily to one time framing down. More significantly, it would also put an end to the weekly one-time framing up. As I’ve mentioned since the month of April, for any significant change to occur in the bigger picture, the sellers would need to break and hold below the Weekly Extreme Low, with a weekly close below it being preferred, which has yet to occur.
🟩 Upside: 4634 | 4660 | 4690 | 4735 | 4760
🟥 Downside: 4584 | 4555 | 4525 | 4498 | 4478
Economic Calendar
Disclaimer: Futures and options trading involves a high level of risk, with the potential for substantial losses. The information provided in this newsletter is for informational purposes only and is not intended to be a trade recommendation. It is the responsibility of the reader to make their own investment decisions and they should seek the advice of a qualified securities professional before making any investments. The owners/authors of this newsletter are not certified as registered financial professionals or investment advisers.


Nice and perfect analysis according to market profile !!